
Key Insights
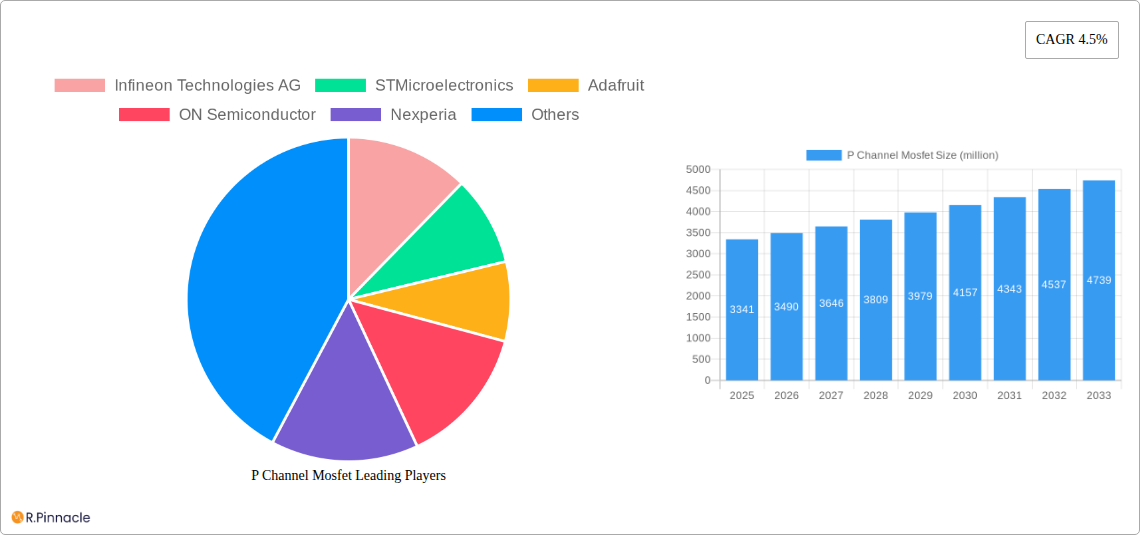
The P-Channel MOSFET market, valued at approximately $3.341 billion in 2025, is projected to experience steady growth, driven by increasing demand across diverse sectors. The 4.5% Compound Annual Growth Rate (CAGR) signifies a consistent expansion, primarily fueled by the burgeoning electronics industry's need for efficient power management and miniaturization. Automotive applications, particularly electric vehicles and hybrid systems, are significant contributors to this growth, requiring robust and reliable P-Channel MOSFETs for power conversion and control. Industrial automation and renewable energy sectors are also driving demand, with the adoption of smart manufacturing and grid-scale energy storage solutions significantly impacting market dynamics. The market is segmented by type (P-channel enhancement and depletion MOSFETs) and application (electronics, industrial, automotive, and power industries). Competition among established players like Infineon Technologies AG, STMicroelectronics, and ON Semiconductor is intense, fostering innovation and driving price competitiveness. While supply chain constraints and fluctuating raw material prices present challenges, technological advancements in silicon carbide (SiC) and gallium nitride (GaN) MOSFETs are creating new opportunities for enhanced efficiency and performance, further shaping future market expansion.
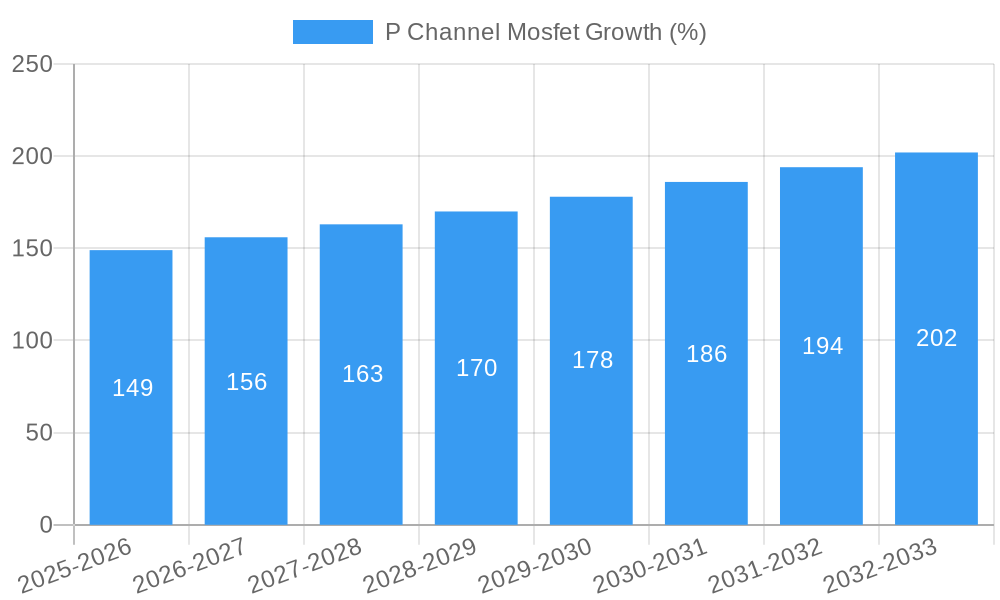
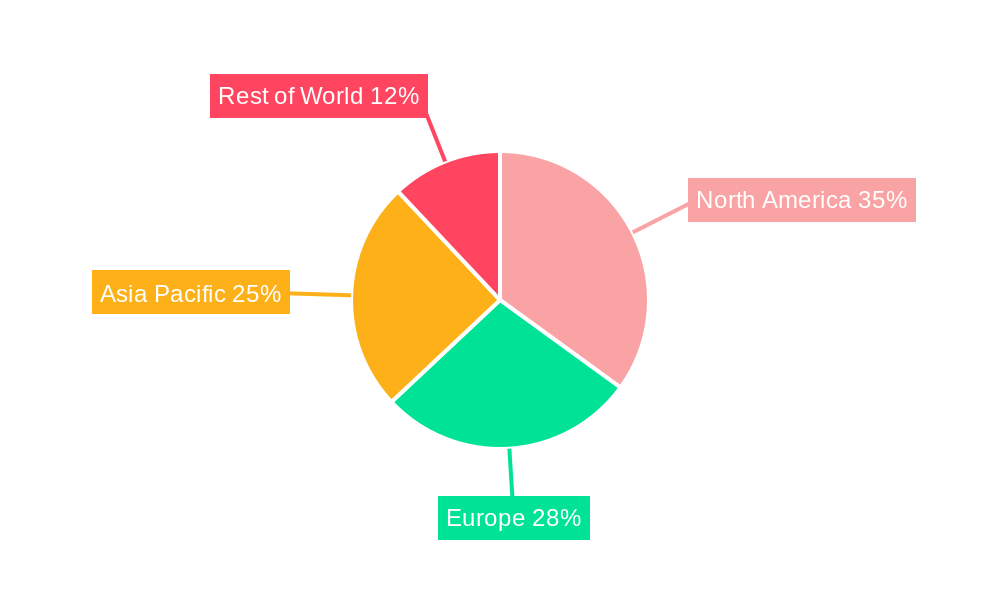
The forecast period of 2025-2033 suggests continued market expansion, with growth likely to be influenced by factors such as global economic conditions, technological breakthroughs, and government regulations promoting energy efficiency. Regional variations in market share will reflect varying adoption rates across different industries and the maturity of technological infrastructure in each region. North America and Asia-Pacific are expected to remain significant markets, driven by strong technological innovation and manufacturing capacity in these regions. The continuous development of more power-efficient and smaller-sized MOSFETs, alongside the integration of advanced features such as integrated gate drivers, will further contribute to the market’s growth trajectory. The evolution of applications, like 5G infrastructure and advanced driver-assistance systems (ADAS) in automobiles, promises exciting prospects for the future of this critical semiconductor segment.
P Channel MOSFET Market Report: 2019-2033 - A Comprehensive Analysis
This in-depth report provides a comprehensive analysis of the P Channel MOSFET market, projecting a robust growth trajectory from 2019 to 2033. Driven by the increasing demand across diverse sectors like electronics, automotive, and industrial automation, the market is poised for significant expansion, exceeding xx million units by 2033. This report offers actionable insights for industry professionals, investors, and strategists seeking to navigate this dynamic landscape. The study period covers 2019-2033, with 2025 as the base and estimated year. The forecast period is 2025-2033, and the historical period is 2019-2024. Key players like Infineon Technologies AG, STMicroelectronics, and others are analyzed for their market share and strategic initiatives.
P Channel Mosfet Market Structure & Innovation Trends
The P Channel MOSFET market exhibits a moderately concentrated structure, with key players like Infineon Technologies AG, STMicroelectronics, NXP Semiconductors, and ON Semiconductor holding significant market share. The market share of these top five companies in 2024 was approximately xx%. Innovation is driven by the need for higher efficiency, smaller form factors, and enhanced power handling capabilities. Regulatory frameworks, particularly those related to energy efficiency and environmental compliance, significantly influence product development. Product substitutes, such as IGBTs and other power switching devices, exert competitive pressure. End-user demographics are largely driven by the expansion of the electronics, automotive, and industrial sectors. M&A activity in the past five years has involved xx million USD in deals, primarily focused on consolidating market share and acquiring specialized technologies.
- Market Concentration: Top 5 players hold xx% market share (2024).
- Innovation Drivers: Higher efficiency, smaller form factors, enhanced power handling.
- M&A Activity (2019-2024): Total deal value approximately xx million USD.
P Channel Mosfet Market Dynamics & Trends
The P Channel MOSFET market is experiencing robust growth, fueled by a compound annual growth rate (CAGR) of xx% during the forecast period (2025-2033). This growth is primarily driven by the increasing adoption of MOSFETs in various applications, particularly in the electronics and automotive industries. Technological disruptions, such as the development of wide-bandgap semiconductors, are reshaping the competitive landscape. Consumer preferences are shifting towards more energy-efficient and compact devices, further driving demand for advanced P Channel MOSFETs. Competitive dynamics are intense, with key players focusing on product differentiation, cost optimization, and strategic partnerships to maintain market share. Market penetration in the automotive sector is expected to reach xx% by 2033.
Dominant Regions & Segments in P Channel Mosfet
The Asia-Pacific region dominates the P Channel MOSFET market, driven by robust growth in the electronics and automotive industries within countries like China, Japan, and South Korea. Strong economic growth and significant investments in infrastructure are key factors contributing to this dominance. Within application segments, the electronics industry holds the largest market share, followed by the automotive and industrial sectors. In terms of types, P-channel enhancement MOSFETs represent a larger market share compared to depletion MOSFETs due to their wider range of applications.
- Key Drivers in Asia-Pacific: Strong economic growth, robust electronics and automotive sectors, significant infrastructure investments.
- Dominant Application Segment: Electronics Industry (xx% market share in 2024)
- Dominant MOSFET Type: P-channel enhancement MOSFETs
P Channel Mosfet Product Innovations
Recent product developments focus on enhancing switching speed, reducing on-resistance, and improving thermal management. These advancements cater to the increasing demand for higher efficiency and reliability in power management applications. New P Channel MOSFETs are being designed for specific applications, such as automotive powertrains and high-frequency switching power supplies, offering competitive advantages through enhanced performance and cost-effectiveness. The trend is towards miniaturization and integration with other components.
Report Scope & Segmentation Analysis
This report segments the P Channel MOSFET market based on application (Electronics Industry, Industrial, Automobile Industry, Power Industry) and type (P-channel with the Enhancement MOSFET, P-channel with the Depletion MOSFET). Each segment's growth projections, market size, and competitive dynamics are analyzed in detail. The Electronics Industry segment is expected to experience the fastest growth, driven by the proliferation of consumer electronics and data centers. Similarly, the P-channel enhancement MOSFET segment is projected to maintain its dominance due to its versatility and cost-effectiveness.
Key Drivers of P Channel Mosfet Growth
The growth of the P Channel MOSFET market is driven by several factors: the increasing demand for energy-efficient electronics, the expansion of the automotive and industrial automation sectors, and advancements in semiconductor technology leading to improved device performance and lower costs. Government initiatives promoting energy efficiency and electric vehicles further stimulate market growth. The growing adoption of renewable energy sources also contributes to increased demand.
Challenges in the P Channel Mosfet Sector
The P Channel MOSFET sector faces challenges such as fluctuations in raw material prices, intense competition from alternative technologies, and the complexity of managing global supply chains. Regulatory compliance requirements can also increase production costs and complexity. Furthermore, achieving consistent quality and reliability across different manufacturing processes remains a significant hurdle.
Emerging Opportunities in P Channel Mosfet
Emerging opportunities exist in the development of wide-bandgap MOSFETs, which offer superior performance characteristics, and in applications within renewable energy systems. The increasing demand for electric vehicles and hybrid electric vehicles presents significant growth potential. Expanding into new markets, particularly in developing economies, also presents opportunities for market expansion.
Leading Players in the P Channel Mosfet Market
- Infineon Technologies AG
- STMicroelectronics
- Adafruit
- ON Semiconductor
- Nexperia
- Diodes Incorporated
- Texas Instruments
- IXYS Corporation
- Vishay Intertechnology, Inc.
- Central Semiconductor Corp
- TSMC
- ROHM Semiconductor
- Microsemi
- Cadence Design Systems, Inc
- NXP Semiconductors
Key Developments in P Channel Mosfet Industry
- 2022 Q4: Infineon Technologies AG announced a new generation of high-efficiency P Channel MOSFETs.
- 2023 Q1: STMicroelectronics launched a new automotive-grade P Channel MOSFET.
- 2023 Q3: ON Semiconductor acquired a smaller competitor specializing in high-voltage MOSFETs for xx million USD. (Note: Specific details on smaller competitor are not available)
Future Outlook for P Channel Mosfet Market
The P Channel MOSFET market is projected to experience continued growth driven by ongoing technological advancements and increasing demand across various end-use sectors. Strategic partnerships, investments in R&D, and expansion into new geographic markets will be key factors determining future market leadership. The market is poised for substantial expansion, with significant opportunities for growth in the coming years.
P Channel Mosfet Segmentation
-
1. Application
- 1.1. Electronics Industry
- 1.2. Industrial
- 1.3. Automobile Industry
- 1.4. Power Industry
-
2. Type
- 2.1. P-channel with the Enhancement MOSFET
- 2.2. P-channel with the Depletion MOSFET
P Channel Mosfet Segmentation By Geography
-
1. North America
- 1.1. United States
- 1.2. Canada
- 1.3. Mexico
-
2. South America
- 2.1. Brazil
- 2.2. Argentina
- 2.3. Rest of South America
-
3. Europe
- 3.1. United Kingdom
- 3.2. Germany
- 3.3. France
- 3.4. Italy
- 3.5. Spain
- 3.6. Russia
- 3.7. Benelux
- 3.8. Nordics
- 3.9. Rest of Europe
-
4. Middle East & Africa
- 4.1. Turkey
- 4.2. Israel
- 4.3. GCC
- 4.4. North Africa
- 4.5. South Africa
- 4.6. Rest of Middle East & Africa
-
5. Asia Pacific
- 5.1. China
- 5.2. India
- 5.3. Japan
- 5.4. South Korea
- 5.5. ASEAN
- 5.6. Oceania
- 5.7. Rest of Asia Pacific
P Channel Mosfet REPORT HIGHLIGHTS
| Aspects | Details |
|---|---|
| Study Period | 2019-2033 |
| Base Year | 2024 |
| Estimated Year | 2025 |
| Forecast Period | 2025-2033 |
| Historical Period | 2019-2024 |
| Growth Rate | CAGR of 4.5% from 2019-2033 |
| Segmentation |
|
Table of Contents
- 1. Introduction
- 1.1. Research Scope
- 1.2. Market Segmentation
- 1.3. Research Methodology
- 1.4. Definitions and Assumptions
- 2. Executive Summary
- 2.1. Introduction
- 3. Market Dynamics
- 3.1. Introduction
- 3.2. Market Drivers
- 3.3. Market Restrains
- 3.4. Market Trends
- 4. Market Factor Analysis
- 4.1. Porters Five Forces
- 4.2. Supply/Value Chain
- 4.3. PESTEL analysis
- 4.4. Market Entropy
- 4.5. Patent/Trademark Analysis
- 5. Global P Channel Mosfet Analysis, Insights and Forecast, 2019-2031
- 5.1. Market Analysis, Insights and Forecast - by Application
- 5.1.1. Electronics Industry
- 5.1.2. Industrial
- 5.1.3. Automobile Industry
- 5.1.4. Power Industry
- 5.2. Market Analysis, Insights and Forecast - by Type
- 5.2.1. P-channel with the Enhancement MOSFET
- 5.2.2. P-channel with the Depletion MOSFET
- 5.3. Market Analysis, Insights and Forecast - by Region
- 5.3.1. North America
- 5.3.2. South America
- 5.3.3. Europe
- 5.3.4. Middle East & Africa
- 5.3.5. Asia Pacific
- 5.1. Market Analysis, Insights and Forecast - by Application
- 6. North America P Channel Mosfet Analysis, Insights and Forecast, 2019-2031
- 6.1. Market Analysis, Insights and Forecast - by Application
- 6.1.1. Electronics Industry
- 6.1.2. Industrial
- 6.1.3. Automobile Industry
- 6.1.4. Power Industry
- 6.2. Market Analysis, Insights and Forecast - by Type
- 6.2.1. P-channel with the Enhancement MOSFET
- 6.2.2. P-channel with the Depletion MOSFET
- 6.1. Market Analysis, Insights and Forecast - by Application
- 7. South America P Channel Mosfet Analysis, Insights and Forecast, 2019-2031
- 7.1. Market Analysis, Insights and Forecast - by Application
- 7.1.1. Electronics Industry
- 7.1.2. Industrial
- 7.1.3. Automobile Industry
- 7.1.4. Power Industry
- 7.2. Market Analysis, Insights and Forecast - by Type
- 7.2.1. P-channel with the Enhancement MOSFET
- 7.2.2. P-channel with the Depletion MOSFET
- 7.1. Market Analysis, Insights and Forecast - by Application
- 8. Europe P Channel Mosfet Analysis, Insights and Forecast, 2019-2031
- 8.1. Market Analysis, Insights and Forecast - by Application
- 8.1.1. Electronics Industry
- 8.1.2. Industrial
- 8.1.3. Automobile Industry
- 8.1.4. Power Industry
- 8.2. Market Analysis, Insights and Forecast - by Type
- 8.2.1. P-channel with the Enhancement MOSFET
- 8.2.2. P-channel with the Depletion MOSFET
- 8.1. Market Analysis, Insights and Forecast - by Application
- 9. Middle East & Africa P Channel Mosfet Analysis, Insights and Forecast, 2019-2031
- 9.1. Market Analysis, Insights and Forecast - by Application
- 9.1.1. Electronics Industry
- 9.1.2. Industrial
- 9.1.3. Automobile Industry
- 9.1.4. Power Industry
- 9.2. Market Analysis, Insights and Forecast - by Type
- 9.2.1. P-channel with the Enhancement MOSFET
- 9.2.2. P-channel with the Depletion MOSFET
- 9.1. Market Analysis, Insights and Forecast - by Application
- 10. Asia Pacific P Channel Mosfet Analysis, Insights and Forecast, 2019-2031
- 10.1. Market Analysis, Insights and Forecast - by Application
- 10.1.1. Electronics Industry
- 10.1.2. Industrial
- 10.1.3. Automobile Industry
- 10.1.4. Power Industry
- 10.2. Market Analysis, Insights and Forecast - by Type
- 10.2.1. P-channel with the Enhancement MOSFET
- 10.2.2. P-channel with the Depletion MOSFET
- 10.1. Market Analysis, Insights and Forecast - by Application
- 11. Competitive Analysis
- 11.1. Global Market Share Analysis 2024
- 11.2. Company Profiles
- 11.2.1 Infineon Technologies AG
- 11.2.1.1. Overview
- 11.2.1.2. Products
- 11.2.1.3. SWOT Analysis
- 11.2.1.4. Recent Developments
- 11.2.1.5. Financials (Based on Availability)
- 11.2.2 STMicroelectronics
- 11.2.2.1. Overview
- 11.2.2.2. Products
- 11.2.2.3. SWOT Analysis
- 11.2.2.4. Recent Developments
- 11.2.2.5. Financials (Based on Availability)
- 11.2.3 Adafruit
- 11.2.3.1. Overview
- 11.2.3.2. Products
- 11.2.3.3. SWOT Analysis
- 11.2.3.4. Recent Developments
- 11.2.3.5. Financials (Based on Availability)
- 11.2.4 ON Semiconductor
- 11.2.4.1. Overview
- 11.2.4.2. Products
- 11.2.4.3. SWOT Analysis
- 11.2.4.4. Recent Developments
- 11.2.4.5. Financials (Based on Availability)
- 11.2.5 Nexperia
- 11.2.5.1. Overview
- 11.2.5.2. Products
- 11.2.5.3. SWOT Analysis
- 11.2.5.4. Recent Developments
- 11.2.5.5. Financials (Based on Availability)
- 11.2.6 Diodes Incorporated
- 11.2.6.1. Overview
- 11.2.6.2. Products
- 11.2.6.3. SWOT Analysis
- 11.2.6.4. Recent Developments
- 11.2.6.5. Financials (Based on Availability)
- 11.2.7 Texas Instruments
- 11.2.7.1. Overview
- 11.2.7.2. Products
- 11.2.7.3. SWOT Analysis
- 11.2.7.4. Recent Developments
- 11.2.7.5. Financials (Based on Availability)
- 11.2.8 IXYS Corporation
- 11.2.8.1. Overview
- 11.2.8.2. Products
- 11.2.8.3. SWOT Analysis
- 11.2.8.4. Recent Developments
- 11.2.8.5. Financials (Based on Availability)
- 11.2.9 Vishay Intertechnology Inc.
- 11.2.9.1. Overview
- 11.2.9.2. Products
- 11.2.9.3. SWOT Analysis
- 11.2.9.4. Recent Developments
- 11.2.9.5. Financials (Based on Availability)
- 11.2.10 Central Semiconductor Corp
- 11.2.10.1. Overview
- 11.2.10.2. Products
- 11.2.10.3. SWOT Analysis
- 11.2.10.4. Recent Developments
- 11.2.10.5. Financials (Based on Availability)
- 11.2.11 TSMC
- 11.2.11.1. Overview
- 11.2.11.2. Products
- 11.2.11.3. SWOT Analysis
- 11.2.11.4. Recent Developments
- 11.2.11.5. Financials (Based on Availability)
- 11.2.12 ROHM Semiconductor
- 11.2.12.1. Overview
- 11.2.12.2. Products
- 11.2.12.3. SWOT Analysis
- 11.2.12.4. Recent Developments
- 11.2.12.5. Financials (Based on Availability)
- 11.2.13 Microsemi
- 11.2.13.1. Overview
- 11.2.13.2. Products
- 11.2.13.3. SWOT Analysis
- 11.2.13.4. Recent Developments
- 11.2.13.5. Financials (Based on Availability)
- 11.2.14 Cadence Design Systems Inc
- 11.2.14.1. Overview
- 11.2.14.2. Products
- 11.2.14.3. SWOT Analysis
- 11.2.14.4. Recent Developments
- 11.2.14.5. Financials (Based on Availability)
- 11.2.15 NXP Semiconductors
- 11.2.15.1. Overview
- 11.2.15.2. Products
- 11.2.15.3. SWOT Analysis
- 11.2.15.4. Recent Developments
- 11.2.15.5. Financials (Based on Availability)
- 11.2.1 Infineon Technologies AG
List of Figures
- Figure 1: Global P Channel Mosfet Revenue Breakdown (million, %) by Region 2024 & 2032
- Figure 2: Global P Channel Mosfet Volume Breakdown (K, %) by Region 2024 & 2032
- Figure 3: North America P Channel Mosfet Revenue (million), by Application 2024 & 2032
- Figure 4: North America P Channel Mosfet Volume (K), by Application 2024 & 2032
- Figure 5: North America P Channel Mosfet Revenue Share (%), by Application 2024 & 2032
- Figure 6: North America P Channel Mosfet Volume Share (%), by Application 2024 & 2032
- Figure 7: North America P Channel Mosfet Revenue (million), by Type 2024 & 2032
- Figure 8: North America P Channel Mosfet Volume (K), by Type 2024 & 2032
- Figure 9: North America P Channel Mosfet Revenue Share (%), by Type 2024 & 2032
- Figure 10: North America P Channel Mosfet Volume Share (%), by Type 2024 & 2032
- Figure 11: North America P Channel Mosfet Revenue (million), by Country 2024 & 2032
- Figure 12: North America P Channel Mosfet Volume (K), by Country 2024 & 2032
- Figure 13: North America P Channel Mosfet Revenue Share (%), by Country 2024 & 2032
- Figure 14: North America P Channel Mosfet Volume Share (%), by Country 2024 & 2032
- Figure 15: South America P Channel Mosfet Revenue (million), by Application 2024 & 2032
- Figure 16: South America P Channel Mosfet Volume (K), by Application 2024 & 2032
- Figure 17: South America P Channel Mosfet Revenue Share (%), by Application 2024 & 2032
- Figure 18: South America P Channel Mosfet Volume Share (%), by Application 2024 & 2032
- Figure 19: South America P Channel Mosfet Revenue (million), by Type 2024 & 2032
- Figure 20: South America P Channel Mosfet Volume (K), by Type 2024 & 2032
- Figure 21: South America P Channel Mosfet Revenue Share (%), by Type 2024 & 2032
- Figure 22: South America P Channel Mosfet Volume Share (%), by Type 2024 & 2032
- Figure 23: South America P Channel Mosfet Revenue (million), by Country 2024 & 2032
- Figure 24: South America P Channel Mosfet Volume (K), by Country 2024 & 2032
- Figure 25: South America P Channel Mosfet Revenue Share (%), by Country 2024 & 2032
- Figure 26: South America P Channel Mosfet Volume Share (%), by Country 2024 & 2032
- Figure 27: Europe P Channel Mosfet Revenue (million), by Application 2024 & 2032
- Figure 28: Europe P Channel Mosfet Volume (K), by Application 2024 & 2032
- Figure 29: Europe P Channel Mosfet Revenue Share (%), by Application 2024 & 2032
- Figure 30: Europe P Channel Mosfet Volume Share (%), by Application 2024 & 2032
- Figure 31: Europe P Channel Mosfet Revenue (million), by Type 2024 & 2032
- Figure 32: Europe P Channel Mosfet Volume (K), by Type 2024 & 2032
- Figure 33: Europe P Channel Mosfet Revenue Share (%), by Type 2024 & 2032
- Figure 34: Europe P Channel Mosfet Volume Share (%), by Type 2024 & 2032
- Figure 35: Europe P Channel Mosfet Revenue (million), by Country 2024 & 2032
- Figure 36: Europe P Channel Mosfet Volume (K), by Country 2024 & 2032
- Figure 37: Europe P Channel Mosfet Revenue Share (%), by Country 2024 & 2032
- Figure 38: Europe P Channel Mosfet Volume Share (%), by Country 2024 & 2032
- Figure 39: Middle East & Africa P Channel Mosfet Revenue (million), by Application 2024 & 2032
- Figure 40: Middle East & Africa P Channel Mosfet Volume (K), by Application 2024 & 2032
- Figure 41: Middle East & Africa P Channel Mosfet Revenue Share (%), by Application 2024 & 2032
- Figure 42: Middle East & Africa P Channel Mosfet Volume Share (%), by Application 2024 & 2032
- Figure 43: Middle East & Africa P Channel Mosfet Revenue (million), by Type 2024 & 2032
- Figure 44: Middle East & Africa P Channel Mosfet Volume (K), by Type 2024 & 2032
- Figure 45: Middle East & Africa P Channel Mosfet Revenue Share (%), by Type 2024 & 2032
- Figure 46: Middle East & Africa P Channel Mosfet Volume Share (%), by Type 2024 & 2032
- Figure 47: Middle East & Africa P Channel Mosfet Revenue (million), by Country 2024 & 2032
- Figure 48: Middle East & Africa P Channel Mosfet Volume (K), by Country 2024 & 2032
- Figure 49: Middle East & Africa P Channel Mosfet Revenue Share (%), by Country 2024 & 2032
- Figure 50: Middle East & Africa P Channel Mosfet Volume Share (%), by Country 2024 & 2032
- Figure 51: Asia Pacific P Channel Mosfet Revenue (million), by Application 2024 & 2032
- Figure 52: Asia Pacific P Channel Mosfet Volume (K), by Application 2024 & 2032
- Figure 53: Asia Pacific P Channel Mosfet Revenue Share (%), by Application 2024 & 2032
- Figure 54: Asia Pacific P Channel Mosfet Volume Share (%), by Application 2024 & 2032
- Figure 55: Asia Pacific P Channel Mosfet Revenue (million), by Type 2024 & 2032
- Figure 56: Asia Pacific P Channel Mosfet Volume (K), by Type 2024 & 2032
- Figure 57: Asia Pacific P Channel Mosfet Revenue Share (%), by Type 2024 & 2032
- Figure 58: Asia Pacific P Channel Mosfet Volume Share (%), by Type 2024 & 2032
- Figure 59: Asia Pacific P Channel Mosfet Revenue (million), by Country 2024 & 2032
- Figure 60: Asia Pacific P Channel Mosfet Volume (K), by Country 2024 & 2032
- Figure 61: Asia Pacific P Channel Mosfet Revenue Share (%), by Country 2024 & 2032
- Figure 62: Asia Pacific P Channel Mosfet Volume Share (%), by Country 2024 & 2032
List of Tables
- Table 1: Global P Channel Mosfet Revenue million Forecast, by Region 2019 & 2032
- Table 2: Global P Channel Mosfet Volume K Forecast, by Region 2019 & 2032
- Table 3: Global P Channel Mosfet Revenue million Forecast, by Application 2019 & 2032
- Table 4: Global P Channel Mosfet Volume K Forecast, by Application 2019 & 2032
- Table 5: Global P Channel Mosfet Revenue million Forecast, by Type 2019 & 2032
- Table 6: Global P Channel Mosfet Volume K Forecast, by Type 2019 & 2032
- Table 7: Global P Channel Mosfet Revenue million Forecast, by Region 2019 & 2032
- Table 8: Global P Channel Mosfet Volume K Forecast, by Region 2019 & 2032
- Table 9: Global P Channel Mosfet Revenue million Forecast, by Application 2019 & 2032
- Table 10: Global P Channel Mosfet Volume K Forecast, by Application 2019 & 2032
- Table 11: Global P Channel Mosfet Revenue million Forecast, by Type 2019 & 2032
- Table 12: Global P Channel Mosfet Volume K Forecast, by Type 2019 & 2032
- Table 13: Global P Channel Mosfet Revenue million Forecast, by Country 2019 & 2032
- Table 14: Global P Channel Mosfet Volume K Forecast, by Country 2019 & 2032
- Table 15: United States P Channel Mosfet Revenue (million) Forecast, by Application 2019 & 2032
- Table 16: United States P Channel Mosfet Volume (K) Forecast, by Application 2019 & 2032
- Table 17: Canada P Channel Mosfet Revenue (million) Forecast, by Application 2019 & 2032
- Table 18: Canada P Channel Mosfet Volume (K) Forecast, by Application 2019 & 2032
- Table 19: Mexico P Channel Mosfet Revenue (million) Forecast, by Application 2019 & 2032
- Table 20: Mexico P Channel Mosfet Volume (K) Forecast, by Application 2019 & 2032
- Table 21: Global P Channel Mosfet Revenue million Forecast, by Application 2019 & 2032
- Table 22: Global P Channel Mosfet Volume K Forecast, by Application 2019 & 2032
- Table 23: Global P Channel Mosfet Revenue million Forecast, by Type 2019 & 2032
- Table 24: Global P Channel Mosfet Volume K Forecast, by Type 2019 & 2032
- Table 25: Global P Channel Mosfet Revenue million Forecast, by Country 2019 & 2032
- Table 26: Global P Channel Mosfet Volume K Forecast, by Country 2019 & 2032
- Table 27: Brazil P Channel Mosfet Revenue (million) Forecast, by Application 2019 & 2032
- Table 28: Brazil P Channel Mosfet Volume (K) Forecast, by Application 2019 & 2032
- Table 29: Argentina P Channel Mosfet Revenue (million) Forecast, by Application 2019 & 2032
- Table 30: Argentina P Channel Mosfet Volume (K) Forecast, by Application 2019 & 2032
- Table 31: Rest of South America P Channel Mosfet Revenue (million) Forecast, by Application 2019 & 2032
- Table 32: Rest of South America P Channel Mosfet Volume (K) Forecast, by Application 2019 & 2032
- Table 33: Global P Channel Mosfet Revenue million Forecast, by Application 2019 & 2032
- Table 34: Global P Channel Mosfet Volume K Forecast, by Application 2019 & 2032
- Table 35: Global P Channel Mosfet Revenue million Forecast, by Type 2019 & 2032
- Table 36: Global P Channel Mosfet Volume K Forecast, by Type 2019 & 2032
- Table 37: Global P Channel Mosfet Revenue million Forecast, by Country 2019 & 2032
- Table 38: Global P Channel Mosfet Volume K Forecast, by Country 2019 & 2032
- Table 39: United Kingdom P Channel Mosfet Revenue (million) Forecast, by Application 2019 & 2032
- Table 40: United Kingdom P Channel Mosfet Volume (K) Forecast, by Application 2019 & 2032
- Table 41: Germany P Channel Mosfet Revenue (million) Forecast, by Application 2019 & 2032
- Table 42: Germany P Channel Mosfet Volume (K) Forecast, by Application 2019 & 2032
- Table 43: France P Channel Mosfet Revenue (million) Forecast, by Application 2019 & 2032
- Table 44: France P Channel Mosfet Volume (K) Forecast, by Application 2019 & 2032
- Table 45: Italy P Channel Mosfet Revenue (million) Forecast, by Application 2019 & 2032
- Table 46: Italy P Channel Mosfet Volume (K) Forecast, by Application 2019 & 2032
- Table 47: Spain P Channel Mosfet Revenue (million) Forecast, by Application 2019 & 2032
- Table 48: Spain P Channel Mosfet Volume (K) Forecast, by Application 2019 & 2032
- Table 49: Russia P Channel Mosfet Revenue (million) Forecast, by Application 2019 & 2032
- Table 50: Russia P Channel Mosfet Volume (K) Forecast, by Application 2019 & 2032
- Table 51: Benelux P Channel Mosfet Revenue (million) Forecast, by Application 2019 & 2032
- Table 52: Benelux P Channel Mosfet Volume (K) Forecast, by Application 2019 & 2032
- Table 53: Nordics P Channel Mosfet Revenue (million) Forecast, by Application 2019 & 2032
- Table 54: Nordics P Channel Mosfet Volume (K) Forecast, by Application 2019 & 2032
- Table 55: Rest of Europe P Channel Mosfet Revenue (million) Forecast, by Application 2019 & 2032
- Table 56: Rest of Europe P Channel Mosfet Volume (K) Forecast, by Application 2019 & 2032
- Table 57: Global P Channel Mosfet Revenue million Forecast, by Application 2019 & 2032
- Table 58: Global P Channel Mosfet Volume K Forecast, by Application 2019 & 2032
- Table 59: Global P Channel Mosfet Revenue million Forecast, by Type 2019 & 2032
- Table 60: Global P Channel Mosfet Volume K Forecast, by Type 2019 & 2032
- Table 61: Global P Channel Mosfet Revenue million Forecast, by Country 2019 & 2032
- Table 62: Global P Channel Mosfet Volume K Forecast, by Country 2019 & 2032
- Table 63: Turkey P Channel Mosfet Revenue (million) Forecast, by Application 2019 & 2032
- Table 64: Turkey P Channel Mosfet Volume (K) Forecast, by Application 2019 & 2032
- Table 65: Israel P Channel Mosfet Revenue (million) Forecast, by Application 2019 & 2032
- Table 66: Israel P Channel Mosfet Volume (K) Forecast, by Application 2019 & 2032
- Table 67: GCC P Channel Mosfet Revenue (million) Forecast, by Application 2019 & 2032
- Table 68: GCC P Channel Mosfet Volume (K) Forecast, by Application 2019 & 2032
- Table 69: North Africa P Channel Mosfet Revenue (million) Forecast, by Application 2019 & 2032
- Table 70: North Africa P Channel Mosfet Volume (K) Forecast, by Application 2019 & 2032
- Table 71: South Africa P Channel Mosfet Revenue (million) Forecast, by Application 2019 & 2032
- Table 72: South Africa P Channel Mosfet Volume (K) Forecast, by Application 2019 & 2032
- Table 73: Rest of Middle East & Africa P Channel Mosfet Revenue (million) Forecast, by Application 2019 & 2032
- Table 74: Rest of Middle East & Africa P Channel Mosfet Volume (K) Forecast, by Application 2019 & 2032
- Table 75: Global P Channel Mosfet Revenue million Forecast, by Application 2019 & 2032
- Table 76: Global P Channel Mosfet Volume K Forecast, by Application 2019 & 2032
- Table 77: Global P Channel Mosfet Revenue million Forecast, by Type 2019 & 2032
- Table 78: Global P Channel Mosfet Volume K Forecast, by Type 2019 & 2032
- Table 79: Global P Channel Mosfet Revenue million Forecast, by Country 2019 & 2032
- Table 80: Global P Channel Mosfet Volume K Forecast, by Country 2019 & 2032
- Table 81: China P Channel Mosfet Revenue (million) Forecast, by Application 2019 & 2032
- Table 82: China P Channel Mosfet Volume (K) Forecast, by Application 2019 & 2032
- Table 83: India P Channel Mosfet Revenue (million) Forecast, by Application 2019 & 2032
- Table 84: India P Channel Mosfet Volume (K) Forecast, by Application 2019 & 2032
- Table 85: Japan P Channel Mosfet Revenue (million) Forecast, by Application 2019 & 2032
- Table 86: Japan P Channel Mosfet Volume (K) Forecast, by Application 2019 & 2032
- Table 87: South Korea P Channel Mosfet Revenue (million) Forecast, by Application 2019 & 2032
- Table 88: South Korea P Channel Mosfet Volume (K) Forecast, by Application 2019 & 2032
- Table 89: ASEAN P Channel Mosfet Revenue (million) Forecast, by Application 2019 & 2032
- Table 90: ASEAN P Channel Mosfet Volume (K) Forecast, by Application 2019 & 2032
- Table 91: Oceania P Channel Mosfet Revenue (million) Forecast, by Application 2019 & 2032
- Table 92: Oceania P Channel Mosfet Volume (K) Forecast, by Application 2019 & 2032
- Table 93: Rest of Asia Pacific P Channel Mosfet Revenue (million) Forecast, by Application 2019 & 2032
- Table 94: Rest of Asia Pacific P Channel Mosfet Volume (K) Forecast, by Application 2019 & 2032
Frequently Asked Questions
1. What is the projected Compound Annual Growth Rate (CAGR) of the P Channel Mosfet?
The projected CAGR is approximately 4.5%.
2. Which companies are prominent players in the P Channel Mosfet?
Key companies in the market include Infineon Technologies AG, STMicroelectronics, Adafruit, ON Semiconductor, Nexperia, Diodes Incorporated, Texas Instruments, IXYS Corporation, Vishay Intertechnology, Inc., Central Semiconductor Corp, TSMC, ROHM Semiconductor, Microsemi, Cadence Design Systems, Inc, NXP Semiconductors.
3. What are the main segments of the P Channel Mosfet?
The market segments include Application, Type.
4. Can you provide details about the market size?
The market size is estimated to be USD 3341 million as of 2022.
5. What are some drivers contributing to market growth?
N/A
6. What are the notable trends driving market growth?
N/A
7. Are there any restraints impacting market growth?
N/A
8. Can you provide examples of recent developments in the market?
N/A
9. What pricing options are available for accessing the report?
Pricing options include single-user, multi-user, and enterprise licenses priced at USD 3950.00, USD 5925.00, and USD 7900.00 respectively.
10. Is the market size provided in terms of value or volume?
The market size is provided in terms of value, measured in million and volume, measured in K.
11. Are there any specific market keywords associated with the report?
Yes, the market keyword associated with the report is "P Channel Mosfet," which aids in identifying and referencing the specific market segment covered.
12. How do I determine which pricing option suits my needs best?
The pricing options vary based on user requirements and access needs. Individual users may opt for single-user licenses, while businesses requiring broader access may choose multi-user or enterprise licenses for cost-effective access to the report.
13. Are there any additional resources or data provided in the P Channel Mosfet report?
While the report offers comprehensive insights, it's advisable to review the specific contents or supplementary materials provided to ascertain if additional resources or data are available.
14. How can I stay updated on further developments or reports in the P Channel Mosfet?
To stay informed about further developments, trends, and reports in the P Channel Mosfet, consider subscribing to industry newsletters, following relevant companies and organizations, or regularly checking reputable industry news sources and publications.
Methodology
Step 1 - Identification of Relevant Samples Size from Population Database


Step 2 - Approaches for Defining Global Market Size (Value, Volume* & Price*)

Note*: In applicable scenarios
Step 3 - Data Sources
Primary Research
- Web Analytics
- Survey Reports
- Research Institute
- Latest Research Reports
- Opinion Leaders
Secondary Research
- Annual Reports
- White Paper
- Latest Press Release
- Industry Association
- Paid Database
- Investor Presentations

Step 4 - Data Triangulation
Involves using different sources of information in order to increase the validity of a study
These sources are likely to be stakeholders in a program - participants, other researchers, program staff, other community members, and so on.
Then we put all data in single framework & apply various statistical tools to find out the dynamic on the market.
During the analysis stage, feedback from the stakeholder groups would be compared to determine areas of agreement as well as areas of divergence


