
Key Insights
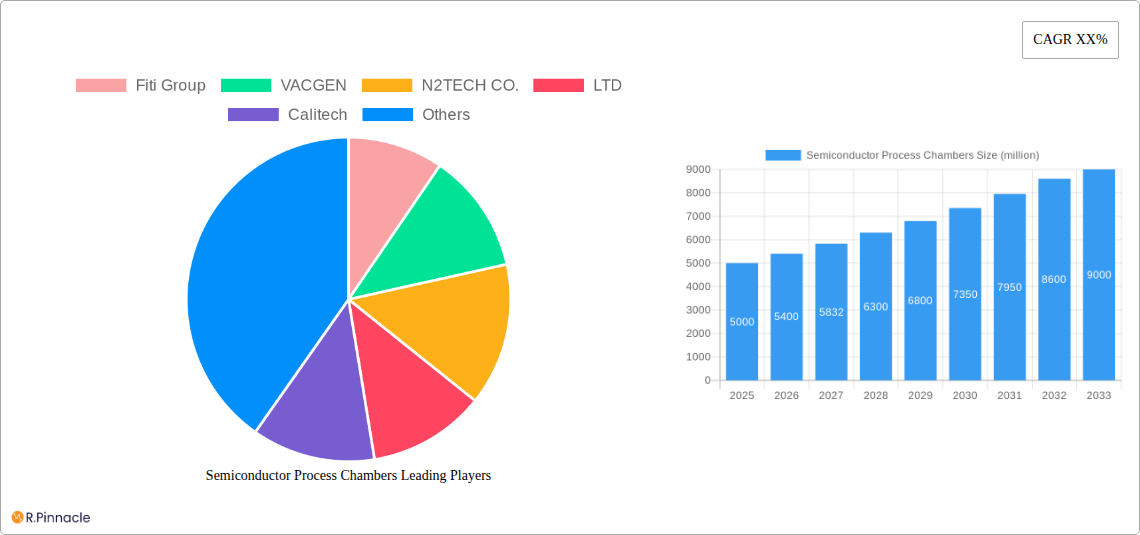
The semiconductor process chamber market is experiencing robust growth, driven by the increasing demand for advanced semiconductor devices in diverse applications like 5G infrastructure, artificial intelligence, and the Internet of Things (IoT). The market, estimated at $5 billion in 2025, is projected to exhibit a Compound Annual Growth Rate (CAGR) of 8% from 2025 to 2033, reaching approximately $9 billion by 2033. This growth is fueled by several key factors, including the miniaturization of semiconductor devices necessitating more sophisticated and precise process chambers, the rising adoption of advanced semiconductor manufacturing processes like EUV lithography, and the increasing investments in research and development within the semiconductor industry. Key players like Fiti Group, VACGEN, and N2TECH CO., LTD are actively participating in this expansion, continuously innovating and expanding their product portfolios to cater to the evolving needs of semiconductor manufacturers. The market is segmented by chamber type (e.g., CVD, etching, deposition), material processed, and geographic region. While challenges exist, such as supply chain disruptions and the fluctuating price of raw materials, the long-term outlook for the semiconductor process chamber market remains highly positive, supported by consistent technological advancements and sustained demand across various end-use sectors.
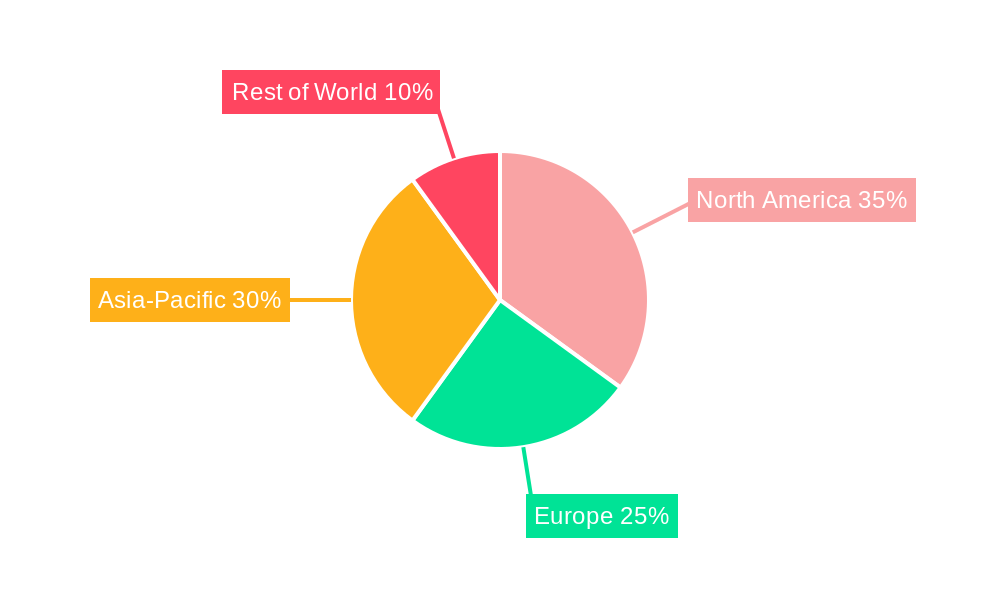
The market’s geographical distribution reflects the global concentration of semiconductor manufacturing hubs. Regions like North America and Asia-Pacific are anticipated to hold significant market share due to the presence of established semiconductor manufacturers and robust research infrastructure. However, other regions are witnessing growth as well, driven by investments in semiconductor manufacturing facilities and increasing domestic demand. Competition within the market is intense, with companies focusing on product differentiation through advanced features, improved performance, and superior customer support. The emergence of innovative chamber designs and materials, alongside advancements in automation and process control, will continue to shape the market landscape in the coming years. Companies are strategically investing in mergers and acquisitions and collaborations to gain a competitive edge and expand their market reach. A focus on sustainable manufacturing practices and energy efficiency is also expected to influence future market trends.
Semiconductor Process Chambers Market Report: 2019-2033
This comprehensive report provides an in-depth analysis of the global Semiconductor Process Chambers market, offering valuable insights for industry professionals, investors, and strategic decision-makers. The study period covers 2019-2033, with 2025 serving as the base and estimated year. The report forecasts market trends from 2025 to 2033, building upon historical data from 2019-2024. The market is valued at $XX million in 2025 and is projected to reach $XX million by 2033, exhibiting a CAGR of XX%.
Semiconductor Process Chambers Market Structure & Innovation Trends
This section analyzes the competitive landscape, innovation drivers, and regulatory influences shaping the Semiconductor Process Chambers market. The market exhibits a moderately concentrated structure, with key players such as Fiti Group, VACGEN, and N2TECH CO.,LTD holding significant market share. The estimated combined market share of the top five players in 2025 is XX%. Innovation is driven by the increasing demand for advanced semiconductor fabrication techniques, leading to continuous improvements in chamber design, materials, and automation. Regulatory frameworks, particularly those concerning environmental compliance and safety standards, significantly influence market dynamics. The market witnesses frequent M&A activity, with deal values exceeding $XX million in the past five years, reflecting the consolidation trend within the industry. Product substitutes, such as alternative deposition and etching techniques, pose a competitive threat. End-user demographics are primarily driven by the growth of the semiconductor industry across various sectors like consumer electronics, automotive, and data centers.
Semiconductor Process Chambers Market Dynamics & Trends
The Semiconductor Process Chambers market is experiencing robust growth, fueled by several key factors. The increasing demand for high-performance semiconductors in various electronic devices is a primary driver. Technological advancements, including the adoption of advanced materials and automation, are enhancing chamber efficiency and productivity. Consumer preferences for smaller, faster, and more energy-efficient devices drive the need for advanced semiconductor manufacturing processes. Competitive dynamics are characterized by intense rivalry among established players and the emergence of new entrants offering innovative solutions. This leads to continuous improvements in product features, performance, and pricing. The market exhibits a strong growth trajectory, with a projected CAGR of XX% during the forecast period (2025-2033). Market penetration in key regions is expected to reach XX% by 2033.
Dominant Regions & Segments in Semiconductor Process Chambers
The Asia-Pacific region dominates the global Semiconductor Process Chambers market, driven by the substantial presence of semiconductor manufacturing hubs in countries like China, South Korea, Taiwan, and Japan. This dominance is primarily attributed to robust economic growth, significant investments in semiconductor infrastructure, and supportive government policies promoting technological advancements.
- Key Drivers for Asia-Pacific Dominance:
- Large-scale semiconductor manufacturing facilities.
- High investments in R&D and technological advancements.
- Supportive government policies and incentives.
- Growing domestic demand for electronic devices.
The market is further segmented by chamber type (e.g., CVD, PVD, etch), process (e.g., deposition, etching), and end-user industry (e.g., logic, memory, analog). The CVD segment currently holds the largest market share, reflecting the wide application of CVD chambers in various semiconductor fabrication processes. However, the PVD and etch segments are witnessing significant growth, driven by the demand for advanced semiconductor technologies.
Semiconductor Process Chambers Product Innovations
Recent product innovations in Semiconductor Process Chambers focus on enhancing process control, improving yield, and reducing costs. This includes advancements in automation, real-time monitoring systems, and the use of advanced materials. These innovations improve chamber performance, leading to higher throughput and reduced defects, which enhances the competitive advantage for manufacturers. The integration of Artificial Intelligence (AI) and machine learning is also emerging, allowing for predictive maintenance and optimization of chamber operations.
Report Scope & Segmentation Analysis
This report segments the Semiconductor Process Chambers market by region (North America, Europe, Asia-Pacific, Rest of the World), chamber type, process, and end-user industry. Each segment's growth projections, market size (in millions of dollars), and competitive dynamics are analyzed in detail. Market size projections are provided for each segment throughout the forecast period (2025-2033).
Key Drivers of Semiconductor Process Chambers Growth
The growth of the Semiconductor Process Chambers market is driven by several factors, including the increasing demand for advanced semiconductor devices, continuous technological advancements in chamber design and materials, and supportive government policies promoting the growth of the semiconductor industry. The rising adoption of automation and AI in semiconductor manufacturing is another key driver, leading to improvements in efficiency and yield.
Challenges in the Semiconductor Process Chambers Sector
The Semiconductor Process Chambers sector faces several challenges, including stringent regulatory requirements for environmental compliance, disruptions in the global supply chain impacting the availability of critical components, and fierce competition from both established players and new entrants. These factors can lead to increased manufacturing costs and potential delays in product launches.
Emerging Opportunities in Semiconductor Process Chambers
Emerging opportunities include the growing demand for specialized chambers for advanced semiconductor nodes, the adoption of new materials and processes (e.g., EUV lithography), and the expansion of the semiconductor industry into new applications, such as automotive electronics and the Internet of Things (IoT).
Leading Players in the Semiconductor Process Chambers Market
- Fiti Group
- VACGEN
- N2TECH CO.,LTD
- Calitech
- Marumae Co.,Ltd
- Duratek Technology Co.,Ltd.
- BoBoo
- InSource
- GNB-KL Group
- Kaiser Aluminum (Imperial Machine & Tool)
- LACO Technologies
- Sprint Precision Technologies Co.,Ltd
- KFMI
- Shenyang Fortune Precision Equipment Co.,Ltd
- Tolerance Technology (Shanghai)
- Sanyue Semiconductor Technology
Key Developments in Semiconductor Process Chambers Industry
- 2022 Q4: Introduction of a new high-throughput CVD chamber by Fiti Group.
- 2023 Q1: Partnership between VACGEN and a major semiconductor manufacturer for joint R&D.
- 2023 Q3: Acquisition of a smaller competitor by N2TECH CO.,LTD. (Acquisition value: $XX million)
Future Outlook for Semiconductor Process Chambers Market
The Semiconductor Process Chambers market is poised for continued growth, driven by ongoing technological advancements, rising demand for advanced semiconductor devices, and expanding applications across various industries. Strategic partnerships, investments in R&D, and the development of innovative solutions will play a crucial role in shaping the future of this market.
Semiconductor Process Chambers Segmentation
-
1. Application
- 1.1. Thin Film (CVD, PVD and ALD)
- 1.2. Etching
- 1.3. E-beam and Lithography
- 1.4. Implant
- 1.5. Others
-
2. Types
- 2.1. Reaction Chamber
- 2.2. Transfer Chamber
- 2.3. Load Lock Chamber
Semiconductor Process Chambers Segmentation By Geography
-
1. North America
- 1.1. United States
- 1.2. Canada
- 1.3. Mexico
-
2. South America
- 2.1. Brazil
- 2.2. Argentina
- 2.3. Rest of South America
-
3. Europe
- 3.1. United Kingdom
- 3.2. Germany
- 3.3. France
- 3.4. Italy
- 3.5. Spain
- 3.6. Russia
- 3.7. Benelux
- 3.8. Nordics
- 3.9. Rest of Europe
-
4. Middle East & Africa
- 4.1. Turkey
- 4.2. Israel
- 4.3. GCC
- 4.4. North Africa
- 4.5. South Africa
- 4.6. Rest of Middle East & Africa
-
5. Asia Pacific
- 5.1. China
- 5.2. India
- 5.3. Japan
- 5.4. South Korea
- 5.5. ASEAN
- 5.6. Oceania
- 5.7. Rest of Asia Pacific
Semiconductor Process Chambers REPORT HIGHLIGHTS
| Aspects | Details |
|---|---|
| Study Period | 2019-2033 |
| Base Year | 2024 |
| Estimated Year | 2025 |
| Forecast Period | 2025-2033 |
| Historical Period | 2019-2024 |
| Growth Rate | CAGR of XX% from 2019-2033 |
| Segmentation |
|
Table of Contents
- 1. Introduction
- 1.1. Research Scope
- 1.2. Market Segmentation
- 1.3. Research Methodology
- 1.4. Definitions and Assumptions
- 2. Executive Summary
- 2.1. Introduction
- 3. Market Dynamics
- 3.1. Introduction
- 3.2. Market Drivers
- 3.3. Market Restrains
- 3.4. Market Trends
- 4. Market Factor Analysis
- 4.1. Porters Five Forces
- 4.2. Supply/Value Chain
- 4.3. PESTEL analysis
- 4.4. Market Entropy
- 4.5. Patent/Trademark Analysis
- 5. Global Semiconductor Process Chambers Analysis, Insights and Forecast, 2019-2031
- 5.1. Market Analysis, Insights and Forecast - by Application
- 5.1.1. Thin Film (CVD, PVD and ALD)
- 5.1.2. Etching
- 5.1.3. E-beam and Lithography
- 5.1.4. Implant
- 5.1.5. Others
- 5.2. Market Analysis, Insights and Forecast - by Types
- 5.2.1. Reaction Chamber
- 5.2.2. Transfer Chamber
- 5.2.3. Load Lock Chamber
- 5.3. Market Analysis, Insights and Forecast - by Region
- 5.3.1. North America
- 5.3.2. South America
- 5.3.3. Europe
- 5.3.4. Middle East & Africa
- 5.3.5. Asia Pacific
- 5.1. Market Analysis, Insights and Forecast - by Application
- 6. North America Semiconductor Process Chambers Analysis, Insights and Forecast, 2019-2031
- 6.1. Market Analysis, Insights and Forecast - by Application
- 6.1.1. Thin Film (CVD, PVD and ALD)
- 6.1.2. Etching
- 6.1.3. E-beam and Lithography
- 6.1.4. Implant
- 6.1.5. Others
- 6.2. Market Analysis, Insights and Forecast - by Types
- 6.2.1. Reaction Chamber
- 6.2.2. Transfer Chamber
- 6.2.3. Load Lock Chamber
- 6.1. Market Analysis, Insights and Forecast - by Application
- 7. South America Semiconductor Process Chambers Analysis, Insights and Forecast, 2019-2031
- 7.1. Market Analysis, Insights and Forecast - by Application
- 7.1.1. Thin Film (CVD, PVD and ALD)
- 7.1.2. Etching
- 7.1.3. E-beam and Lithography
- 7.1.4. Implant
- 7.1.5. Others
- 7.2. Market Analysis, Insights and Forecast - by Types
- 7.2.1. Reaction Chamber
- 7.2.2. Transfer Chamber
- 7.2.3. Load Lock Chamber
- 7.1. Market Analysis, Insights and Forecast - by Application
- 8. Europe Semiconductor Process Chambers Analysis, Insights and Forecast, 2019-2031
- 8.1. Market Analysis, Insights and Forecast - by Application
- 8.1.1. Thin Film (CVD, PVD and ALD)
- 8.1.2. Etching
- 8.1.3. E-beam and Lithography
- 8.1.4. Implant
- 8.1.5. Others
- 8.2. Market Analysis, Insights and Forecast - by Types
- 8.2.1. Reaction Chamber
- 8.2.2. Transfer Chamber
- 8.2.3. Load Lock Chamber
- 8.1. Market Analysis, Insights and Forecast - by Application
- 9. Middle East & Africa Semiconductor Process Chambers Analysis, Insights and Forecast, 2019-2031
- 9.1. Market Analysis, Insights and Forecast - by Application
- 9.1.1. Thin Film (CVD, PVD and ALD)
- 9.1.2. Etching
- 9.1.3. E-beam and Lithography
- 9.1.4. Implant
- 9.1.5. Others
- 9.2. Market Analysis, Insights and Forecast - by Types
- 9.2.1. Reaction Chamber
- 9.2.2. Transfer Chamber
- 9.2.3. Load Lock Chamber
- 9.1. Market Analysis, Insights and Forecast - by Application
- 10. Asia Pacific Semiconductor Process Chambers Analysis, Insights and Forecast, 2019-2031
- 10.1. Market Analysis, Insights and Forecast - by Application
- 10.1.1. Thin Film (CVD, PVD and ALD)
- 10.1.2. Etching
- 10.1.3. E-beam and Lithography
- 10.1.4. Implant
- 10.1.5. Others
- 10.2. Market Analysis, Insights and Forecast - by Types
- 10.2.1. Reaction Chamber
- 10.2.2. Transfer Chamber
- 10.2.3. Load Lock Chamber
- 10.1. Market Analysis, Insights and Forecast - by Application
- 11. Competitive Analysis
- 11.1. Global Market Share Analysis 2024
- 11.2. Company Profiles
- 11.2.1 Fiti Group
- 11.2.1.1. Overview
- 11.2.1.2. Products
- 11.2.1.3. SWOT Analysis
- 11.2.1.4. Recent Developments
- 11.2.1.5. Financials (Based on Availability)
- 11.2.2 VACGEN
- 11.2.2.1. Overview
- 11.2.2.2. Products
- 11.2.2.3. SWOT Analysis
- 11.2.2.4. Recent Developments
- 11.2.2.5. Financials (Based on Availability)
- 11.2.3 N2TECH CO.
- 11.2.3.1. Overview
- 11.2.3.2. Products
- 11.2.3.3. SWOT Analysis
- 11.2.3.4. Recent Developments
- 11.2.3.5. Financials (Based on Availability)
- 11.2.4 LTD
- 11.2.4.1. Overview
- 11.2.4.2. Products
- 11.2.4.3. SWOT Analysis
- 11.2.4.4. Recent Developments
- 11.2.4.5. Financials (Based on Availability)
- 11.2.5 Calitech
- 11.2.5.1. Overview
- 11.2.5.2. Products
- 11.2.5.3. SWOT Analysis
- 11.2.5.4. Recent Developments
- 11.2.5.5. Financials (Based on Availability)
- 11.2.6 Marumae Co.
- 11.2.6.1. Overview
- 11.2.6.2. Products
- 11.2.6.3. SWOT Analysis
- 11.2.6.4. Recent Developments
- 11.2.6.5. Financials (Based on Availability)
- 11.2.7 Ltd
- 11.2.7.1. Overview
- 11.2.7.2. Products
- 11.2.7.3. SWOT Analysis
- 11.2.7.4. Recent Developments
- 11.2.7.5. Financials (Based on Availability)
- 11.2.8 Duratek Technology Co.
- 11.2.8.1. Overview
- 11.2.8.2. Products
- 11.2.8.3. SWOT Analysis
- 11.2.8.4. Recent Developments
- 11.2.8.5. Financials (Based on Availability)
- 11.2.9 Ltd.
- 11.2.9.1. Overview
- 11.2.9.2. Products
- 11.2.9.3. SWOT Analysis
- 11.2.9.4. Recent Developments
- 11.2.9.5. Financials (Based on Availability)
- 11.2.10 BoBoo
- 11.2.10.1. Overview
- 11.2.10.2. Products
- 11.2.10.3. SWOT Analysis
- 11.2.10.4. Recent Developments
- 11.2.10.5. Financials (Based on Availability)
- 11.2.11 InSource
- 11.2.11.1. Overview
- 11.2.11.2. Products
- 11.2.11.3. SWOT Analysis
- 11.2.11.4. Recent Developments
- 11.2.11.5. Financials (Based on Availability)
- 11.2.12 GNB-KL Group
- 11.2.12.1. Overview
- 11.2.12.2. Products
- 11.2.12.3. SWOT Analysis
- 11.2.12.4. Recent Developments
- 11.2.12.5. Financials (Based on Availability)
- 11.2.13 Kaiser Aluminum (Imperial Machine & Tool)
- 11.2.13.1. Overview
- 11.2.13.2. Products
- 11.2.13.3. SWOT Analysis
- 11.2.13.4. Recent Developments
- 11.2.13.5. Financials (Based on Availability)
- 11.2.14 LACO Technologies
- 11.2.14.1. Overview
- 11.2.14.2. Products
- 11.2.14.3. SWOT Analysis
- 11.2.14.4. Recent Developments
- 11.2.14.5. Financials (Based on Availability)
- 11.2.15 Sprint Precision Technologies Co.
- 11.2.15.1. Overview
- 11.2.15.2. Products
- 11.2.15.3. SWOT Analysis
- 11.2.15.4. Recent Developments
- 11.2.15.5. Financials (Based on Availability)
- 11.2.16 Ltd
- 11.2.16.1. Overview
- 11.2.16.2. Products
- 11.2.16.3. SWOT Analysis
- 11.2.16.4. Recent Developments
- 11.2.16.5. Financials (Based on Availability)
- 11.2.17 KFMI
- 11.2.17.1. Overview
- 11.2.17.2. Products
- 11.2.17.3. SWOT Analysis
- 11.2.17.4. Recent Developments
- 11.2.17.5. Financials (Based on Availability)
- 11.2.18 Shenyang Fortune Precision Equipment Co.
- 11.2.18.1. Overview
- 11.2.18.2. Products
- 11.2.18.3. SWOT Analysis
- 11.2.18.4. Recent Developments
- 11.2.18.5. Financials (Based on Availability)
- 11.2.19 Ltd
- 11.2.19.1. Overview
- 11.2.19.2. Products
- 11.2.19.3. SWOT Analysis
- 11.2.19.4. Recent Developments
- 11.2.19.5. Financials (Based on Availability)
- 11.2.20 Tolerance Technology (Shanghai)
- 11.2.20.1. Overview
- 11.2.20.2. Products
- 11.2.20.3. SWOT Analysis
- 11.2.20.4. Recent Developments
- 11.2.20.5. Financials (Based on Availability)
- 11.2.21 Sanyue Semiconductor Technology
- 11.2.21.1. Overview
- 11.2.21.2. Products
- 11.2.21.3. SWOT Analysis
- 11.2.21.4. Recent Developments
- 11.2.21.5. Financials (Based on Availability)
- 11.2.1 Fiti Group
List of Figures
- Figure 1: Global Semiconductor Process Chambers Revenue Breakdown (million, %) by Region 2024 & 2032
- Figure 2: Global Semiconductor Process Chambers Volume Breakdown (K, %) by Region 2024 & 2032
- Figure 3: North America Semiconductor Process Chambers Revenue (million), by Application 2024 & 2032
- Figure 4: North America Semiconductor Process Chambers Volume (K), by Application 2024 & 2032
- Figure 5: North America Semiconductor Process Chambers Revenue Share (%), by Application 2024 & 2032
- Figure 6: North America Semiconductor Process Chambers Volume Share (%), by Application 2024 & 2032
- Figure 7: North America Semiconductor Process Chambers Revenue (million), by Types 2024 & 2032
- Figure 8: North America Semiconductor Process Chambers Volume (K), by Types 2024 & 2032
- Figure 9: North America Semiconductor Process Chambers Revenue Share (%), by Types 2024 & 2032
- Figure 10: North America Semiconductor Process Chambers Volume Share (%), by Types 2024 & 2032
- Figure 11: North America Semiconductor Process Chambers Revenue (million), by Country 2024 & 2032
- Figure 12: North America Semiconductor Process Chambers Volume (K), by Country 2024 & 2032
- Figure 13: North America Semiconductor Process Chambers Revenue Share (%), by Country 2024 & 2032
- Figure 14: North America Semiconductor Process Chambers Volume Share (%), by Country 2024 & 2032
- Figure 15: South America Semiconductor Process Chambers Revenue (million), by Application 2024 & 2032
- Figure 16: South America Semiconductor Process Chambers Volume (K), by Application 2024 & 2032
- Figure 17: South America Semiconductor Process Chambers Revenue Share (%), by Application 2024 & 2032
- Figure 18: South America Semiconductor Process Chambers Volume Share (%), by Application 2024 & 2032
- Figure 19: South America Semiconductor Process Chambers Revenue (million), by Types 2024 & 2032
- Figure 20: South America Semiconductor Process Chambers Volume (K), by Types 2024 & 2032
- Figure 21: South America Semiconductor Process Chambers Revenue Share (%), by Types 2024 & 2032
- Figure 22: South America Semiconductor Process Chambers Volume Share (%), by Types 2024 & 2032
- Figure 23: South America Semiconductor Process Chambers Revenue (million), by Country 2024 & 2032
- Figure 24: South America Semiconductor Process Chambers Volume (K), by Country 2024 & 2032
- Figure 25: South America Semiconductor Process Chambers Revenue Share (%), by Country 2024 & 2032
- Figure 26: South America Semiconductor Process Chambers Volume Share (%), by Country 2024 & 2032
- Figure 27: Europe Semiconductor Process Chambers Revenue (million), by Application 2024 & 2032
- Figure 28: Europe Semiconductor Process Chambers Volume (K), by Application 2024 & 2032
- Figure 29: Europe Semiconductor Process Chambers Revenue Share (%), by Application 2024 & 2032
- Figure 30: Europe Semiconductor Process Chambers Volume Share (%), by Application 2024 & 2032
- Figure 31: Europe Semiconductor Process Chambers Revenue (million), by Types 2024 & 2032
- Figure 32: Europe Semiconductor Process Chambers Volume (K), by Types 2024 & 2032
- Figure 33: Europe Semiconductor Process Chambers Revenue Share (%), by Types 2024 & 2032
- Figure 34: Europe Semiconductor Process Chambers Volume Share (%), by Types 2024 & 2032
- Figure 35: Europe Semiconductor Process Chambers Revenue (million), by Country 2024 & 2032
- Figure 36: Europe Semiconductor Process Chambers Volume (K), by Country 2024 & 2032
- Figure 37: Europe Semiconductor Process Chambers Revenue Share (%), by Country 2024 & 2032
- Figure 38: Europe Semiconductor Process Chambers Volume Share (%), by Country 2024 & 2032
- Figure 39: Middle East & Africa Semiconductor Process Chambers Revenue (million), by Application 2024 & 2032
- Figure 40: Middle East & Africa Semiconductor Process Chambers Volume (K), by Application 2024 & 2032
- Figure 41: Middle East & Africa Semiconductor Process Chambers Revenue Share (%), by Application 2024 & 2032
- Figure 42: Middle East & Africa Semiconductor Process Chambers Volume Share (%), by Application 2024 & 2032
- Figure 43: Middle East & Africa Semiconductor Process Chambers Revenue (million), by Types 2024 & 2032
- Figure 44: Middle East & Africa Semiconductor Process Chambers Volume (K), by Types 2024 & 2032
- Figure 45: Middle East & Africa Semiconductor Process Chambers Revenue Share (%), by Types 2024 & 2032
- Figure 46: Middle East & Africa Semiconductor Process Chambers Volume Share (%), by Types 2024 & 2032
- Figure 47: Middle East & Africa Semiconductor Process Chambers Revenue (million), by Country 2024 & 2032
- Figure 48: Middle East & Africa Semiconductor Process Chambers Volume (K), by Country 2024 & 2032
- Figure 49: Middle East & Africa Semiconductor Process Chambers Revenue Share (%), by Country 2024 & 2032
- Figure 50: Middle East & Africa Semiconductor Process Chambers Volume Share (%), by Country 2024 & 2032
- Figure 51: Asia Pacific Semiconductor Process Chambers Revenue (million), by Application 2024 & 2032
- Figure 52: Asia Pacific Semiconductor Process Chambers Volume (K), by Application 2024 & 2032
- Figure 53: Asia Pacific Semiconductor Process Chambers Revenue Share (%), by Application 2024 & 2032
- Figure 54: Asia Pacific Semiconductor Process Chambers Volume Share (%), by Application 2024 & 2032
- Figure 55: Asia Pacific Semiconductor Process Chambers Revenue (million), by Types 2024 & 2032
- Figure 56: Asia Pacific Semiconductor Process Chambers Volume (K), by Types 2024 & 2032
- Figure 57: Asia Pacific Semiconductor Process Chambers Revenue Share (%), by Types 2024 & 2032
- Figure 58: Asia Pacific Semiconductor Process Chambers Volume Share (%), by Types 2024 & 2032
- Figure 59: Asia Pacific Semiconductor Process Chambers Revenue (million), by Country 2024 & 2032
- Figure 60: Asia Pacific Semiconductor Process Chambers Volume (K), by Country 2024 & 2032
- Figure 61: Asia Pacific Semiconductor Process Chambers Revenue Share (%), by Country 2024 & 2032
- Figure 62: Asia Pacific Semiconductor Process Chambers Volume Share (%), by Country 2024 & 2032
List of Tables
- Table 1: Global Semiconductor Process Chambers Revenue million Forecast, by Region 2019 & 2032
- Table 2: Global Semiconductor Process Chambers Volume K Forecast, by Region 2019 & 2032
- Table 3: Global Semiconductor Process Chambers Revenue million Forecast, by Application 2019 & 2032
- Table 4: Global Semiconductor Process Chambers Volume K Forecast, by Application 2019 & 2032
- Table 5: Global Semiconductor Process Chambers Revenue million Forecast, by Types 2019 & 2032
- Table 6: Global Semiconductor Process Chambers Volume K Forecast, by Types 2019 & 2032
- Table 7: Global Semiconductor Process Chambers Revenue million Forecast, by Region 2019 & 2032
- Table 8: Global Semiconductor Process Chambers Volume K Forecast, by Region 2019 & 2032
- Table 9: Global Semiconductor Process Chambers Revenue million Forecast, by Application 2019 & 2032
- Table 10: Global Semiconductor Process Chambers Volume K Forecast, by Application 2019 & 2032
- Table 11: Global Semiconductor Process Chambers Revenue million Forecast, by Types 2019 & 2032
- Table 12: Global Semiconductor Process Chambers Volume K Forecast, by Types 2019 & 2032
- Table 13: Global Semiconductor Process Chambers Revenue million Forecast, by Country 2019 & 2032
- Table 14: Global Semiconductor Process Chambers Volume K Forecast, by Country 2019 & 2032
- Table 15: United States Semiconductor Process Chambers Revenue (million) Forecast, by Application 2019 & 2032
- Table 16: United States Semiconductor Process Chambers Volume (K) Forecast, by Application 2019 & 2032
- Table 17: Canada Semiconductor Process Chambers Revenue (million) Forecast, by Application 2019 & 2032
- Table 18: Canada Semiconductor Process Chambers Volume (K) Forecast, by Application 2019 & 2032
- Table 19: Mexico Semiconductor Process Chambers Revenue (million) Forecast, by Application 2019 & 2032
- Table 20: Mexico Semiconductor Process Chambers Volume (K) Forecast, by Application 2019 & 2032
- Table 21: Global Semiconductor Process Chambers Revenue million Forecast, by Application 2019 & 2032
- Table 22: Global Semiconductor Process Chambers Volume K Forecast, by Application 2019 & 2032
- Table 23: Global Semiconductor Process Chambers Revenue million Forecast, by Types 2019 & 2032
- Table 24: Global Semiconductor Process Chambers Volume K Forecast, by Types 2019 & 2032
- Table 25: Global Semiconductor Process Chambers Revenue million Forecast, by Country 2019 & 2032
- Table 26: Global Semiconductor Process Chambers Volume K Forecast, by Country 2019 & 2032
- Table 27: Brazil Semiconductor Process Chambers Revenue (million) Forecast, by Application 2019 & 2032
- Table 28: Brazil Semiconductor Process Chambers Volume (K) Forecast, by Application 2019 & 2032
- Table 29: Argentina Semiconductor Process Chambers Revenue (million) Forecast, by Application 2019 & 2032
- Table 30: Argentina Semiconductor Process Chambers Volume (K) Forecast, by Application 2019 & 2032
- Table 31: Rest of South America Semiconductor Process Chambers Revenue (million) Forecast, by Application 2019 & 2032
- Table 32: Rest of South America Semiconductor Process Chambers Volume (K) Forecast, by Application 2019 & 2032
- Table 33: Global Semiconductor Process Chambers Revenue million Forecast, by Application 2019 & 2032
- Table 34: Global Semiconductor Process Chambers Volume K Forecast, by Application 2019 & 2032
- Table 35: Global Semiconductor Process Chambers Revenue million Forecast, by Types 2019 & 2032
- Table 36: Global Semiconductor Process Chambers Volume K Forecast, by Types 2019 & 2032
- Table 37: Global Semiconductor Process Chambers Revenue million Forecast, by Country 2019 & 2032
- Table 38: Global Semiconductor Process Chambers Volume K Forecast, by Country 2019 & 2032
- Table 39: United Kingdom Semiconductor Process Chambers Revenue (million) Forecast, by Application 2019 & 2032
- Table 40: United Kingdom Semiconductor Process Chambers Volume (K) Forecast, by Application 2019 & 2032
- Table 41: Germany Semiconductor Process Chambers Revenue (million) Forecast, by Application 2019 & 2032
- Table 42: Germany Semiconductor Process Chambers Volume (K) Forecast, by Application 2019 & 2032
- Table 43: France Semiconductor Process Chambers Revenue (million) Forecast, by Application 2019 & 2032
- Table 44: France Semiconductor Process Chambers Volume (K) Forecast, by Application 2019 & 2032
- Table 45: Italy Semiconductor Process Chambers Revenue (million) Forecast, by Application 2019 & 2032
- Table 46: Italy Semiconductor Process Chambers Volume (K) Forecast, by Application 2019 & 2032
- Table 47: Spain Semiconductor Process Chambers Revenue (million) Forecast, by Application 2019 & 2032
- Table 48: Spain Semiconductor Process Chambers Volume (K) Forecast, by Application 2019 & 2032
- Table 49: Russia Semiconductor Process Chambers Revenue (million) Forecast, by Application 2019 & 2032
- Table 50: Russia Semiconductor Process Chambers Volume (K) Forecast, by Application 2019 & 2032
- Table 51: Benelux Semiconductor Process Chambers Revenue (million) Forecast, by Application 2019 & 2032
- Table 52: Benelux Semiconductor Process Chambers Volume (K) Forecast, by Application 2019 & 2032
- Table 53: Nordics Semiconductor Process Chambers Revenue (million) Forecast, by Application 2019 & 2032
- Table 54: Nordics Semiconductor Process Chambers Volume (K) Forecast, by Application 2019 & 2032
- Table 55: Rest of Europe Semiconductor Process Chambers Revenue (million) Forecast, by Application 2019 & 2032
- Table 56: Rest of Europe Semiconductor Process Chambers Volume (K) Forecast, by Application 2019 & 2032
- Table 57: Global Semiconductor Process Chambers Revenue million Forecast, by Application 2019 & 2032
- Table 58: Global Semiconductor Process Chambers Volume K Forecast, by Application 2019 & 2032
- Table 59: Global Semiconductor Process Chambers Revenue million Forecast, by Types 2019 & 2032
- Table 60: Global Semiconductor Process Chambers Volume K Forecast, by Types 2019 & 2032
- Table 61: Global Semiconductor Process Chambers Revenue million Forecast, by Country 2019 & 2032
- Table 62: Global Semiconductor Process Chambers Volume K Forecast, by Country 2019 & 2032
- Table 63: Turkey Semiconductor Process Chambers Revenue (million) Forecast, by Application 2019 & 2032
- Table 64: Turkey Semiconductor Process Chambers Volume (K) Forecast, by Application 2019 & 2032
- Table 65: Israel Semiconductor Process Chambers Revenue (million) Forecast, by Application 2019 & 2032
- Table 66: Israel Semiconductor Process Chambers Volume (K) Forecast, by Application 2019 & 2032
- Table 67: GCC Semiconductor Process Chambers Revenue (million) Forecast, by Application 2019 & 2032
- Table 68: GCC Semiconductor Process Chambers Volume (K) Forecast, by Application 2019 & 2032
- Table 69: North Africa Semiconductor Process Chambers Revenue (million) Forecast, by Application 2019 & 2032
- Table 70: North Africa Semiconductor Process Chambers Volume (K) Forecast, by Application 2019 & 2032
- Table 71: South Africa Semiconductor Process Chambers Revenue (million) Forecast, by Application 2019 & 2032
- Table 72: South Africa Semiconductor Process Chambers Volume (K) Forecast, by Application 2019 & 2032
- Table 73: Rest of Middle East & Africa Semiconductor Process Chambers Revenue (million) Forecast, by Application 2019 & 2032
- Table 74: Rest of Middle East & Africa Semiconductor Process Chambers Volume (K) Forecast, by Application 2019 & 2032
- Table 75: Global Semiconductor Process Chambers Revenue million Forecast, by Application 2019 & 2032
- Table 76: Global Semiconductor Process Chambers Volume K Forecast, by Application 2019 & 2032
- Table 77: Global Semiconductor Process Chambers Revenue million Forecast, by Types 2019 & 2032
- Table 78: Global Semiconductor Process Chambers Volume K Forecast, by Types 2019 & 2032
- Table 79: Global Semiconductor Process Chambers Revenue million Forecast, by Country 2019 & 2032
- Table 80: Global Semiconductor Process Chambers Volume K Forecast, by Country 2019 & 2032
- Table 81: China Semiconductor Process Chambers Revenue (million) Forecast, by Application 2019 & 2032
- Table 82: China Semiconductor Process Chambers Volume (K) Forecast, by Application 2019 & 2032
- Table 83: India Semiconductor Process Chambers Revenue (million) Forecast, by Application 2019 & 2032
- Table 84: India Semiconductor Process Chambers Volume (K) Forecast, by Application 2019 & 2032
- Table 85: Japan Semiconductor Process Chambers Revenue (million) Forecast, by Application 2019 & 2032
- Table 86: Japan Semiconductor Process Chambers Volume (K) Forecast, by Application 2019 & 2032
- Table 87: South Korea Semiconductor Process Chambers Revenue (million) Forecast, by Application 2019 & 2032
- Table 88: South Korea Semiconductor Process Chambers Volume (K) Forecast, by Application 2019 & 2032
- Table 89: ASEAN Semiconductor Process Chambers Revenue (million) Forecast, by Application 2019 & 2032
- Table 90: ASEAN Semiconductor Process Chambers Volume (K) Forecast, by Application 2019 & 2032
- Table 91: Oceania Semiconductor Process Chambers Revenue (million) Forecast, by Application 2019 & 2032
- Table 92: Oceania Semiconductor Process Chambers Volume (K) Forecast, by Application 2019 & 2032
- Table 93: Rest of Asia Pacific Semiconductor Process Chambers Revenue (million) Forecast, by Application 2019 & 2032
- Table 94: Rest of Asia Pacific Semiconductor Process Chambers Volume (K) Forecast, by Application 2019 & 2032
Frequently Asked Questions
1. What is the projected Compound Annual Growth Rate (CAGR) of the Semiconductor Process Chambers?
The projected CAGR is approximately XX%.
2. Which companies are prominent players in the Semiconductor Process Chambers?
Key companies in the market include Fiti Group, VACGEN, N2TECH CO., LTD, Calitech, Marumae Co., Ltd, Duratek Technology Co., Ltd., BoBoo, InSource, GNB-KL Group, Kaiser Aluminum (Imperial Machine & Tool), LACO Technologies, Sprint Precision Technologies Co., Ltd, KFMI, Shenyang Fortune Precision Equipment Co., Ltd, Tolerance Technology (Shanghai), Sanyue Semiconductor Technology.
3. What are the main segments of the Semiconductor Process Chambers?
The market segments include Application, Types.
4. Can you provide details about the market size?
The market size is estimated to be USD XXX million as of 2022.
5. What are some drivers contributing to market growth?
N/A
6. What are the notable trends driving market growth?
N/A
7. Are there any restraints impacting market growth?
N/A
8. Can you provide examples of recent developments in the market?
N/A
9. What pricing options are available for accessing the report?
Pricing options include single-user, multi-user, and enterprise licenses priced at USD 3350.00, USD 5025.00, and USD 6700.00 respectively.
10. Is the market size provided in terms of value or volume?
The market size is provided in terms of value, measured in million and volume, measured in K.
11. Are there any specific market keywords associated with the report?
Yes, the market keyword associated with the report is "Semiconductor Process Chambers," which aids in identifying and referencing the specific market segment covered.
12. How do I determine which pricing option suits my needs best?
The pricing options vary based on user requirements and access needs. Individual users may opt for single-user licenses, while businesses requiring broader access may choose multi-user or enterprise licenses for cost-effective access to the report.
13. Are there any additional resources or data provided in the Semiconductor Process Chambers report?
While the report offers comprehensive insights, it's advisable to review the specific contents or supplementary materials provided to ascertain if additional resources or data are available.
14. How can I stay updated on further developments or reports in the Semiconductor Process Chambers?
To stay informed about further developments, trends, and reports in the Semiconductor Process Chambers, consider subscribing to industry newsletters, following relevant companies and organizations, or regularly checking reputable industry news sources and publications.
Methodology
Step 1 - Identification of Relevant Samples Size from Population Database


Step 2 - Approaches for Defining Global Market Size (Value, Volume* & Price*)

Note*: In applicable scenarios
Step 3 - Data Sources
Primary Research
- Web Analytics
- Survey Reports
- Research Institute
- Latest Research Reports
- Opinion Leaders
Secondary Research
- Annual Reports
- White Paper
- Latest Press Release
- Industry Association
- Paid Database
- Investor Presentations

Step 4 - Data Triangulation
Involves using different sources of information in order to increase the validity of a study
These sources are likely to be stakeholders in a program - participants, other researchers, program staff, other community members, and so on.
Then we put all data in single framework & apply various statistical tools to find out the dynamic on the market.
During the analysis stage, feedback from the stakeholder groups would be compared to determine areas of agreement as well as areas of divergence


