
Key Insights
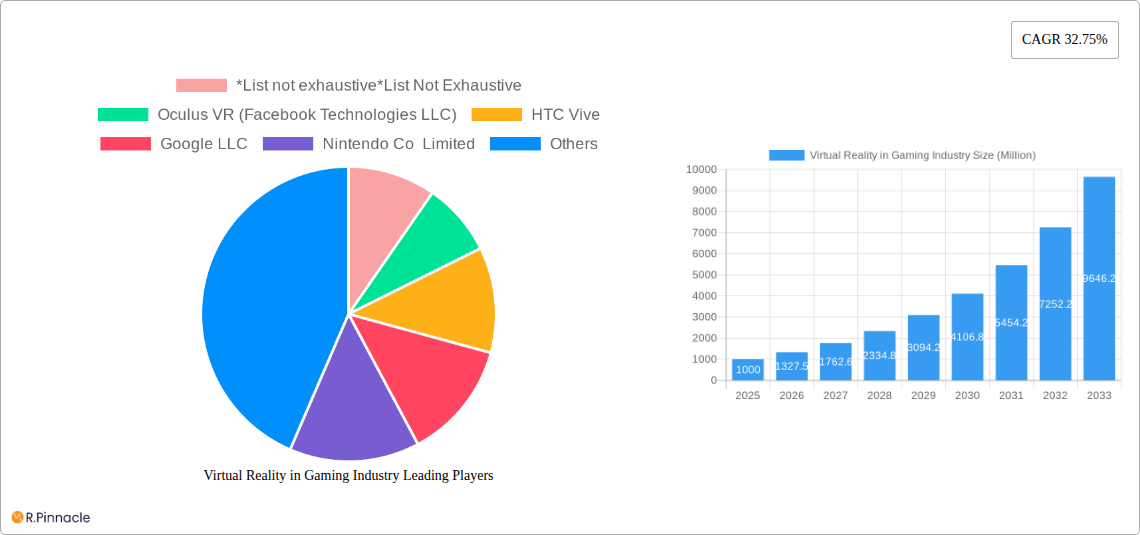
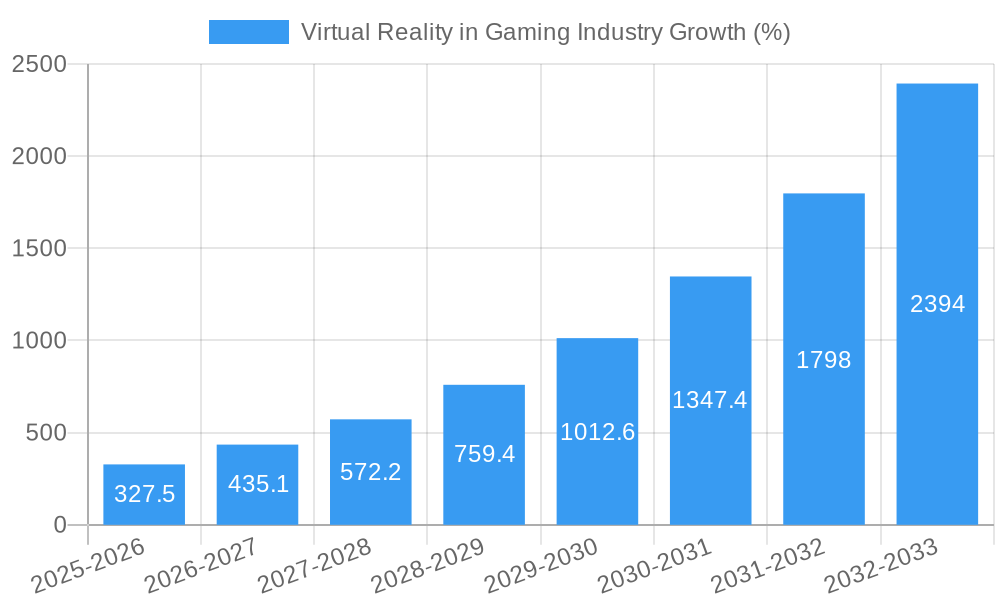
The virtual reality (VR) in gaming market is experiencing explosive growth, projected to reach a significant market size by 2033. A compound annual growth rate (CAGR) of 32.75% from 2025 to 2033 indicates a substantial increase in market value over the forecast period. This rapid expansion is driven by several key factors. Advancements in VR hardware are leading to more immersive and realistic gaming experiences, attracting a wider player base. The increasing affordability of VR headsets, combined with the development of compelling VR-exclusive game titles and improved graphical capabilities, further fuels market growth. Furthermore, the expansion of esports into the VR arena and the growing interest in metaverse experiences are creating new avenues for revenue generation and market penetration. The market is segmented by VR type (PC, standalone, console, mobile) and by gaming component (hardware, software), offering diversified growth opportunities across various sectors. While potential restraints exist, such as the initial high cost of entry and the potential for motion sickness, ongoing technological advancements and the continuous innovation in game development are mitigating these challenges. Leading companies like Oculus VR, HTC Vive, and others are continuously investing in research and development to enhance the VR gaming experience, fostering market expansion and strengthening their positions within the competitive landscape.
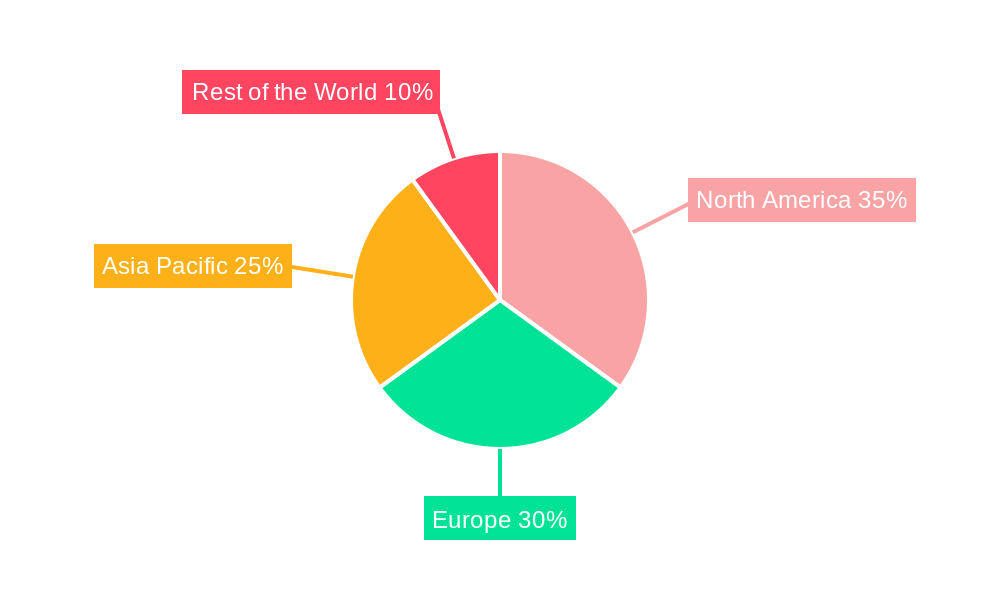
The geographical distribution of the VR in gaming market reveals significant regional variations. North America and Europe currently hold larger market shares, benefiting from established gaming cultures and higher disposable incomes. However, the Asia-Pacific region is expected to exhibit the most significant growth over the forecast period, driven by rising smartphone penetration, increasing internet access, and a burgeoning gaming community. The continuous expansion into emerging markets will further propel global market expansion. The strategic partnerships among hardware manufacturers, software developers, and game publishers are also crucial in driving market growth by providing a cohesive and improved user experience. This collaborative approach is expected to accelerate innovation and broaden the appeal of VR gaming to a larger and more diverse audience, reinforcing the market's long-term growth trajectory.
Virtual Reality in Gaming Industry: A Comprehensive Market Report (2019-2033)
This comprehensive report provides an in-depth analysis of the Virtual Reality (VR) gaming industry, offering invaluable insights for industry professionals, investors, and strategists. With a study period spanning 2019-2033, a base year of 2025, and a forecast period of 2025-2033, this report leverages extensive data and expert analysis to deliver actionable intelligence on market size, growth drivers, challenges, and emerging opportunities. The global VR gaming market is projected to reach xx Million by 2033, exhibiting significant growth potential.
Virtual Reality in Gaming Industry Market Structure & Innovation Trends
This section analyzes the competitive landscape, innovation drivers, and regulatory factors shaping the VR gaming market. The market exhibits a moderately concentrated structure, with key players such as Oculus VR (Facebook Technologies LLC), HTC Vive, Google LLC, Nintendo Co Limited, Virtuix Omni, Microsoft Corporation, Valve Corporation, Samsung Corporation, and Intel Corporation holding significant market share. However, the entry of numerous smaller players contributes to heightened competition. Innovation is driven by advancements in display technology, processing power, and haptic feedback, leading to more immersive and engaging experiences. M&A activity has played a crucial role in shaping the market, with deal values reaching xx Million in recent years. Market share distribution amongst the major players is dynamic, with xx% held by Oculus VR, xx% by HTC Vive, and the remainder spread across other competitors. Regulatory frameworks vary by region, impacting market access and product development. Consumer demographics are expanding beyond early adopters, with wider adoption amongst casual gamers and mainstream audiences driving growth.
Virtual Reality in Gaming Industry Market Dynamics & Trends
The VR gaming market is experiencing robust growth, fueled by several key factors. Technological advancements, including improvements in VR headset resolution, processing power, and tracking accuracy, are enhancing the user experience, making VR gaming more accessible and appealing. This leads to a Compound Annual Growth Rate (CAGR) of xx% during the forecast period. Consumer preferences are shifting towards immersive gaming experiences, driving demand for high-quality VR games and hardware. Market penetration continues to increase, reaching xx% in 2025 and projected to reach xx% by 2033. Competitive dynamics remain intense, with companies constantly innovating to differentiate their offerings. The increasing affordability of VR headsets and the expansion of VR game libraries are also contributing to market growth. This dynamic environment of intense competition and rapid innovation presents both opportunities and challenges for industry participants.
Dominant Regions & Segments in Virtual Reality in Gaming Industry
Dominant Regions: The North American market currently holds the largest share of the global VR gaming market, driven by strong consumer demand, high disposable incomes, and a well-established gaming culture. However, Asia-Pacific is poised for significant growth, fueled by increasing smartphone penetration and expanding internet access.
Dominant Segments:
- By VR Type: The standalone segment is experiencing rapid growth due to its ease of use and accessibility.
- By VR in Gaming: The hardware segment currently holds a larger market share, but the software segment is anticipated to grow at a faster rate as VR game development matures.
Key Drivers (by region and segment):
- North America: Strong consumer spending, technological innovation.
- Asia-Pacific: Rising disposable incomes, increasing smartphone and internet penetration.
- Standalone VR: Ease of use, affordability.
- Software: Growing content library, increasing demand for immersive games.
Virtual Reality in Gaming Industry Product Innovations
Recent product innovations are focused on enhancing immersion, improving comfort, and reducing cost. Advances in haptics, eye tracking, and foveated rendering are making VR gaming experiences more realistic and engaging. New VR headsets are lighter, more comfortable, and offer higher resolution displays. The market is witnessing the emergence of more affordable VR solutions, broadening access to this technology and driving wider adoption. This trend is accompanied by the development of innovative game mechanics designed specifically for the VR medium, expanding beyond simple porting of existing games to uniquely VR-tailored experiences.
Report Scope & Segmentation Analysis
This report segments the VR gaming market by VR type (PC, standalone, console, cartridges, premium mobile) and by VR in gaming (hardware, software). Each segment's growth projection, market size, and competitive dynamics are thoroughly analyzed. For instance, the standalone VR segment is projected to exhibit the fastest growth rate due to its ease of use and affordability. Conversely, the PC VR segment continues to dominate in terms of market share, but standalone VR is predicted to overtake it during the forecast period. The hardware segment is currently larger, but the software segment is expected to experience significant growth due to the expanding content library and increased user engagement.
Key Drivers of Virtual Reality in Gaming Industry Growth
Several factors are driving the growth of the VR gaming industry. Technological advancements, such as improved display resolution, processing power, and tracking accuracy, enhance the immersive gaming experience. The increasing affordability of VR headsets is broadening market access, attracting a wider consumer base. Furthermore, the expanding library of high-quality VR games caters to diverse gaming preferences. Government initiatives and private investments aimed at fostering technological innovation in the VR sector also contribute significantly to market expansion.
Challenges in the Virtual Reality in Gaming Industry Sector
The VR gaming industry faces several challenges. High initial costs of VR headsets, along with the need for powerful gaming PCs or consoles in certain cases, create a barrier to entry for some consumers. The limited availability of high-quality VR games and content compared to traditional gaming platforms restricts overall market expansion. Furthermore, concerns regarding motion sickness and potential health risks associated with prolonged VR use may deter some users. The ongoing development of supply chain challenges and potential disruptions caused by economic fluctuations also contribute to industry concerns.
Emerging Opportunities in Virtual Reality in Gaming Industry
The VR gaming industry presents various emerging opportunities. The integration of VR technology into other sectors, such as entertainment, education, and healthcare, creates new avenues for growth. The increasing adoption of cloud-based VR gaming services reduces the hardware requirements and makes VR accessible to a broader audience. The development of new VR gaming experiences tailored to specific user demographics (casual gamers, fitness enthusiasts) allows for further market penetration. Emerging platforms and technological advancements will lead to the development of innovative interaction mechanisms and immersive gameplay experiences.
Leading Players in the Virtual Reality in Gaming Industry Market
- Oculus VR (Facebook Technologies LLC)
- HTC Vive
- Google LLC
- Nintendo Co Limited
- Virtuix Omni
- Microsoft Corporation
- Valve Corporation
- Samsung Corporation
- Intel Corporation
Key Developments in Virtual Reality in Gaming Industry Industry
- November 2022: Meta launched the XTADIUM app on Meta Quest, offering immersive 180-degree VR sports viewing. This development significantly expanded the appeal of VR beyond gaming, creating new revenue streams.
- October 2022: Microsoft partnered with Meta to integrate Microsoft's productivity tools into VR headsets, further solidifying Meta's position in the metaverse and enhancing the utility of VR beyond entertainment. This strategic alliance boosted the market's credibility and fostered innovation.
Future Outlook for Virtual Reality in Gaming Industry Market
The future of the VR gaming market is bright. Continued technological advancements, increasing affordability, and the expansion of high-quality VR games will drive substantial growth. The integration of VR into other sectors and the emergence of new applications beyond gaming will create further opportunities. Strategic partnerships and investments will contribute to overcoming existing challenges and accelerate market expansion. The market is expected to witness a surge in innovation, with the potential for truly disruptive technologies transforming the gaming landscape in the coming decade.
Virtual Reality in Gaming Industry Segmentation
-
1. VR Type
- 1.1. PC
- 1.2. Stand-alone
- 1.3. Console
- 1.4. Cartridges
- 1.5. Premium Mobile
-
2. VR in Gaming
- 2.1. Hardware
- 2.2. Software
Virtual Reality in Gaming Industry Segmentation By Geography
- 1. North America
- 2. Europe
- 3. Asia Pacific
- 4. Rest of The World
Virtual Reality in Gaming Industry REPORT HIGHLIGHTS
| Aspects | Details |
|---|---|
| Study Period | 2019-2033 |
| Base Year | 2024 |
| Estimated Year | 2025 |
| Forecast Period | 2025-2033 |
| Historical Period | 2019-2024 |
| Growth Rate | CAGR of 32.75% from 2019-2033 |
| Segmentation |
|
Table of Contents
- 1. Introduction
- 1.1. Research Scope
- 1.2. Market Segmentation
- 1.3. Research Methodology
- 1.4. Definitions and Assumptions
- 2. Executive Summary
- 2.1. Introduction
- 3. Market Dynamics
- 3.1. Introduction
- 3.2. Market Drivers
- 3.2.1. Increasing Availability of Compelling and Theme-based Games in the VR Format; Millennial and High-income Groups to Drive Adoption in the Near and Medium-term; Premium Mobile Platform Contributing to the Growth of Market
- 3.3. Market Restrains
- 3.3.1. Threshold Related to Visual and Auditory Aspects | High Demand for Mobile AR Gaming
- 3.4. Market Trends
- 3.4.1. Premium Mobile Platform Contributing to the Growth of Market
- 4. Market Factor Analysis
- 4.1. Porters Five Forces
- 4.2. Supply/Value Chain
- 4.3. PESTEL analysis
- 4.4. Market Entropy
- 4.5. Patent/Trademark Analysis
- 5. Global Virtual Reality in Gaming Industry Analysis, Insights and Forecast, 2019-2031
- 5.1. Market Analysis, Insights and Forecast - by VR Type
- 5.1.1. PC
- 5.1.2. Stand-alone
- 5.1.3. Console
- 5.1.4. Cartridges
- 5.1.5. Premium Mobile
- 5.2. Market Analysis, Insights and Forecast - by VR in Gaming
- 5.2.1. Hardware
- 5.2.2. Software
- 5.3. Market Analysis, Insights and Forecast - by Region
- 5.3.1. North America
- 5.3.2. Europe
- 5.3.3. Asia Pacific
- 5.3.4. Rest of The World
- 5.1. Market Analysis, Insights and Forecast - by VR Type
- 6. North America Virtual Reality in Gaming Industry Analysis, Insights and Forecast, 2019-2031
- 6.1. Market Analysis, Insights and Forecast - by VR Type
- 6.1.1. PC
- 6.1.2. Stand-alone
- 6.1.3. Console
- 6.1.4. Cartridges
- 6.1.5. Premium Mobile
- 6.2. Market Analysis, Insights and Forecast - by VR in Gaming
- 6.2.1. Hardware
- 6.2.2. Software
- 6.1. Market Analysis, Insights and Forecast - by VR Type
- 7. Europe Virtual Reality in Gaming Industry Analysis, Insights and Forecast, 2019-2031
- 7.1. Market Analysis, Insights and Forecast - by VR Type
- 7.1.1. PC
- 7.1.2. Stand-alone
- 7.1.3. Console
- 7.1.4. Cartridges
- 7.1.5. Premium Mobile
- 7.2. Market Analysis, Insights and Forecast - by VR in Gaming
- 7.2.1. Hardware
- 7.2.2. Software
- 7.1. Market Analysis, Insights and Forecast - by VR Type
- 8. Asia Pacific Virtual Reality in Gaming Industry Analysis, Insights and Forecast, 2019-2031
- 8.1. Market Analysis, Insights and Forecast - by VR Type
- 8.1.1. PC
- 8.1.2. Stand-alone
- 8.1.3. Console
- 8.1.4. Cartridges
- 8.1.5. Premium Mobile
- 8.2. Market Analysis, Insights and Forecast - by VR in Gaming
- 8.2.1. Hardware
- 8.2.2. Software
- 8.1. Market Analysis, Insights and Forecast - by VR Type
- 9. Rest of The World Virtual Reality in Gaming Industry Analysis, Insights and Forecast, 2019-2031
- 9.1. Market Analysis, Insights and Forecast - by VR Type
- 9.1.1. PC
- 9.1.2. Stand-alone
- 9.1.3. Console
- 9.1.4. Cartridges
- 9.1.5. Premium Mobile
- 9.2. Market Analysis, Insights and Forecast - by VR in Gaming
- 9.2.1. Hardware
- 9.2.2. Software
- 9.1. Market Analysis, Insights and Forecast - by VR Type
- 10. North America Virtual Reality in Gaming Industry Analysis, Insights and Forecast, 2019-2031
- 10.1. Market Analysis, Insights and Forecast - By Country/Sub-region
- 10.1.1.
- 11. Europe Virtual Reality in Gaming Industry Analysis, Insights and Forecast, 2019-2031
- 11.1. Market Analysis, Insights and Forecast - By Country/Sub-region
- 11.1.1.
- 12. Asia Pacific Virtual Reality in Gaming Industry Analysis, Insights and Forecast, 2019-2031
- 12.1. Market Analysis, Insights and Forecast - By Country/Sub-region
- 12.1.1.
- 13. Rest of The World Virtual Reality in Gaming Industry Analysis, Insights and Forecast, 2019-2031
- 13.1. Market Analysis, Insights and Forecast - By Country/Sub-region
- 13.1.1.
- 14. Competitive Analysis
- 14.1. Global Market Share Analysis 2024
- 14.2. Company Profiles
- 14.2.1 *List not exhaustive*List Not Exhaustive
- 14.2.1.1. Overview
- 14.2.1.2. Products
- 14.2.1.3. SWOT Analysis
- 14.2.1.4. Recent Developments
- 14.2.1.5. Financials (Based on Availability)
- 14.2.2 Oculus VR (Facebook Technologies LLC)
- 14.2.2.1. Overview
- 14.2.2.2. Products
- 14.2.2.3. SWOT Analysis
- 14.2.2.4. Recent Developments
- 14.2.2.5. Financials (Based on Availability)
- 14.2.3 HTC Vive
- 14.2.3.1. Overview
- 14.2.3.2. Products
- 14.2.3.3. SWOT Analysis
- 14.2.3.4. Recent Developments
- 14.2.3.5. Financials (Based on Availability)
- 14.2.4 Google LLC
- 14.2.4.1. Overview
- 14.2.4.2. Products
- 14.2.4.3. SWOT Analysis
- 14.2.4.4. Recent Developments
- 14.2.4.5. Financials (Based on Availability)
- 14.2.5 Nintendo Co Limited
- 14.2.5.1. Overview
- 14.2.5.2. Products
- 14.2.5.3. SWOT Analysis
- 14.2.5.4. Recent Developments
- 14.2.5.5. Financials (Based on Availability)
- 14.2.6 Virtuix Omni
- 14.2.6.1. Overview
- 14.2.6.2. Products
- 14.2.6.3. SWOT Analysis
- 14.2.6.4. Recent Developments
- 14.2.6.5. Financials (Based on Availability)
- 14.2.7 Microsoft Corporation
- 14.2.7.1. Overview
- 14.2.7.2. Products
- 14.2.7.3. SWOT Analysis
- 14.2.7.4. Recent Developments
- 14.2.7.5. Financials (Based on Availability)
- 14.2.8 Valve Corporation
- 14.2.8.1. Overview
- 14.2.8.2. Products
- 14.2.8.3. SWOT Analysis
- 14.2.8.4. Recent Developments
- 14.2.8.5. Financials (Based on Availability)
- 14.2.9 Samsung Corporation
- 14.2.9.1. Overview
- 14.2.9.2. Products
- 14.2.9.3. SWOT Analysis
- 14.2.9.4. Recent Developments
- 14.2.9.5. Financials (Based on Availability)
- 14.2.10 Intel Corporation
- 14.2.10.1. Overview
- 14.2.10.2. Products
- 14.2.10.3. SWOT Analysis
- 14.2.10.4. Recent Developments
- 14.2.10.5. Financials (Based on Availability)
- 14.2.1 *List not exhaustive*List Not Exhaustive
List of Figures
- Figure 1: Global Virtual Reality in Gaming Industry Revenue Breakdown (Million, %) by Region 2024 & 2032
- Figure 2: North America Virtual Reality in Gaming Industry Revenue (Million), by Country 2024 & 2032
- Figure 3: North America Virtual Reality in Gaming Industry Revenue Share (%), by Country 2024 & 2032
- Figure 4: Europe Virtual Reality in Gaming Industry Revenue (Million), by Country 2024 & 2032
- Figure 5: Europe Virtual Reality in Gaming Industry Revenue Share (%), by Country 2024 & 2032
- Figure 6: Asia Pacific Virtual Reality in Gaming Industry Revenue (Million), by Country 2024 & 2032
- Figure 7: Asia Pacific Virtual Reality in Gaming Industry Revenue Share (%), by Country 2024 & 2032
- Figure 8: Rest of The World Virtual Reality in Gaming Industry Revenue (Million), by Country 2024 & 2032
- Figure 9: Rest of The World Virtual Reality in Gaming Industry Revenue Share (%), by Country 2024 & 2032
- Figure 10: North America Virtual Reality in Gaming Industry Revenue (Million), by VR Type 2024 & 2032
- Figure 11: North America Virtual Reality in Gaming Industry Revenue Share (%), by VR Type 2024 & 2032
- Figure 12: North America Virtual Reality in Gaming Industry Revenue (Million), by VR in Gaming 2024 & 2032
- Figure 13: North America Virtual Reality in Gaming Industry Revenue Share (%), by VR in Gaming 2024 & 2032
- Figure 14: North America Virtual Reality in Gaming Industry Revenue (Million), by Country 2024 & 2032
- Figure 15: North America Virtual Reality in Gaming Industry Revenue Share (%), by Country 2024 & 2032
- Figure 16: Europe Virtual Reality in Gaming Industry Revenue (Million), by VR Type 2024 & 2032
- Figure 17: Europe Virtual Reality in Gaming Industry Revenue Share (%), by VR Type 2024 & 2032
- Figure 18: Europe Virtual Reality in Gaming Industry Revenue (Million), by VR in Gaming 2024 & 2032
- Figure 19: Europe Virtual Reality in Gaming Industry Revenue Share (%), by VR in Gaming 2024 & 2032
- Figure 20: Europe Virtual Reality in Gaming Industry Revenue (Million), by Country 2024 & 2032
- Figure 21: Europe Virtual Reality in Gaming Industry Revenue Share (%), by Country 2024 & 2032
- Figure 22: Asia Pacific Virtual Reality in Gaming Industry Revenue (Million), by VR Type 2024 & 2032
- Figure 23: Asia Pacific Virtual Reality in Gaming Industry Revenue Share (%), by VR Type 2024 & 2032
- Figure 24: Asia Pacific Virtual Reality in Gaming Industry Revenue (Million), by VR in Gaming 2024 & 2032
- Figure 25: Asia Pacific Virtual Reality in Gaming Industry Revenue Share (%), by VR in Gaming 2024 & 2032
- Figure 26: Asia Pacific Virtual Reality in Gaming Industry Revenue (Million), by Country 2024 & 2032
- Figure 27: Asia Pacific Virtual Reality in Gaming Industry Revenue Share (%), by Country 2024 & 2032
- Figure 28: Rest of The World Virtual Reality in Gaming Industry Revenue (Million), by VR Type 2024 & 2032
- Figure 29: Rest of The World Virtual Reality in Gaming Industry Revenue Share (%), by VR Type 2024 & 2032
- Figure 30: Rest of The World Virtual Reality in Gaming Industry Revenue (Million), by VR in Gaming 2024 & 2032
- Figure 31: Rest of The World Virtual Reality in Gaming Industry Revenue Share (%), by VR in Gaming 2024 & 2032
- Figure 32: Rest of The World Virtual Reality in Gaming Industry Revenue (Million), by Country 2024 & 2032
- Figure 33: Rest of The World Virtual Reality in Gaming Industry Revenue Share (%), by Country 2024 & 2032
List of Tables
- Table 1: Global Virtual Reality in Gaming Industry Revenue Million Forecast, by Region 2019 & 2032
- Table 2: Global Virtual Reality in Gaming Industry Revenue Million Forecast, by VR Type 2019 & 2032
- Table 3: Global Virtual Reality in Gaming Industry Revenue Million Forecast, by VR in Gaming 2019 & 2032
- Table 4: Global Virtual Reality in Gaming Industry Revenue Million Forecast, by Region 2019 & 2032
- Table 5: Global Virtual Reality in Gaming Industry Revenue Million Forecast, by Country 2019 & 2032
- Table 6: Virtual Reality in Gaming Industry Revenue (Million) Forecast, by Application 2019 & 2032
- Table 7: Global Virtual Reality in Gaming Industry Revenue Million Forecast, by Country 2019 & 2032
- Table 8: Virtual Reality in Gaming Industry Revenue (Million) Forecast, by Application 2019 & 2032
- Table 9: Global Virtual Reality in Gaming Industry Revenue Million Forecast, by Country 2019 & 2032
- Table 10: Virtual Reality in Gaming Industry Revenue (Million) Forecast, by Application 2019 & 2032
- Table 11: Global Virtual Reality in Gaming Industry Revenue Million Forecast, by Country 2019 & 2032
- Table 12: Virtual Reality in Gaming Industry Revenue (Million) Forecast, by Application 2019 & 2032
- Table 13: Global Virtual Reality in Gaming Industry Revenue Million Forecast, by VR Type 2019 & 2032
- Table 14: Global Virtual Reality in Gaming Industry Revenue Million Forecast, by VR in Gaming 2019 & 2032
- Table 15: Global Virtual Reality in Gaming Industry Revenue Million Forecast, by Country 2019 & 2032
- Table 16: Global Virtual Reality in Gaming Industry Revenue Million Forecast, by VR Type 2019 & 2032
- Table 17: Global Virtual Reality in Gaming Industry Revenue Million Forecast, by VR in Gaming 2019 & 2032
- Table 18: Global Virtual Reality in Gaming Industry Revenue Million Forecast, by Country 2019 & 2032
- Table 19: Global Virtual Reality in Gaming Industry Revenue Million Forecast, by VR Type 2019 & 2032
- Table 20: Global Virtual Reality in Gaming Industry Revenue Million Forecast, by VR in Gaming 2019 & 2032
- Table 21: Global Virtual Reality in Gaming Industry Revenue Million Forecast, by Country 2019 & 2032
- Table 22: Global Virtual Reality in Gaming Industry Revenue Million Forecast, by VR Type 2019 & 2032
- Table 23: Global Virtual Reality in Gaming Industry Revenue Million Forecast, by VR in Gaming 2019 & 2032
- Table 24: Global Virtual Reality in Gaming Industry Revenue Million Forecast, by Country 2019 & 2032
Frequently Asked Questions
1. What is the projected Compound Annual Growth Rate (CAGR) of the Virtual Reality in Gaming Industry?
The projected CAGR is approximately 32.75%.
2. Which companies are prominent players in the Virtual Reality in Gaming Industry?
Key companies in the market include *List not exhaustive*List Not Exhaustive, Oculus VR (Facebook Technologies LLC), HTC Vive, Google LLC, Nintendo Co Limited, Virtuix Omni, Microsoft Corporation, Valve Corporation, Samsung Corporation, Intel Corporation.
3. What are the main segments of the Virtual Reality in Gaming Industry?
The market segments include VR Type, VR in Gaming.
4. Can you provide details about the market size?
The market size is estimated to be USD XX Million as of 2022.
5. What are some drivers contributing to market growth?
Increasing Availability of Compelling and Theme-based Games in the VR Format; Millennial and High-income Groups to Drive Adoption in the Near and Medium-term; Premium Mobile Platform Contributing to the Growth of Market.
6. What are the notable trends driving market growth?
Premium Mobile Platform Contributing to the Growth of Market.
7. Are there any restraints impacting market growth?
Threshold Related to Visual and Auditory Aspects | High Demand for Mobile AR Gaming.
8. Can you provide examples of recent developments in the market?
Nov 2022: Meta launched the XTADIUM app on Meta Quest, bringing the customers closer to their favorite sports in 180-degree VR.
9. What pricing options are available for accessing the report?
Pricing options include single-user, multi-user, and enterprise licenses priced at USD 4750, USD 5250, and USD 8750 respectively.
10. Is the market size provided in terms of value or volume?
The market size is provided in terms of value, measured in Million.
11. Are there any specific market keywords associated with the report?
Yes, the market keyword associated with the report is "Virtual Reality in Gaming Industry," which aids in identifying and referencing the specific market segment covered.
12. How do I determine which pricing option suits my needs best?
The pricing options vary based on user requirements and access needs. Individual users may opt for single-user licenses, while businesses requiring broader access may choose multi-user or enterprise licenses for cost-effective access to the report.
13. Are there any additional resources or data provided in the Virtual Reality in Gaming Industry report?
While the report offers comprehensive insights, it's advisable to review the specific contents or supplementary materials provided to ascertain if additional resources or data are available.
14. How can I stay updated on further developments or reports in the Virtual Reality in Gaming Industry?
To stay informed about further developments, trends, and reports in the Virtual Reality in Gaming Industry, consider subscribing to industry newsletters, following relevant companies and organizations, or regularly checking reputable industry news sources and publications.
Methodology
Step 1 - Identification of Relevant Samples Size from Population Database


Step 2 - Approaches for Defining Global Market Size (Value, Volume* & Price*)

Note*: In applicable scenarios
Step 3 - Data Sources
Primary Research
- Web Analytics
- Survey Reports
- Research Institute
- Latest Research Reports
- Opinion Leaders
Secondary Research
- Annual Reports
- White Paper
- Latest Press Release
- Industry Association
- Paid Database
- Investor Presentations

Step 4 - Data Triangulation
Involves using different sources of information in order to increase the validity of a study
These sources are likely to be stakeholders in a program - participants, other researchers, program staff, other community members, and so on.
Then we put all data in single framework & apply various statistical tools to find out the dynamic on the market.
During the analysis stage, feedback from the stakeholder groups would be compared to determine areas of agreement as well as areas of divergence


