
Key Insights
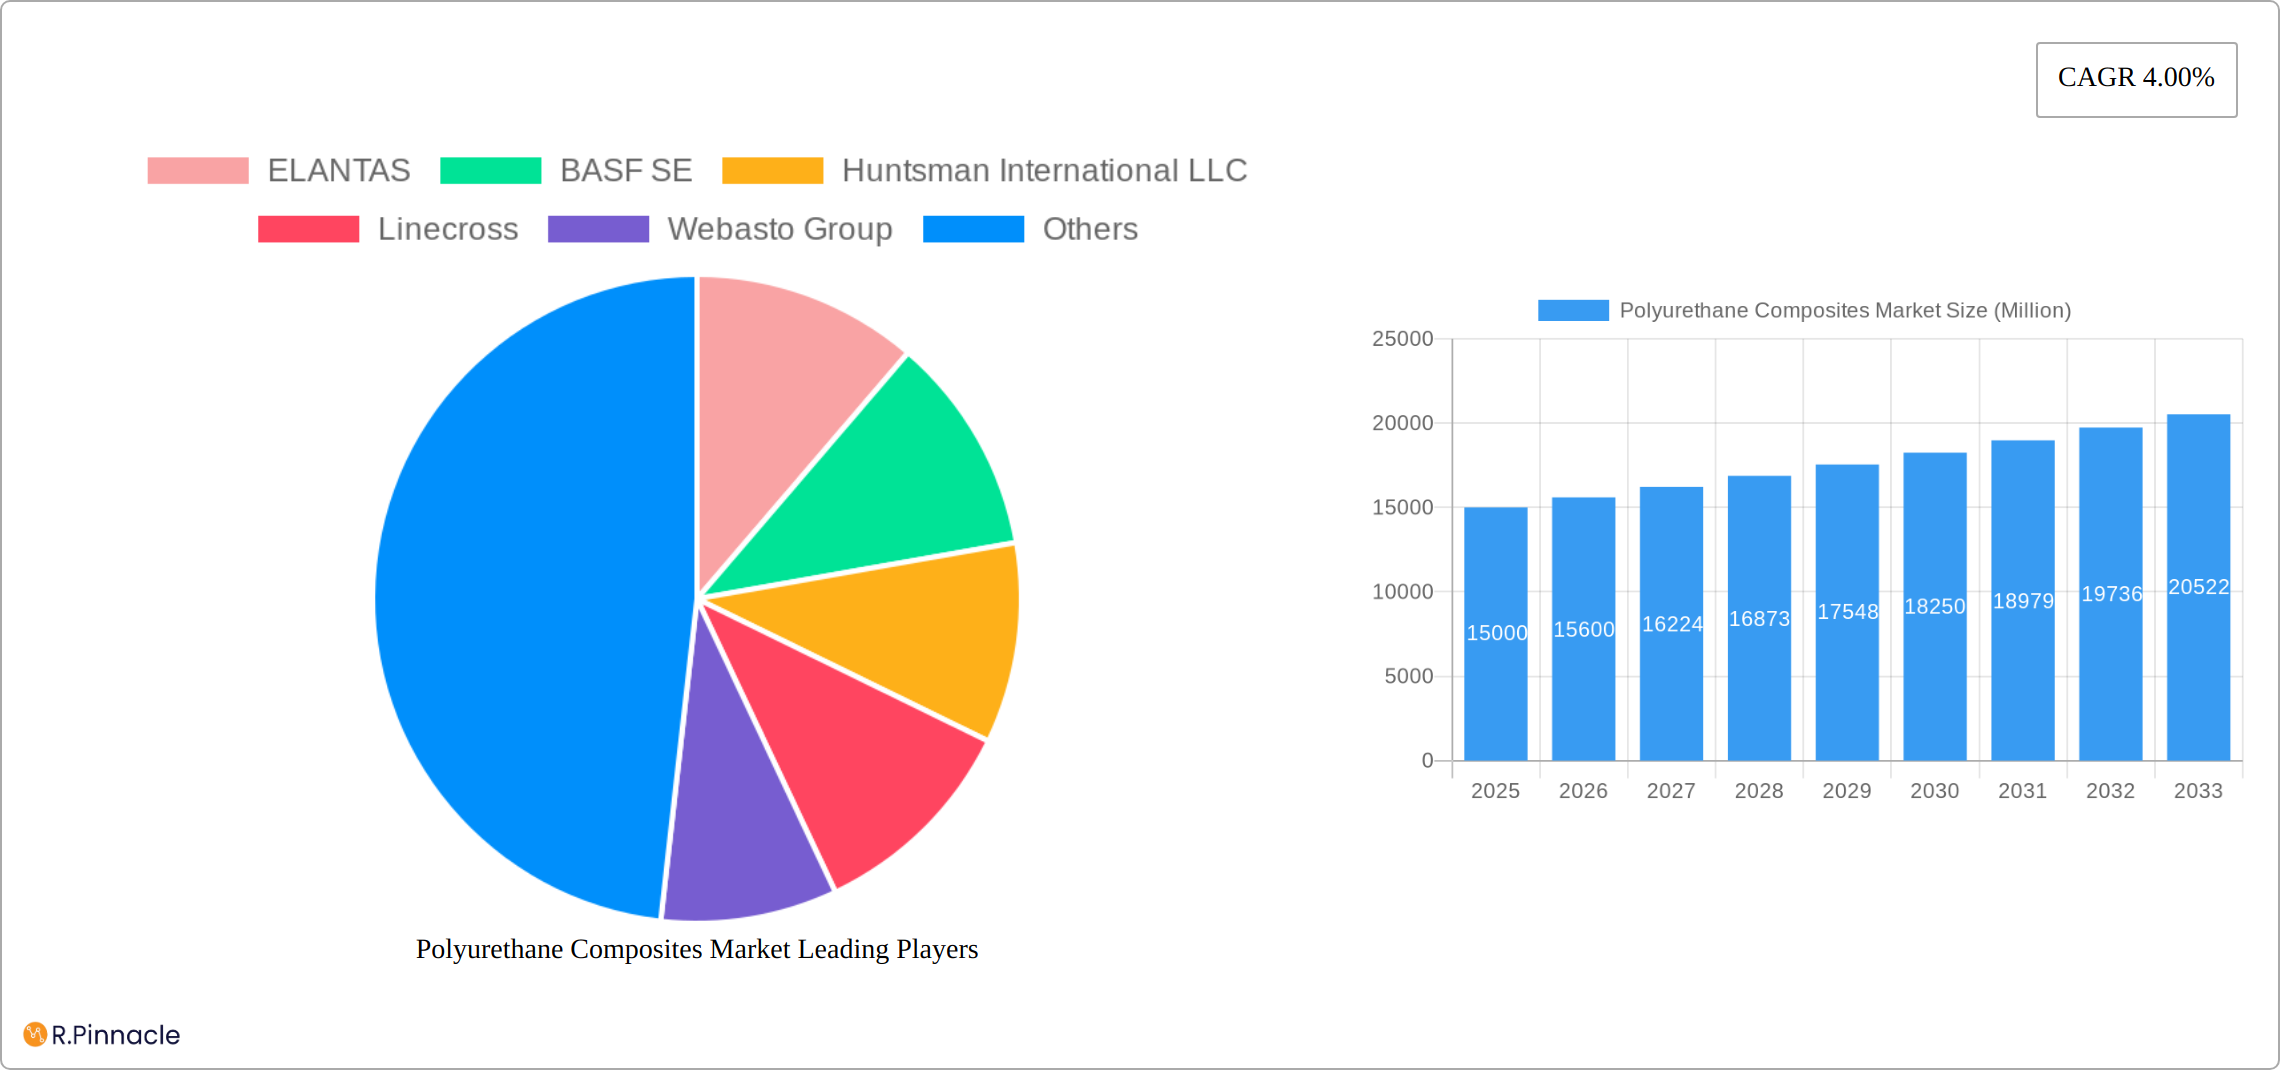
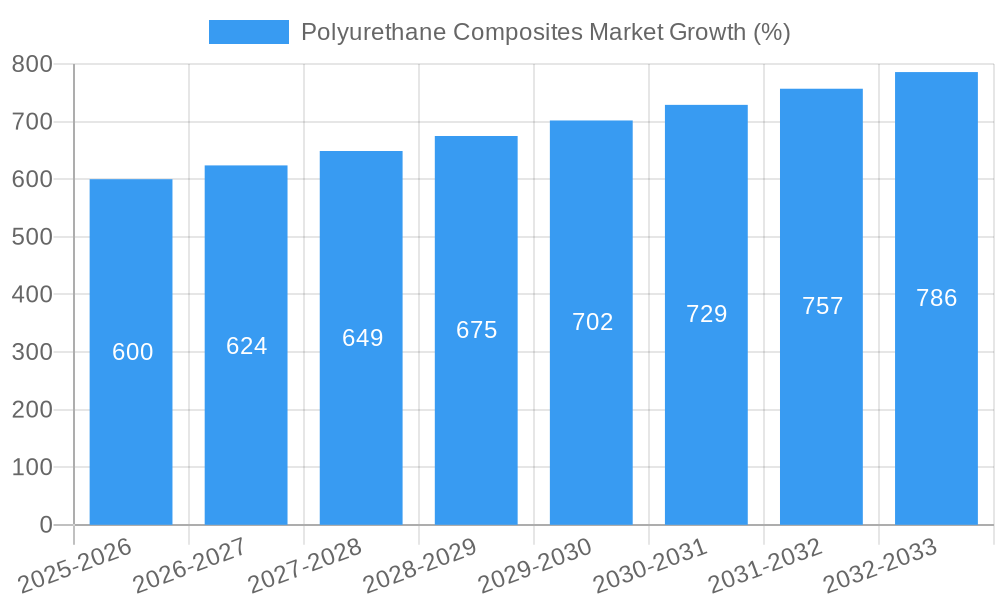
The global polyurethane composites market is experiencing steady growth, projected to maintain a Compound Annual Growth Rate (CAGR) of 4.00% from 2025 to 2033. This expansion is driven by the increasing demand across diverse end-user industries, particularly in the transportation sector (automotive and aerospace) where lightweighting and high-performance materials are crucial. The construction industry's adoption of polyurethane composites for insulation and structural components further fuels market growth. Technological advancements in fiber types, particularly the wider adoption of carbon fiber for enhanced strength and stiffness, contribute significantly to the market's dynamism. While the market faces some restraints, such as the fluctuating prices of raw materials and environmental concerns related to polyurethane production, these challenges are being mitigated through the development of more sustainable and cost-effective manufacturing processes. The Asia-Pacific region, specifically China and India, are significant growth drivers, fueled by robust infrastructure development and expanding industrial production. The segmentation by fiber type (glass, carbon, others) and end-user industry (transportation, building & construction, electrical & electronics, wind energy, others) highlights the market's diverse application landscape. Leading players like ELANTAS, BASF SE, Huntsman International LLC, and Covestro AG are actively investing in research and development to enhance product offerings and cater to the evolving market demands. The market's resilience and consistent growth trajectory suggest a positive outlook for the coming decade.
The market's growth is also influenced by government regulations promoting energy efficiency and sustainable construction practices. This is especially apparent in the wind energy sector, where lightweight and durable polyurethane composites are essential for efficient turbine blade construction. The continued expansion of the global automotive industry, coupled with a focus on fuel efficiency and improved vehicle performance, ensures strong demand for polyurethane composites in automotive applications. Furthermore, the increasing popularity of electric vehicles further boosts the market, as these vehicles often utilize polyurethane composites for their battery enclosures and other components. While competition among manufacturers is intense, innovation and strategic partnerships are driving consolidation and market expansion, promising continued growth throughout the forecast period.
Polyurethane Composites Market: A Comprehensive Analysis (2019-2033)
This in-depth report provides a comprehensive analysis of the Polyurethane Composites Market, offering actionable insights for industry professionals, investors, and strategists. The study covers the period 2019-2033, with a focus on the 2025-2033 forecast period and a base year of 2025. The report meticulously analyzes market dynamics, key segments, dominant players, and future growth potential, providing a robust understanding of this rapidly evolving sector. The market size is estimated at xx Million in 2025 and is projected to reach xx Million by 2033.
Polyurethane Composites Market Structure & Innovation Trends
This section analyzes the competitive landscape of the Polyurethane Composites market, exploring market concentration, innovation drivers, regulatory influences, and industry dynamics. The market exhibits a moderately concentrated structure with key players holding significant market share. For example, BASF SE and Covestro AG are estimated to collectively hold approximately xx% of the market share in 2025. Innovation is driven by the need for lightweight, high-strength materials in various end-use industries. Regulatory frameworks related to environmental concerns and material safety significantly impact the market. Significant M&A activity has been observed in recent years, with deal values reaching xx Million in 2024 alone. Product substitution pressures exist from alternative composite materials, necessitating continuous innovation in polyurethane composite technology. The end-user demographics are diverse, spanning the transportation, construction, and electronics sectors.
- Market Concentration: Moderately concentrated, with top players holding xx% market share (2025 estimate).
- Innovation Drivers: Lightweighting needs, high-strength requirements, and environmental regulations.
- Regulatory Frameworks: Stringent safety and environmental standards influence material selection and manufacturing processes.
- Product Substitutes: Competition from alternative composite materials.
- M&A Activities: Significant activity, with deal values reaching xx Million in 2024.
- End-User Demographics: Transportation, building & construction, and electrical & electronics are major consumers.
Polyurethane Composites Market Dynamics & Trends
The Polyurethane Composites market is experiencing robust growth, driven by several key factors. The increasing demand for lightweight and high-performance materials in the automotive and aerospace industries is a major driver. Technological advancements, such as the development of novel polyurethane formulations and processing techniques, are further boosting market expansion. The CAGR for the forecast period (2025-2033) is estimated to be xx%, reflecting the strong market momentum. Consumer preferences are shifting towards sustainable and environmentally friendly materials, presenting both challenges and opportunities for market players. Competitive dynamics are characterized by intense rivalry among established players and the emergence of new entrants offering innovative solutions. Market penetration is expected to increase significantly in developing economies due to growing infrastructure development and industrialization.
Dominant Regions & Segments in Polyurethane Composites Market
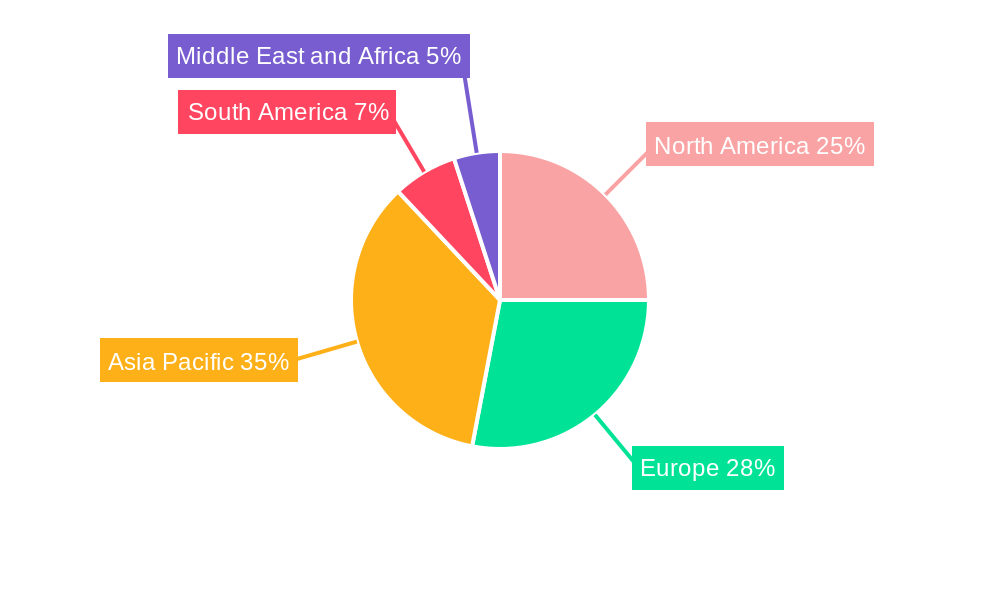
The transportation sector represents the largest end-use industry for polyurethane composites, accounting for an estimated xx% of the market in 2025. The glass fiber type segment dominates the market by fiber type, holding approximately xx% market share due to its cost-effectiveness and versatile properties. Geographically, North America and Europe currently hold the largest market shares, driven by strong automotive and construction industries. Asia-Pacific is anticipated to experience the fastest growth in the forecast period, fueled by rapid industrialization and infrastructure development.
- Key Drivers for Transportation Sector: Lightweighting regulations, fuel efficiency standards, and growing vehicle production.
- Key Drivers for Glass Fiber Segment: Cost-effectiveness, versatile properties, and ease of processing.
- Key Drivers for North America and Europe: Established automotive and construction industries, stringent environmental regulations.
- Key Drivers for Asia-Pacific Growth: Rapid industrialization, infrastructure development, and increasing demand for consumer goods.
Polyurethane Composites Market Product Innovations
Recent innovations include the development of bio-based polyurethanes, enhancing sustainability and reducing environmental impact. Advanced polyurethane formulations with improved mechanical properties, such as enhanced strength and durability, are gaining traction. These innovations cater to diverse applications, including automotive parts, wind turbine blades, and construction materials. The competitive advantage lies in offering superior performance, cost-effectiveness, and environmentally responsible solutions.
Report Scope & Segmentation Analysis
This report segments the Polyurethane Composites market by fiber type (Glass, Carbon, Others) and end-user industry (Transportation, Building & Construction, Electrical & Electronics, Wind Energy, Others). Each segment's market size, growth projections, and competitive dynamics are analyzed in detail. The transportation segment is projected to register the highest CAGR, driven by the rising demand for lightweight vehicles. The glass fiber segment is expected to maintain its market dominance due to its cost-effectiveness. Detailed competitive analysis within each segment is provided, examining the strategies and market positions of key players.
Key Drivers of Polyurethane Composites Market Growth
The polyurethane composites market is experiencing robust growth, driven by a confluence of factors. Technological advancements are at the forefront, with continuous innovation leading to high-performance formulations boasting superior strength, durability, and enhanced thermal and acoustic properties. This is particularly crucial in sectors demanding lightweight yet robust materials, such as the automotive and aerospace industries, where weight reduction translates directly to improved fuel efficiency and performance. The growing emphasis on sustainability further fuels market expansion. Government regulations promoting fuel efficiency, reducing carbon emissions, and mandating the use of recycled materials are creating significant demand for eco-friendly polyurethane composite solutions. Furthermore, favorable economic conditions in several regions, especially within developing economies experiencing rapid industrialization, contribute significantly to market expansion. The increasing adoption of polyurethane composites in diverse applications, including construction, wind energy, and consumer goods, also contributes to this upward trajectory.
Challenges in the Polyurethane Composites Market Sector
Despite the promising growth outlook, the polyurethane composites market faces several challenges. Fluctuating raw material prices, particularly for isocyanates and polyols, represent a significant obstacle, impacting production costs and profitability. Stringent environmental regulations concerning the manufacturing, use, and disposal of polyurethane composites add complexity and increase compliance costs. Manufacturers must navigate intricate regulatory landscapes and invest in sustainable production processes to ensure compliance. The market is also characterized by intense competition, with established players vying for market share alongside the emergence of innovative newcomers. This competitive pressure necessitates continuous innovation, cost optimization, and the development of differentiated product offerings. Supply chain disruptions, exacerbated by geopolitical instability and unforeseen events, can significantly impact production capacity, delivery timelines, and overall market stability.
Emerging Opportunities in Polyurethane Composites Market
Emerging opportunities exist in the development and adoption of sustainable and bio-based polyurethane composites. Growth is expected in the wind energy sector, as polyurethane composites are increasingly utilized in wind turbine blades. The increasing demand for high-performance materials in the aerospace industry presents significant potential. Expansion into new geographic markets, particularly in developing economies, offers substantial growth opportunities.
Leading Players in the Polyurethane Composites Market Market
Key Developments in Polyurethane Composites Market Industry
- January 2023: BASF SE launched a new range of high-performance polyurethane composites for automotive applications, featuring enhanced lightweighting capabilities and improved crash performance. This expansion underscores the company's commitment to meeting the evolving demands of the automotive industry.
- March 2024: Covestro AG announced a strategic partnership focused on developing sustainable polyurethane composite solutions utilizing recycled materials and bio-based feedstocks. This collaboration highlights the increasing focus on environmentally responsible manufacturing practices within the industry.
- June 2024: Huntsman International LLC acquired a smaller competitor, expanding its market share and product portfolio, notably strengthening its position in the [Specify Market Segment if known, e.g., aerospace or construction] sector. (Further details on acquisitions and their impact on market dynamics are available within the full report).
- [Add another recent development with date and brief description] (Example: October 2024: A new manufacturing process for reducing VOC emissions in polyurethane composite production was patented by [Company Name], potentially altering industry standards.)
Future Outlook for Polyurethane Composites Market Market
The Polyurethane Composites market is poised for sustained growth over the forecast period. Technological advancements, increasing demand from key end-use industries, and favorable economic conditions will drive market expansion. Strategic partnerships, investments in research and development, and expansion into new markets are key growth accelerators. The market's future success will hinge on the industry's ability to innovate sustainable and high-performance solutions that meet evolving consumer and regulatory demands.
Polyurethane Composites Market Segmentation
-
1. Fiber Type
- 1.1. Glass
- 1.2. Carbon
- 1.3. Others
-
2. End-user Industry
- 2.1. Transportation
- 2.2. Building & Construction
- 2.3. Electrical & Electronics
- 2.4. Wind Energy
- 2.5. Others
Polyurethane Composites Market Segmentation By Geography
-
1. Asia Pacific
- 1.1. China
- 1.2. India
- 1.3. Japan
- 1.4. South Korea
- 1.5. Rest of Asia Pacific
-
2. North America
- 2.1. United States
- 2.2. Canada
- 2.3. Mexico
-
3. Europe
- 3.1. Germany
- 3.2. United Kingdom
- 3.3. Italy
- 3.4. France
- 3.5. Rest of Europe
-
4. South America
- 4.1. Brazil
- 4.2. Argentina
- 4.3. Rest of South America
-
5. Middle East and Africa
- 5.1. Saudi Arabia
- 5.2. South Africa
- 5.3. Rest of Middle East and Africa
Polyurethane Composites Market REPORT HIGHLIGHTS
| Aspects | Details |
|---|---|
| Study Period | 2019-2033 |
| Base Year | 2024 |
| Estimated Year | 2025 |
| Forecast Period | 2025-2033 |
| Historical Period | 2019-2024 |
| Growth Rate | CAGR of 4.00% from 2019-2033 |
| Segmentation |
|
Table of Contents
- 1. Introduction
- 1.1. Research Scope
- 1.2. Market Segmentation
- 1.3. Research Methodology
- 1.4. Definitions and Assumptions
- 2. Executive Summary
- 2.1. Introduction
- 3. Market Dynamics
- 3.1. Introduction
- 3.2. Market Drivers
- 3.2.1. ; Increasing Demand for the Lightweight Materials From the Transportation Industry; Growing Demand from the Building and Construction Industry
- 3.3. Market Restrains
- 3.3.1. ; Slowdown in the Global Automotive Production; High Production Costs
- 3.4. Market Trends
- 3.4.1. Increasing demand from the Transportation Industry
- 4. Market Factor Analysis
- 4.1. Porters Five Forces
- 4.2. Supply/Value Chain
- 4.3. PESTEL analysis
- 4.4. Market Entropy
- 4.5. Patent/Trademark Analysis
- 5. Global Polyurethane Composites Market Analysis, Insights and Forecast, 2019-2031
- 5.1. Market Analysis, Insights and Forecast - by Fiber Type
- 5.1.1. Glass
- 5.1.2. Carbon
- 5.1.3. Others
- 5.2. Market Analysis, Insights and Forecast - by End-user Industry
- 5.2.1. Transportation
- 5.2.2. Building & Construction
- 5.2.3. Electrical & Electronics
- 5.2.4. Wind Energy
- 5.2.5. Others
- 5.3. Market Analysis, Insights and Forecast - by Region
- 5.3.1. Asia Pacific
- 5.3.2. North America
- 5.3.3. Europe
- 5.3.4. South America
- 5.3.5. Middle East and Africa
- 5.1. Market Analysis, Insights and Forecast - by Fiber Type
- 6. Asia Pacific Polyurethane Composites Market Analysis, Insights and Forecast, 2019-2031
- 6.1. Market Analysis, Insights and Forecast - by Fiber Type
- 6.1.1. Glass
- 6.1.2. Carbon
- 6.1.3. Others
- 6.2. Market Analysis, Insights and Forecast - by End-user Industry
- 6.2.1. Transportation
- 6.2.2. Building & Construction
- 6.2.3. Electrical & Electronics
- 6.2.4. Wind Energy
- 6.2.5. Others
- 6.1. Market Analysis, Insights and Forecast - by Fiber Type
- 7. North America Polyurethane Composites Market Analysis, Insights and Forecast, 2019-2031
- 7.1. Market Analysis, Insights and Forecast - by Fiber Type
- 7.1.1. Glass
- 7.1.2. Carbon
- 7.1.3. Others
- 7.2. Market Analysis, Insights and Forecast - by End-user Industry
- 7.2.1. Transportation
- 7.2.2. Building & Construction
- 7.2.3. Electrical & Electronics
- 7.2.4. Wind Energy
- 7.2.5. Others
- 7.1. Market Analysis, Insights and Forecast - by Fiber Type
- 8. Europe Polyurethane Composites Market Analysis, Insights and Forecast, 2019-2031
- 8.1. Market Analysis, Insights and Forecast - by Fiber Type
- 8.1.1. Glass
- 8.1.2. Carbon
- 8.1.3. Others
- 8.2. Market Analysis, Insights and Forecast - by End-user Industry
- 8.2.1. Transportation
- 8.2.2. Building & Construction
- 8.2.3. Electrical & Electronics
- 8.2.4. Wind Energy
- 8.2.5. Others
- 8.1. Market Analysis, Insights and Forecast - by Fiber Type
- 9. South America Polyurethane Composites Market Analysis, Insights and Forecast, 2019-2031
- 9.1. Market Analysis, Insights and Forecast - by Fiber Type
- 9.1.1. Glass
- 9.1.2. Carbon
- 9.1.3. Others
- 9.2. Market Analysis, Insights and Forecast - by End-user Industry
- 9.2.1. Transportation
- 9.2.2. Building & Construction
- 9.2.3. Electrical & Electronics
- 9.2.4. Wind Energy
- 9.2.5. Others
- 9.1. Market Analysis, Insights and Forecast - by Fiber Type
- 10. Middle East and Africa Polyurethane Composites Market Analysis, Insights and Forecast, 2019-2031
- 10.1. Market Analysis, Insights and Forecast - by Fiber Type
- 10.1.1. Glass
- 10.1.2. Carbon
- 10.1.3. Others
- 10.2. Market Analysis, Insights and Forecast - by End-user Industry
- 10.2.1. Transportation
- 10.2.2. Building & Construction
- 10.2.3. Electrical & Electronics
- 10.2.4. Wind Energy
- 10.2.5. Others
- 10.1. Market Analysis, Insights and Forecast - by Fiber Type
- 11. Asia Pacific Polyurethane Composites Market Analysis, Insights and Forecast, 2019-2031
- 11.1. Market Analysis, Insights and Forecast - By Country/Sub-region
- 11.1.1 China
- 11.1.2 India
- 11.1.3 Japan
- 11.1.4 South Korea
- 11.1.5 Rest of Asia Pacific
- 12. North America Polyurethane Composites Market Analysis, Insights and Forecast, 2019-2031
- 12.1. Market Analysis, Insights and Forecast - By Country/Sub-region
- 12.1.1 United States
- 12.1.2 Canada
- 12.1.3 Mexico
- 13. Europe Polyurethane Composites Market Analysis, Insights and Forecast, 2019-2031
- 13.1. Market Analysis, Insights and Forecast - By Country/Sub-region
- 13.1.1 Germany
- 13.1.2 United Kingdom
- 13.1.3 Italy
- 13.1.4 France
- 13.1.5 Rest of Europe
- 14. South America Polyurethane Composites Market Analysis, Insights and Forecast, 2019-2031
- 14.1. Market Analysis, Insights and Forecast - By Country/Sub-region
- 14.1.1 Brazil
- 14.1.2 Argentina
- 14.1.3 Rest of South America
- 15. Middle East and Africa Polyurethane Composites Market Analysis, Insights and Forecast, 2019-2031
- 15.1. Market Analysis, Insights and Forecast - By Country/Sub-region
- 15.1.1 Saudi Arabia
- 15.1.2 South Africa
- 15.1.3 Rest of Middle East and Africa
- 16. Competitive Analysis
- 16.1. Global Market Share Analysis 2024
- 16.2. Company Profiles
- 16.2.1 ELANTAS
- 16.2.1.1. Overview
- 16.2.1.2. Products
- 16.2.1.3. SWOT Analysis
- 16.2.1.4. Recent Developments
- 16.2.1.5. Financials (Based on Availability)
- 16.2.2 BASF SE
- 16.2.2.1. Overview
- 16.2.2.2. Products
- 16.2.2.3. SWOT Analysis
- 16.2.2.4. Recent Developments
- 16.2.2.5. Financials (Based on Availability)
- 16.2.3 Huntsman International LLC
- 16.2.3.1. Overview
- 16.2.3.2. Products
- 16.2.3.3. SWOT Analysis
- 16.2.3.4. Recent Developments
- 16.2.3.5. Financials (Based on Availability)
- 16.2.4 Linecross
- 16.2.4.1. Overview
- 16.2.4.2. Products
- 16.2.4.3. SWOT Analysis
- 16.2.4.4. Recent Developments
- 16.2.4.5. Financials (Based on Availability)
- 16.2.5 Webasto Group
- 16.2.5.1. Overview
- 16.2.5.2. Products
- 16.2.5.3. SWOT Analysis
- 16.2.5.4. Recent Developments
- 16.2.5.5. Financials (Based on Availability)
- 16.2.6 Henkel Corporation
- 16.2.6.1. Overview
- 16.2.6.2. Products
- 16.2.6.3. SWOT Analysis
- 16.2.6.4. Recent Developments
- 16.2.6.5. Financials (Based on Availability)
- 16.2.7 Covestro AG
- 16.2.7.1. Overview
- 16.2.7.2. Products
- 16.2.7.3. SWOT Analysis
- 16.2.7.4. Recent Developments
- 16.2.7.5. Financials (Based on Availability)
- 16.2.1 ELANTAS
List of Figures
- Figure 1: Global Polyurethane Composites Market Revenue Breakdown (Million, %) by Region 2024 & 2032
- Figure 2: Global Polyurethane Composites Market Volume Breakdown (grams per cubic centimeter , %) by Region 2024 & 2032
- Figure 3: Asia Pacific Polyurethane Composites Market Revenue (Million), by Country 2024 & 2032
- Figure 4: Asia Pacific Polyurethane Composites Market Volume (grams per cubic centimeter ), by Country 2024 & 2032
- Figure 5: Asia Pacific Polyurethane Composites Market Revenue Share (%), by Country 2024 & 2032
- Figure 6: Asia Pacific Polyurethane Composites Market Volume Share (%), by Country 2024 & 2032
- Figure 7: North America Polyurethane Composites Market Revenue (Million), by Country 2024 & 2032
- Figure 8: North America Polyurethane Composites Market Volume (grams per cubic centimeter ), by Country 2024 & 2032
- Figure 9: North America Polyurethane Composites Market Revenue Share (%), by Country 2024 & 2032
- Figure 10: North America Polyurethane Composites Market Volume Share (%), by Country 2024 & 2032
- Figure 11: Europe Polyurethane Composites Market Revenue (Million), by Country 2024 & 2032
- Figure 12: Europe Polyurethane Composites Market Volume (grams per cubic centimeter ), by Country 2024 & 2032
- Figure 13: Europe Polyurethane Composites Market Revenue Share (%), by Country 2024 & 2032
- Figure 14: Europe Polyurethane Composites Market Volume Share (%), by Country 2024 & 2032
- Figure 15: South America Polyurethane Composites Market Revenue (Million), by Country 2024 & 2032
- Figure 16: South America Polyurethane Composites Market Volume (grams per cubic centimeter ), by Country 2024 & 2032
- Figure 17: South America Polyurethane Composites Market Revenue Share (%), by Country 2024 & 2032
- Figure 18: South America Polyurethane Composites Market Volume Share (%), by Country 2024 & 2032
- Figure 19: Middle East and Africa Polyurethane Composites Market Revenue (Million), by Country 2024 & 2032
- Figure 20: Middle East and Africa Polyurethane Composites Market Volume (grams per cubic centimeter ), by Country 2024 & 2032
- Figure 21: Middle East and Africa Polyurethane Composites Market Revenue Share (%), by Country 2024 & 2032
- Figure 22: Middle East and Africa Polyurethane Composites Market Volume Share (%), by Country 2024 & 2032
- Figure 23: Asia Pacific Polyurethane Composites Market Revenue (Million), by Fiber Type 2024 & 2032
- Figure 24: Asia Pacific Polyurethane Composites Market Volume (grams per cubic centimeter ), by Fiber Type 2024 & 2032
- Figure 25: Asia Pacific Polyurethane Composites Market Revenue Share (%), by Fiber Type 2024 & 2032
- Figure 26: Asia Pacific Polyurethane Composites Market Volume Share (%), by Fiber Type 2024 & 2032
- Figure 27: Asia Pacific Polyurethane Composites Market Revenue (Million), by End-user Industry 2024 & 2032
- Figure 28: Asia Pacific Polyurethane Composites Market Volume (grams per cubic centimeter ), by End-user Industry 2024 & 2032
- Figure 29: Asia Pacific Polyurethane Composites Market Revenue Share (%), by End-user Industry 2024 & 2032
- Figure 30: Asia Pacific Polyurethane Composites Market Volume Share (%), by End-user Industry 2024 & 2032
- Figure 31: Asia Pacific Polyurethane Composites Market Revenue (Million), by Country 2024 & 2032
- Figure 32: Asia Pacific Polyurethane Composites Market Volume (grams per cubic centimeter ), by Country 2024 & 2032
- Figure 33: Asia Pacific Polyurethane Composites Market Revenue Share (%), by Country 2024 & 2032
- Figure 34: Asia Pacific Polyurethane Composites Market Volume Share (%), by Country 2024 & 2032
- Figure 35: North America Polyurethane Composites Market Revenue (Million), by Fiber Type 2024 & 2032
- Figure 36: North America Polyurethane Composites Market Volume (grams per cubic centimeter ), by Fiber Type 2024 & 2032
- Figure 37: North America Polyurethane Composites Market Revenue Share (%), by Fiber Type 2024 & 2032
- Figure 38: North America Polyurethane Composites Market Volume Share (%), by Fiber Type 2024 & 2032
- Figure 39: North America Polyurethane Composites Market Revenue (Million), by End-user Industry 2024 & 2032
- Figure 40: North America Polyurethane Composites Market Volume (grams per cubic centimeter ), by End-user Industry 2024 & 2032
- Figure 41: North America Polyurethane Composites Market Revenue Share (%), by End-user Industry 2024 & 2032
- Figure 42: North America Polyurethane Composites Market Volume Share (%), by End-user Industry 2024 & 2032
- Figure 43: North America Polyurethane Composites Market Revenue (Million), by Country 2024 & 2032
- Figure 44: North America Polyurethane Composites Market Volume (grams per cubic centimeter ), by Country 2024 & 2032
- Figure 45: North America Polyurethane Composites Market Revenue Share (%), by Country 2024 & 2032
- Figure 46: North America Polyurethane Composites Market Volume Share (%), by Country 2024 & 2032
- Figure 47: Europe Polyurethane Composites Market Revenue (Million), by Fiber Type 2024 & 2032
- Figure 48: Europe Polyurethane Composites Market Volume (grams per cubic centimeter ), by Fiber Type 2024 & 2032
- Figure 49: Europe Polyurethane Composites Market Revenue Share (%), by Fiber Type 2024 & 2032
- Figure 50: Europe Polyurethane Composites Market Volume Share (%), by Fiber Type 2024 & 2032
- Figure 51: Europe Polyurethane Composites Market Revenue (Million), by End-user Industry 2024 & 2032
- Figure 52: Europe Polyurethane Composites Market Volume (grams per cubic centimeter ), by End-user Industry 2024 & 2032
- Figure 53: Europe Polyurethane Composites Market Revenue Share (%), by End-user Industry 2024 & 2032
- Figure 54: Europe Polyurethane Composites Market Volume Share (%), by End-user Industry 2024 & 2032
- Figure 55: Europe Polyurethane Composites Market Revenue (Million), by Country 2024 & 2032
- Figure 56: Europe Polyurethane Composites Market Volume (grams per cubic centimeter ), by Country 2024 & 2032
- Figure 57: Europe Polyurethane Composites Market Revenue Share (%), by Country 2024 & 2032
- Figure 58: Europe Polyurethane Composites Market Volume Share (%), by Country 2024 & 2032
- Figure 59: South America Polyurethane Composites Market Revenue (Million), by Fiber Type 2024 & 2032
- Figure 60: South America Polyurethane Composites Market Volume (grams per cubic centimeter ), by Fiber Type 2024 & 2032
- Figure 61: South America Polyurethane Composites Market Revenue Share (%), by Fiber Type 2024 & 2032
- Figure 62: South America Polyurethane Composites Market Volume Share (%), by Fiber Type 2024 & 2032
- Figure 63: South America Polyurethane Composites Market Revenue (Million), by End-user Industry 2024 & 2032
- Figure 64: South America Polyurethane Composites Market Volume (grams per cubic centimeter ), by End-user Industry 2024 & 2032
- Figure 65: South America Polyurethane Composites Market Revenue Share (%), by End-user Industry 2024 & 2032
- Figure 66: South America Polyurethane Composites Market Volume Share (%), by End-user Industry 2024 & 2032
- Figure 67: South America Polyurethane Composites Market Revenue (Million), by Country 2024 & 2032
- Figure 68: South America Polyurethane Composites Market Volume (grams per cubic centimeter ), by Country 2024 & 2032
- Figure 69: South America Polyurethane Composites Market Revenue Share (%), by Country 2024 & 2032
- Figure 70: South America Polyurethane Composites Market Volume Share (%), by Country 2024 & 2032
- Figure 71: Middle East and Africa Polyurethane Composites Market Revenue (Million), by Fiber Type 2024 & 2032
- Figure 72: Middle East and Africa Polyurethane Composites Market Volume (grams per cubic centimeter ), by Fiber Type 2024 & 2032
- Figure 73: Middle East and Africa Polyurethane Composites Market Revenue Share (%), by Fiber Type 2024 & 2032
- Figure 74: Middle East and Africa Polyurethane Composites Market Volume Share (%), by Fiber Type 2024 & 2032
- Figure 75: Middle East and Africa Polyurethane Composites Market Revenue (Million), by End-user Industry 2024 & 2032
- Figure 76: Middle East and Africa Polyurethane Composites Market Volume (grams per cubic centimeter ), by End-user Industry 2024 & 2032
- Figure 77: Middle East and Africa Polyurethane Composites Market Revenue Share (%), by End-user Industry 2024 & 2032
- Figure 78: Middle East and Africa Polyurethane Composites Market Volume Share (%), by End-user Industry 2024 & 2032
- Figure 79: Middle East and Africa Polyurethane Composites Market Revenue (Million), by Country 2024 & 2032
- Figure 80: Middle East and Africa Polyurethane Composites Market Volume (grams per cubic centimeter ), by Country 2024 & 2032
- Figure 81: Middle East and Africa Polyurethane Composites Market Revenue Share (%), by Country 2024 & 2032
- Figure 82: Middle East and Africa Polyurethane Composites Market Volume Share (%), by Country 2024 & 2032
List of Tables
- Table 1: Global Polyurethane Composites Market Revenue Million Forecast, by Region 2019 & 2032
- Table 2: Global Polyurethane Composites Market Volume grams per cubic centimeter Forecast, by Region 2019 & 2032
- Table 3: Global Polyurethane Composites Market Revenue Million Forecast, by Fiber Type 2019 & 2032
- Table 4: Global Polyurethane Composites Market Volume grams per cubic centimeter Forecast, by Fiber Type 2019 & 2032
- Table 5: Global Polyurethane Composites Market Revenue Million Forecast, by End-user Industry 2019 & 2032
- Table 6: Global Polyurethane Composites Market Volume grams per cubic centimeter Forecast, by End-user Industry 2019 & 2032
- Table 7: Global Polyurethane Composites Market Revenue Million Forecast, by Region 2019 & 2032
- Table 8: Global Polyurethane Composites Market Volume grams per cubic centimeter Forecast, by Region 2019 & 2032
- Table 9: Global Polyurethane Composites Market Revenue Million Forecast, by Country 2019 & 2032
- Table 10: Global Polyurethane Composites Market Volume grams per cubic centimeter Forecast, by Country 2019 & 2032
- Table 11: China Polyurethane Composites Market Revenue (Million) Forecast, by Application 2019 & 2032
- Table 12: China Polyurethane Composites Market Volume (grams per cubic centimeter ) Forecast, by Application 2019 & 2032
- Table 13: India Polyurethane Composites Market Revenue (Million) Forecast, by Application 2019 & 2032
- Table 14: India Polyurethane Composites Market Volume (grams per cubic centimeter ) Forecast, by Application 2019 & 2032
- Table 15: Japan Polyurethane Composites Market Revenue (Million) Forecast, by Application 2019 & 2032
- Table 16: Japan Polyurethane Composites Market Volume (grams per cubic centimeter ) Forecast, by Application 2019 & 2032
- Table 17: South Korea Polyurethane Composites Market Revenue (Million) Forecast, by Application 2019 & 2032
- Table 18: South Korea Polyurethane Composites Market Volume (grams per cubic centimeter ) Forecast, by Application 2019 & 2032
- Table 19: Rest of Asia Pacific Polyurethane Composites Market Revenue (Million) Forecast, by Application 2019 & 2032
- Table 20: Rest of Asia Pacific Polyurethane Composites Market Volume (grams per cubic centimeter ) Forecast, by Application 2019 & 2032
- Table 21: Global Polyurethane Composites Market Revenue Million Forecast, by Country 2019 & 2032
- Table 22: Global Polyurethane Composites Market Volume grams per cubic centimeter Forecast, by Country 2019 & 2032
- Table 23: United States Polyurethane Composites Market Revenue (Million) Forecast, by Application 2019 & 2032
- Table 24: United States Polyurethane Composites Market Volume (grams per cubic centimeter ) Forecast, by Application 2019 & 2032
- Table 25: Canada Polyurethane Composites Market Revenue (Million) Forecast, by Application 2019 & 2032
- Table 26: Canada Polyurethane Composites Market Volume (grams per cubic centimeter ) Forecast, by Application 2019 & 2032
- Table 27: Mexico Polyurethane Composites Market Revenue (Million) Forecast, by Application 2019 & 2032
- Table 28: Mexico Polyurethane Composites Market Volume (grams per cubic centimeter ) Forecast, by Application 2019 & 2032
- Table 29: Global Polyurethane Composites Market Revenue Million Forecast, by Country 2019 & 2032
- Table 30: Global Polyurethane Composites Market Volume grams per cubic centimeter Forecast, by Country 2019 & 2032
- Table 31: Germany Polyurethane Composites Market Revenue (Million) Forecast, by Application 2019 & 2032
- Table 32: Germany Polyurethane Composites Market Volume (grams per cubic centimeter ) Forecast, by Application 2019 & 2032
- Table 33: United Kingdom Polyurethane Composites Market Revenue (Million) Forecast, by Application 2019 & 2032
- Table 34: United Kingdom Polyurethane Composites Market Volume (grams per cubic centimeter ) Forecast, by Application 2019 & 2032
- Table 35: Italy Polyurethane Composites Market Revenue (Million) Forecast, by Application 2019 & 2032
- Table 36: Italy Polyurethane Composites Market Volume (grams per cubic centimeter ) Forecast, by Application 2019 & 2032
- Table 37: France Polyurethane Composites Market Revenue (Million) Forecast, by Application 2019 & 2032
- Table 38: France Polyurethane Composites Market Volume (grams per cubic centimeter ) Forecast, by Application 2019 & 2032
- Table 39: Rest of Europe Polyurethane Composites Market Revenue (Million) Forecast, by Application 2019 & 2032
- Table 40: Rest of Europe Polyurethane Composites Market Volume (grams per cubic centimeter ) Forecast, by Application 2019 & 2032
- Table 41: Global Polyurethane Composites Market Revenue Million Forecast, by Country 2019 & 2032
- Table 42: Global Polyurethane Composites Market Volume grams per cubic centimeter Forecast, by Country 2019 & 2032
- Table 43: Brazil Polyurethane Composites Market Revenue (Million) Forecast, by Application 2019 & 2032
- Table 44: Brazil Polyurethane Composites Market Volume (grams per cubic centimeter ) Forecast, by Application 2019 & 2032
- Table 45: Argentina Polyurethane Composites Market Revenue (Million) Forecast, by Application 2019 & 2032
- Table 46: Argentina Polyurethane Composites Market Volume (grams per cubic centimeter ) Forecast, by Application 2019 & 2032
- Table 47: Rest of South America Polyurethane Composites Market Revenue (Million) Forecast, by Application 2019 & 2032
- Table 48: Rest of South America Polyurethane Composites Market Volume (grams per cubic centimeter ) Forecast, by Application 2019 & 2032
- Table 49: Global Polyurethane Composites Market Revenue Million Forecast, by Country 2019 & 2032
- Table 50: Global Polyurethane Composites Market Volume grams per cubic centimeter Forecast, by Country 2019 & 2032
- Table 51: Saudi Arabia Polyurethane Composites Market Revenue (Million) Forecast, by Application 2019 & 2032
- Table 52: Saudi Arabia Polyurethane Composites Market Volume (grams per cubic centimeter ) Forecast, by Application 2019 & 2032
- Table 53: South Africa Polyurethane Composites Market Revenue (Million) Forecast, by Application 2019 & 2032
- Table 54: South Africa Polyurethane Composites Market Volume (grams per cubic centimeter ) Forecast, by Application 2019 & 2032
- Table 55: Rest of Middle East and Africa Polyurethane Composites Market Revenue (Million) Forecast, by Application 2019 & 2032
- Table 56: Rest of Middle East and Africa Polyurethane Composites Market Volume (grams per cubic centimeter ) Forecast, by Application 2019 & 2032
- Table 57: Global Polyurethane Composites Market Revenue Million Forecast, by Fiber Type 2019 & 2032
- Table 58: Global Polyurethane Composites Market Volume grams per cubic centimeter Forecast, by Fiber Type 2019 & 2032
- Table 59: Global Polyurethane Composites Market Revenue Million Forecast, by End-user Industry 2019 & 2032
- Table 60: Global Polyurethane Composites Market Volume grams per cubic centimeter Forecast, by End-user Industry 2019 & 2032
- Table 61: Global Polyurethane Composites Market Revenue Million Forecast, by Country 2019 & 2032
- Table 62: Global Polyurethane Composites Market Volume grams per cubic centimeter Forecast, by Country 2019 & 2032
- Table 63: China Polyurethane Composites Market Revenue (Million) Forecast, by Application 2019 & 2032
- Table 64: China Polyurethane Composites Market Volume (grams per cubic centimeter ) Forecast, by Application 2019 & 2032
- Table 65: India Polyurethane Composites Market Revenue (Million) Forecast, by Application 2019 & 2032
- Table 66: India Polyurethane Composites Market Volume (grams per cubic centimeter ) Forecast, by Application 2019 & 2032
- Table 67: Japan Polyurethane Composites Market Revenue (Million) Forecast, by Application 2019 & 2032
- Table 68: Japan Polyurethane Composites Market Volume (grams per cubic centimeter ) Forecast, by Application 2019 & 2032
- Table 69: South Korea Polyurethane Composites Market Revenue (Million) Forecast, by Application 2019 & 2032
- Table 70: South Korea Polyurethane Composites Market Volume (grams per cubic centimeter ) Forecast, by Application 2019 & 2032
- Table 71: Rest of Asia Pacific Polyurethane Composites Market Revenue (Million) Forecast, by Application 2019 & 2032
- Table 72: Rest of Asia Pacific Polyurethane Composites Market Volume (grams per cubic centimeter ) Forecast, by Application 2019 & 2032
- Table 73: Global Polyurethane Composites Market Revenue Million Forecast, by Fiber Type 2019 & 2032
- Table 74: Global Polyurethane Composites Market Volume grams per cubic centimeter Forecast, by Fiber Type 2019 & 2032
- Table 75: Global Polyurethane Composites Market Revenue Million Forecast, by End-user Industry 2019 & 2032
- Table 76: Global Polyurethane Composites Market Volume grams per cubic centimeter Forecast, by End-user Industry 2019 & 2032
- Table 77: Global Polyurethane Composites Market Revenue Million Forecast, by Country 2019 & 2032
- Table 78: Global Polyurethane Composites Market Volume grams per cubic centimeter Forecast, by Country 2019 & 2032
- Table 79: United States Polyurethane Composites Market Revenue (Million) Forecast, by Application 2019 & 2032
- Table 80: United States Polyurethane Composites Market Volume (grams per cubic centimeter ) Forecast, by Application 2019 & 2032
- Table 81: Canada Polyurethane Composites Market Revenue (Million) Forecast, by Application 2019 & 2032
- Table 82: Canada Polyurethane Composites Market Volume (grams per cubic centimeter ) Forecast, by Application 2019 & 2032
- Table 83: Mexico Polyurethane Composites Market Revenue (Million) Forecast, by Application 2019 & 2032
- Table 84: Mexico Polyurethane Composites Market Volume (grams per cubic centimeter ) Forecast, by Application 2019 & 2032
- Table 85: Global Polyurethane Composites Market Revenue Million Forecast, by Fiber Type 2019 & 2032
- Table 86: Global Polyurethane Composites Market Volume grams per cubic centimeter Forecast, by Fiber Type 2019 & 2032
- Table 87: Global Polyurethane Composites Market Revenue Million Forecast, by End-user Industry 2019 & 2032
- Table 88: Global Polyurethane Composites Market Volume grams per cubic centimeter Forecast, by End-user Industry 2019 & 2032
- Table 89: Global Polyurethane Composites Market Revenue Million Forecast, by Country 2019 & 2032
- Table 90: Global Polyurethane Composites Market Volume grams per cubic centimeter Forecast, by Country 2019 & 2032
- Table 91: Germany Polyurethane Composites Market Revenue (Million) Forecast, by Application 2019 & 2032
- Table 92: Germany Polyurethane Composites Market Volume (grams per cubic centimeter ) Forecast, by Application 2019 & 2032
- Table 93: United Kingdom Polyurethane Composites Market Revenue (Million) Forecast, by Application 2019 & 2032
- Table 94: United Kingdom Polyurethane Composites Market Volume (grams per cubic centimeter ) Forecast, by Application 2019 & 2032
- Table 95: Italy Polyurethane Composites Market Revenue (Million) Forecast, by Application 2019 & 2032
- Table 96: Italy Polyurethane Composites Market Volume (grams per cubic centimeter ) Forecast, by Application 2019 & 2032
- Table 97: France Polyurethane Composites Market Revenue (Million) Forecast, by Application 2019 & 2032
- Table 98: France Polyurethane Composites Market Volume (grams per cubic centimeter ) Forecast, by Application 2019 & 2032
- Table 99: Rest of Europe Polyurethane Composites Market Revenue (Million) Forecast, by Application 2019 & 2032
- Table 100: Rest of Europe Polyurethane Composites Market Volume (grams per cubic centimeter ) Forecast, by Application 2019 & 2032
- Table 101: Global Polyurethane Composites Market Revenue Million Forecast, by Fiber Type 2019 & 2032
- Table 102: Global Polyurethane Composites Market Volume grams per cubic centimeter Forecast, by Fiber Type 2019 & 2032
- Table 103: Global Polyurethane Composites Market Revenue Million Forecast, by End-user Industry 2019 & 2032
- Table 104: Global Polyurethane Composites Market Volume grams per cubic centimeter Forecast, by End-user Industry 2019 & 2032
- Table 105: Global Polyurethane Composites Market Revenue Million Forecast, by Country 2019 & 2032
- Table 106: Global Polyurethane Composites Market Volume grams per cubic centimeter Forecast, by Country 2019 & 2032
- Table 107: Brazil Polyurethane Composites Market Revenue (Million) Forecast, by Application 2019 & 2032
- Table 108: Brazil Polyurethane Composites Market Volume (grams per cubic centimeter ) Forecast, by Application 2019 & 2032
- Table 109: Argentina Polyurethane Composites Market Revenue (Million) Forecast, by Application 2019 & 2032
- Table 110: Argentina Polyurethane Composites Market Volume (grams per cubic centimeter ) Forecast, by Application 2019 & 2032
- Table 111: Rest of South America Polyurethane Composites Market Revenue (Million) Forecast, by Application 2019 & 2032
- Table 112: Rest of South America Polyurethane Composites Market Volume (grams per cubic centimeter ) Forecast, by Application 2019 & 2032
- Table 113: Global Polyurethane Composites Market Revenue Million Forecast, by Fiber Type 2019 & 2032
- Table 114: Global Polyurethane Composites Market Volume grams per cubic centimeter Forecast, by Fiber Type 2019 & 2032
- Table 115: Global Polyurethane Composites Market Revenue Million Forecast, by End-user Industry 2019 & 2032
- Table 116: Global Polyurethane Composites Market Volume grams per cubic centimeter Forecast, by End-user Industry 2019 & 2032
- Table 117: Global Polyurethane Composites Market Revenue Million Forecast, by Country 2019 & 2032
- Table 118: Global Polyurethane Composites Market Volume grams per cubic centimeter Forecast, by Country 2019 & 2032
- Table 119: Saudi Arabia Polyurethane Composites Market Revenue (Million) Forecast, by Application 2019 & 2032
- Table 120: Saudi Arabia Polyurethane Composites Market Volume (grams per cubic centimeter ) Forecast, by Application 2019 & 2032
- Table 121: South Africa Polyurethane Composites Market Revenue (Million) Forecast, by Application 2019 & 2032
- Table 122: South Africa Polyurethane Composites Market Volume (grams per cubic centimeter ) Forecast, by Application 2019 & 2032
- Table 123: Rest of Middle East and Africa Polyurethane Composites Market Revenue (Million) Forecast, by Application 2019 & 2032
- Table 124: Rest of Middle East and Africa Polyurethane Composites Market Volume (grams per cubic centimeter ) Forecast, by Application 2019 & 2032
Frequently Asked Questions
1. What is the projected Compound Annual Growth Rate (CAGR) of the Polyurethane Composites Market?
The projected CAGR is approximately 4.00%.
2. Which companies are prominent players in the Polyurethane Composites Market?
Key companies in the market include ELANTAS, BASF SE, Huntsman International LLC, Linecross, Webasto Group, Henkel Corporation, Covestro AG.
3. What are the main segments of the Polyurethane Composites Market?
The market segments include Fiber Type, End-user Industry.
4. Can you provide details about the market size?
The market size is estimated to be USD XX Million as of 2022.
5. What are some drivers contributing to market growth?
; Increasing Demand for the Lightweight Materials From the Transportation Industry; Growing Demand from the Building and Construction Industry.
6. What are the notable trends driving market growth?
Increasing demand from the Transportation Industry.
7. Are there any restraints impacting market growth?
; Slowdown in the Global Automotive Production; High Production Costs.
8. Can you provide examples of recent developments in the market?
N/A
9. What pricing options are available for accessing the report?
Pricing options include single-user, multi-user, and enterprise licenses priced at USD 4750, USD 5250, and USD 8750 respectively.
10. Is the market size provided in terms of value or volume?
The market size is provided in terms of value, measured in Million and volume, measured in grams per cubic centimeter .
11. Are there any specific market keywords associated with the report?
Yes, the market keyword associated with the report is "Polyurethane Composites Market," which aids in identifying and referencing the specific market segment covered.
12. How do I determine which pricing option suits my needs best?
The pricing options vary based on user requirements and access needs. Individual users may opt for single-user licenses, while businesses requiring broader access may choose multi-user or enterprise licenses for cost-effective access to the report.
13. Are there any additional resources or data provided in the Polyurethane Composites Market report?
While the report offers comprehensive insights, it's advisable to review the specific contents or supplementary materials provided to ascertain if additional resources or data are available.
14. How can I stay updated on further developments or reports in the Polyurethane Composites Market?
To stay informed about further developments, trends, and reports in the Polyurethane Composites Market, consider subscribing to industry newsletters, following relevant companies and organizations, or regularly checking reputable industry news sources and publications.
Methodology
Step 1 - Identification of Relevant Samples Size from Population Database


Step 2 - Approaches for Defining Global Market Size (Value, Volume* & Price*)

Note*: In applicable scenarios
Step 3 - Data Sources
Primary Research
- Web Analytics
- Survey Reports
- Research Institute
- Latest Research Reports
- Opinion Leaders
Secondary Research
- Annual Reports
- White Paper
- Latest Press Release
- Industry Association
- Paid Database
- Investor Presentations

Step 4 - Data Triangulation
Involves using different sources of information in order to increase the validity of a study
These sources are likely to be stakeholders in a program - participants, other researchers, program staff, other community members, and so on.
Then we put all data in single framework & apply various statistical tools to find out the dynamic on the market.
During the analysis stage, feedback from the stakeholder groups would be compared to determine areas of agreement as well as areas of divergence


