

Key Insights
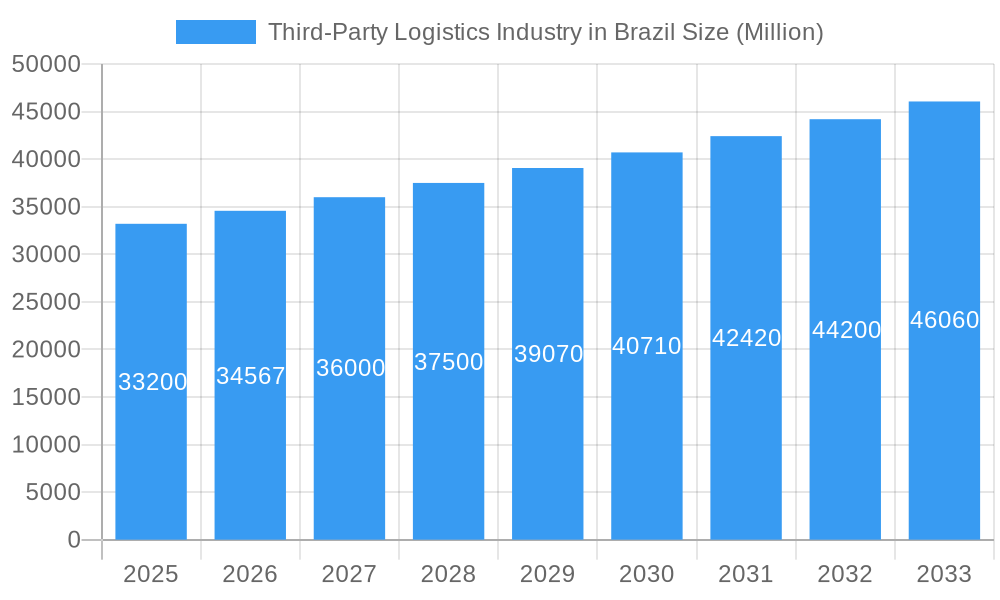
The Brazilian third-party logistics (3PL) market, valued at $33.20 billion in 2025, is experiencing robust growth, projected to expand at a compound annual growth rate (CAGR) of 4.26% from 2025 to 2033. This growth is fueled by several key drivers. The burgeoning e-commerce sector in Brazil necessitates efficient and scalable logistics solutions, significantly boosting demand for 3PL services. Furthermore, increasing globalization and the expansion of international trade are driving the need for robust international transportation management capabilities. The domestic market also benefits from improved infrastructure development, enhancing transportation efficiency and reducing costs. Specific sectors like consumer and retail, automobiles, and life sciences are major contributors to this market expansion due to their increasing reliance on outsourcing logistics functions to focus on core competencies. However, challenges remain, including infrastructure limitations in certain regions and a complex regulatory environment which can impact operational efficiency and cost. The competitive landscape is characterized by a mix of global giants like DB Schenker, Kuehne + Nagel, and FedEx, alongside significant regional players like BBM Logística SA and Gafor SA. This competition ensures a dynamic market with continuous innovation in service offerings and technology adoption.
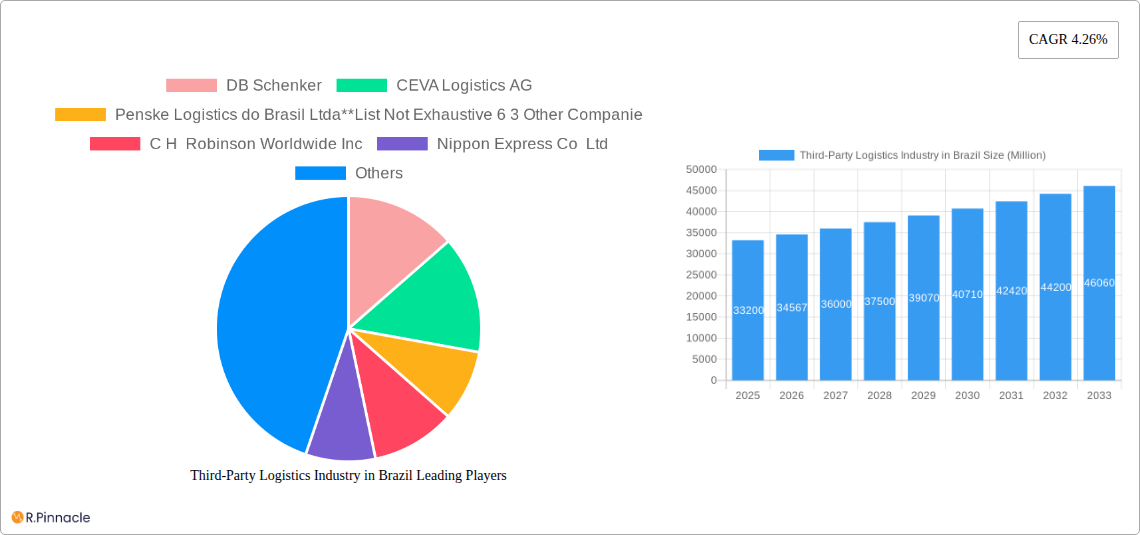
Third-Party Logistics Industry in Brazil Market Size (In Billion)
The segmentation of the Brazilian 3PL market reveals significant opportunities within various service types. Domestic transportation management maintains a leading position, given the size and complexity of the domestic market. However, international transportation management is showing particularly rapid growth, reflecting Brazil's increasing integration into global supply chains. Value-added warehousing and distribution services are also experiencing strong demand, driven by the need for efficient inventory management and customized fulfillment solutions. Across end-user segments, the automotive, chemicals, and consumer and retail sectors are significant drivers of market growth, while the life sciences and healthcare sector shows promising future potential due to the increasing sophistication of their supply chains. Analyzing these trends allows for a comprehensive understanding of current market dynamics and successful strategies for companies operating within the Brazilian 3PL landscape. Future growth will likely be influenced by government initiatives aimed at improving infrastructure, technological advancements in logistics technologies, and evolving consumer expectations regarding speed and transparency in delivery.
Third-Party Logistics Industry in Brazil Company Market Share
Third-Party Logistics (3PL) Industry in Brazil: 2019-2033 Market Report
This comprehensive report provides an in-depth analysis of the burgeoning Third-Party Logistics (3PL) industry in Brazil, covering the period from 2019 to 2033. With a focus on market dynamics, key players, and future trends, this report is an essential resource for industry professionals, investors, and anyone seeking to understand this rapidly evolving sector. The study utilizes data from 2019-2024 as the historical period, 2025 as the base and estimated year, and projects the market outlook until 2033. The Brazilian 3PL market, valued at xx Million in 2025, is poised for significant growth.
Third-Party Logistics Industry in Brazil Market Structure & Innovation Trends
This section analyzes the competitive landscape of the Brazilian 3PL market, focusing on market concentration, innovation drivers, and regulatory aspects. We examine the roles of key players such as DB Schenker, CEVA Logistics AG, Penske Logistics do Brasil Ltda, C H Robinson Worldwide Inc, Nippon Express Co Ltd, Kuehne + Nagel International AG, FedEx, BBM Logística SA, DSV AS, Deutsche Post AG, and Gafor SA, along with 63 other companies. Market share data for prominent players will be presented, highlighting the level of market concentration. The analysis will include the impact of mergers and acquisitions (M&A) activities, quantifying deal values where possible (e.g., xx Million in M&A activity during 2022-2024) and their influence on market structure. Furthermore, the section will explore innovation drivers such as technological advancements, evolving customer demands, and government regulations, examining their impact on the overall market structure. This section delves into the regulatory framework, identifying key regulations and their influence on market participants. Lastly, the report analyzes product substitutes and their market penetration, assessing the competitive pressure they impose on traditional 3PL services.
Third-Party Logistics Industry in Brazil Market Dynamics & Trends
This section examines the driving forces behind the growth of the Brazilian 3PL market. We explore the impact of macroeconomic factors such as GDP growth and industrial output, along with the influence of technological advancements, such as automation and data analytics on supply chain efficiency. Specific market growth drivers include the rising e-commerce sector, the increasing demand for efficient logistics solutions, and the growing adoption of advanced technologies. The analysis includes the compound annual growth rate (CAGR) projections for the forecast period (2025-2033), expecting a CAGR of xx%. We assess consumer preferences and their evolving needs, highlighting the shift towards customized and value-added services. The competitive dynamics are explored, looking at factors such as pricing strategies, service differentiation, and market penetration rates of major players. The report analyzes the impact of technological disruptions on market participants, discussing innovations like blockchain technology and the Internet of Things (IoT). Market penetration rates for key 3PL services, such as domestic and international transportation management, will be provided.
Dominant Regions & Segments in Third-Party Logistics Industry in Brazil
This section identifies the leading regions and segments within the Brazilian 3PL market. The analysis focuses on both service types (Domestic Transportation Management, International Transportation Management, Value-added Warehousing and Distribution) and end-users (Automobile, Chemicals, Consumer and Retail, Energy, Engineering and Manufacturing, Life Science and Healthcare, Other End Users).
- Key Drivers for Dominant Segments:
- Favorable economic policies supporting industrial growth.
- Development of robust transportation infrastructure.
- High concentration of manufacturing and distribution centers.
- Government initiatives promoting logistics efficiency.
The report will conduct a detailed dominance analysis for each leading segment and region, outlining the factors contributing to their success and projected growth rates. The analysis will incorporate data on market size for each segment and region. For instance, the Consumer and Retail segment is expected to dominate due to the expansion of e-commerce, while the Southeast region might lead due to its concentration of industries and infrastructure.
Third-Party Logistics Industry in Brazil Product Innovations
This section will highlight recent product developments and technological advancements in the Brazilian 3PL sector. It will discuss the applications of new technologies, such as AI-powered route optimization and real-time tracking systems, and analyze their impact on enhancing operational efficiency and customer service. The section emphasizes how these innovations provide competitive advantages to 3PL providers and discusses their market fit in the context of the evolving needs of Brazilian businesses.
Report Scope & Segmentation Analysis
This report segments the Brazilian 3PL market by services (Domestic Transportation Management, International Transportation Management, Value-added Warehousing and Distribution) and by end-user (Automobile, Chemicals, Consumer and Retail, Energy, Engineering and Manufacturing, Life Science and Healthcare, Other End Users). Each segment’s market size, growth projections for the forecast period (2025-2033), and competitive dynamics will be thoroughly examined. For instance, the report will provide the projected market size for Domestic Transportation Management in 2033 (xx Million) and outline the competitive landscape for this segment.
Key Drivers of Third-Party Logistics Industry in Brazil Growth
The growth of the Brazilian 3PL market is propelled by several key factors. Technological advancements, such as automation and digitalization, are improving efficiency and reducing costs. Economic growth and increased industrial output fuel the demand for efficient logistics solutions. Furthermore, government initiatives to improve infrastructure and streamline regulations contribute to market expansion. The rising e-commerce sector is also a crucial driver, creating a significant demand for last-mile delivery services.
Challenges in the Third-Party Logistics Industry in Brazil Sector
The Brazilian 3PL sector faces several challenges. Bureaucratic hurdles and regulatory complexities create operational inefficiencies and increase costs. Infrastructure limitations, such as inadequate road networks and port congestion, hinder the smooth flow of goods. Furthermore, intense competition among 3PL providers puts downward pressure on pricing, impacting profitability. These challenges result in a xx% increase in operational costs for some 3PLs in 2024.
Emerging Opportunities in Third-Party Logistics Industry in Brazil
Several opportunities exist for growth in the Brazilian 3PL market. The expansion of e-commerce creates demand for specialized last-mile delivery services and efficient warehouse management solutions. The adoption of innovative technologies, such as blockchain and IoT, offers opportunities for improving supply chain transparency and security. Furthermore, the growing focus on sustainability opens avenues for green logistics solutions. These opportunities represent a potential market expansion of xx Million by 2033.
Leading Players in the Third-Party Logistics Industry in Brazil Market
- DB Schenker
- CEVA Logistics AG
- Penske Logistics do Brasil Ltda
- C H Robinson Worldwide Inc
- Nippon Express Co Ltd
- Kuehne + Nagel International AG
- FedEx
- BBM Logística SA
- DSV AS
- Deutsche Post AG
- Gafor SA
- 63 Other Companies
Key Developments in Third-Party Logistics Industry in Brazil Industry
- 2022 Q4: Launch of a new automated warehouse management system by a major 3PL provider, improving efficiency by xx%.
- 2023 Q1: Acquisition of a regional 3PL company by a multinational logistics firm, expanding market share in the Northeast region.
- 2024 Q3: Implementation of a new government regulation impacting cross-border transportation, causing a xx% increase in administrative costs for some companies.
Future Outlook for Third-Party Logistics Industry in Brazil Market
The Brazilian 3PL market is poised for continued growth driven by e-commerce expansion, technological advancements, and government initiatives. The focus on sustainability and the adoption of innovative logistics solutions will shape the future of the industry. Strategic partnerships, investments in technology, and expansion into new markets will be crucial for success in this dynamic sector. The market is expected to reach xx Million by 2033, presenting significant opportunities for both established players and new entrants.
Third-Party Logistics Industry in Brazil Segmentation
-
1. Services
- 1.1. Domestic Transportation Management
- 1.2. International Transportation Management
- 1.3. Value-added Warehousing and Distribution
-
2. End User
- 2.1. Automobile
- 2.2. Chemicals
- 2.3. Consumer and Retail
- 2.4. Energy
- 2.5. Engineering and Manufacturing
- 2.6. Life Science and Healthcare
- 2.7. Other End User
Third-Party Logistics Industry in Brazil Segmentation By Geography
-
1. North America
- 1.1. United States
- 1.2. Canada
- 1.3. Mexico
-
2. South America
- 2.1. Brazil
- 2.2. Argentina
- 2.3. Rest of South America
-
3. Europe
- 3.1. United Kingdom
- 3.2. Germany
- 3.3. France
- 3.4. Italy
- 3.5. Spain
- 3.6. Russia
- 3.7. Benelux
- 3.8. Nordics
- 3.9. Rest of Europe
-
4. Middle East & Africa
- 4.1. Turkey
- 4.2. Israel
- 4.3. GCC
- 4.4. North Africa
- 4.5. South Africa
- 4.6. Rest of Middle East & Africa
-
5. Asia Pacific
- 5.1. China
- 5.2. India
- 5.3. Japan
- 5.4. South Korea
- 5.5. ASEAN
- 5.6. Oceania
- 5.7. Rest of Asia Pacific
Third-Party Logistics Industry in Brazil Regional Market Share
Geographic Coverage of Third-Party Logistics Industry in Brazil
Third-Party Logistics Industry in Brazil REPORT HIGHLIGHTS
| Aspects | Details |
|---|---|
| Study Period | 2020-2034 |
| Base Year | 2025 |
| Estimated Year | 2026 |
| Forecast Period | 2026-2034 |
| Historical Period | 2020-2025 |
| Growth Rate | CAGR of 4.26% from 2020-2034 |
| Segmentation |
|
Table of Contents
- 1. Introduction
- 1.1. Research Scope
- 1.2. Market Segmentation
- 1.3. Research Objective
- 1.4. Definitions and Assumptions
- 2. Executive Summary
- 2.1. Market Snapshot
- 3. Market Dynamics
- 3.1. Market Drivers
- 3.2. Market Restrains
- 3.3. Market Trends
- 3.4. Market Opportunities
- 4. Market Factor Analysis
- 4.1. Porters Five Forces
- 4.1.1. Bargaining Power of Suppliers
- 4.1.2. Bargaining Power of Buyers
- 4.1.3. Threat of New Entrants
- 4.1.4. Threat of Substitutes
- 4.1.5. Competitive Rivalry
- 4.2. PESTEL analysis
- 4.3. BCG Analysis
- 4.3.1. Stars (High Growth, High Market Share)
- 4.3.2. Cash Cows (Low Growth, High Market Share)
- 4.3.3. Question Mark (High Growth, Low Market Share)
- 4.3.4. Dogs (Low Growth, Low Market Share)
- 4.4. Ansoff Matrix Analysis
- 4.5. Supply Chain Analysis
- 4.6. Regulatory Landscape
- 4.7. Current Market Potential and Opportunity Assessment (TAM–SAM–SOM Framework)
- 4.8. PRI Analyst Note
- 4.1. Porters Five Forces
- 5. Market Analysis, Insights and Forecast 2021-2033
- 5.1. Market Analysis, Insights and Forecast - by Services
- 5.1.1. Domestic Transportation Management
- 5.1.2. International Transportation Management
- 5.1.3. Value-added Warehousing and Distribution
- 5.2. Market Analysis, Insights and Forecast - by End User
- 5.2.1. Automobile
- 5.2.2. Chemicals
- 5.2.3. Consumer and Retail
- 5.2.4. Energy
- 5.2.5. Engineering and Manufacturing
- 5.2.6. Life Science and Healthcare
- 5.2.7. Other End User
- 5.3. Market Analysis, Insights and Forecast - by Region
- 5.3.1. North America
- 5.3.2. South America
- 5.3.3. Europe
- 5.3.4. Middle East & Africa
- 5.3.5. Asia Pacific
- 5.1. Market Analysis, Insights and Forecast - by Services
- 6. Global Third-Party Logistics Industry in Brazil Analysis, Insights and Forecast, 2021-2033
- 6.1. Market Analysis, Insights and Forecast - by Services
- 6.1.1. Domestic Transportation Management
- 6.1.2. International Transportation Management
- 6.1.3. Value-added Warehousing and Distribution
- 6.2. Market Analysis, Insights and Forecast - by End User
- 6.2.1. Automobile
- 6.2.2. Chemicals
- 6.2.3. Consumer and Retail
- 6.2.4. Energy
- 6.2.5. Engineering and Manufacturing
- 6.2.6. Life Science and Healthcare
- 6.2.7. Other End User
- 6.1. Market Analysis, Insights and Forecast - by Services
- 7. North America Third-Party Logistics Industry in Brazil Analysis, Insights and Forecast, 2020-2032
- 7.1. Market Analysis, Insights and Forecast - by Services
- 7.1.1. Domestic Transportation Management
- 7.1.2. International Transportation Management
- 7.1.3. Value-added Warehousing and Distribution
- 7.2. Market Analysis, Insights and Forecast - by End User
- 7.2.1. Automobile
- 7.2.2. Chemicals
- 7.2.3. Consumer and Retail
- 7.2.4. Energy
- 7.2.5. Engineering and Manufacturing
- 7.2.6. Life Science and Healthcare
- 7.2.7. Other End User
- 7.1. Market Analysis, Insights and Forecast - by Services
- 8. South America Third-Party Logistics Industry in Brazil Analysis, Insights and Forecast, 2020-2032
- 8.1. Market Analysis, Insights and Forecast - by Services
- 8.1.1. Domestic Transportation Management
- 8.1.2. International Transportation Management
- 8.1.3. Value-added Warehousing and Distribution
- 8.2. Market Analysis, Insights and Forecast - by End User
- 8.2.1. Automobile
- 8.2.2. Chemicals
- 8.2.3. Consumer and Retail
- 8.2.4. Energy
- 8.2.5. Engineering and Manufacturing
- 8.2.6. Life Science and Healthcare
- 8.2.7. Other End User
- 8.1. Market Analysis, Insights and Forecast - by Services
- 9. Europe Third-Party Logistics Industry in Brazil Analysis, Insights and Forecast, 2020-2032
- 9.1. Market Analysis, Insights and Forecast - by Services
- 9.1.1. Domestic Transportation Management
- 9.1.2. International Transportation Management
- 9.1.3. Value-added Warehousing and Distribution
- 9.2. Market Analysis, Insights and Forecast - by End User
- 9.2.1. Automobile
- 9.2.2. Chemicals
- 9.2.3. Consumer and Retail
- 9.2.4. Energy
- 9.2.5. Engineering and Manufacturing
- 9.2.6. Life Science and Healthcare
- 9.2.7. Other End User
- 9.1. Market Analysis, Insights and Forecast - by Services
- 10. Middle East & Africa Third-Party Logistics Industry in Brazil Analysis, Insights and Forecast, 2020-2032
- 10.1. Market Analysis, Insights and Forecast - by Services
- 10.1.1. Domestic Transportation Management
- 10.1.2. International Transportation Management
- 10.1.3. Value-added Warehousing and Distribution
- 10.2. Market Analysis, Insights and Forecast - by End User
- 10.2.1. Automobile
- 10.2.2. Chemicals
- 10.2.3. Consumer and Retail
- 10.2.4. Energy
- 10.2.5. Engineering and Manufacturing
- 10.2.6. Life Science and Healthcare
- 10.2.7. Other End User
- 10.1. Market Analysis, Insights and Forecast - by Services
- 11. Asia Pacific Third-Party Logistics Industry in Brazil Analysis, Insights and Forecast, 2020-2032
- 11.1. Market Analysis, Insights and Forecast - by Services
- 11.1.1. Domestic Transportation Management
- 11.1.2. International Transportation Management
- 11.1.3. Value-added Warehousing and Distribution
- 11.2. Market Analysis, Insights and Forecast - by End User
- 11.2.1. Automobile
- 11.2.2. Chemicals
- 11.2.3. Consumer and Retail
- 11.2.4. Energy
- 11.2.5. Engineering and Manufacturing
- 11.2.6. Life Science and Healthcare
- 11.2.7. Other End User
- 11.1. Market Analysis, Insights and Forecast - by Services
- 12. Competitive Analysis
- 12.1. Company Profiles
- 12.1.1 DB Schenker
- 12.1.1.1. Company Overview
- 12.1.1.2. Products
- 12.1.1.3. Company Financials
- 12.1.1.4. SWOT Analysis
- 12.1.2 CEVA Logistics AG
- 12.1.2.1. Company Overview
- 12.1.2.2. Products
- 12.1.2.3. Company Financials
- 12.1.2.4. SWOT Analysis
- 12.1.3 Penske Logistics do Brasil Ltda**List Not Exhaustive 6 3 Other Companie
- 12.1.3.1. Company Overview
- 12.1.3.2. Products
- 12.1.3.3. Company Financials
- 12.1.3.4. SWOT Analysis
- 12.1.4 C H Robinson Worldwide Inc
- 12.1.4.1. Company Overview
- 12.1.4.2. Products
- 12.1.4.3. Company Financials
- 12.1.4.4. SWOT Analysis
- 12.1.5 Nippon Express Co Ltd
- 12.1.5.1. Company Overview
- 12.1.5.2. Products
- 12.1.5.3. Company Financials
- 12.1.5.4. SWOT Analysis
- 12.1.6 Kuehne + Nagel International AG
- 12.1.6.1. Company Overview
- 12.1.6.2. Products
- 12.1.6.3. Company Financials
- 12.1.6.4. SWOT Analysis
- 12.1.7 FedEx
- 12.1.7.1. Company Overview
- 12.1.7.2. Products
- 12.1.7.3. Company Financials
- 12.1.7.4. SWOT Analysis
- 12.1.8 BBM Logística SA
- 12.1.8.1. Company Overview
- 12.1.8.2. Products
- 12.1.8.3. Company Financials
- 12.1.8.4. SWOT Analysis
- 12.1.9 DSV AS
- 12.1.9.1. Company Overview
- 12.1.9.2. Products
- 12.1.9.3. Company Financials
- 12.1.9.4. SWOT Analysis
- 12.1.10 Deutsche Post AG
- 12.1.10.1. Company Overview
- 12.1.10.2. Products
- 12.1.10.3. Company Financials
- 12.1.10.4. SWOT Analysis
- 12.1.11 Gafor SA
- 12.1.11.1. Company Overview
- 12.1.11.2. Products
- 12.1.11.3. Company Financials
- 12.1.11.4. SWOT Analysis
- 12.1.1 DB Schenker
- 12.2. Market Entropy
- 12.2.1 Company's Key Areas Served
- 12.2.2 Recent Developments
- 12.3. Company Market Share Analysis 2025
- 12.3.1 Top 5 Companies Market Share Analysis
- 12.3.2 Top 3 Companies Market Share Analysis
- 12.4. List of Potential Customers
- 13. Research Methodology
List of Figures
- Figure 1: Global Third-Party Logistics Industry in Brazil Revenue Breakdown (Million, %) by Region 2025 & 2033
- Figure 2: North America Third-Party Logistics Industry in Brazil Revenue (Million), by Services 2025 & 2033
- Figure 3: North America Third-Party Logistics Industry in Brazil Revenue Share (%), by Services 2025 & 2033
- Figure 4: North America Third-Party Logistics Industry in Brazil Revenue (Million), by End User 2025 & 2033
- Figure 5: North America Third-Party Logistics Industry in Brazil Revenue Share (%), by End User 2025 & 2033
- Figure 6: North America Third-Party Logistics Industry in Brazil Revenue (Million), by Country 2025 & 2033
- Figure 7: North America Third-Party Logistics Industry in Brazil Revenue Share (%), by Country 2025 & 2033
- Figure 8: South America Third-Party Logistics Industry in Brazil Revenue (Million), by Services 2025 & 2033
- Figure 9: South America Third-Party Logistics Industry in Brazil Revenue Share (%), by Services 2025 & 2033
- Figure 10: South America Third-Party Logistics Industry in Brazil Revenue (Million), by End User 2025 & 2033
- Figure 11: South America Third-Party Logistics Industry in Brazil Revenue Share (%), by End User 2025 & 2033
- Figure 12: South America Third-Party Logistics Industry in Brazil Revenue (Million), by Country 2025 & 2033
- Figure 13: South America Third-Party Logistics Industry in Brazil Revenue Share (%), by Country 2025 & 2033
- Figure 14: Europe Third-Party Logistics Industry in Brazil Revenue (Million), by Services 2025 & 2033
- Figure 15: Europe Third-Party Logistics Industry in Brazil Revenue Share (%), by Services 2025 & 2033
- Figure 16: Europe Third-Party Logistics Industry in Brazil Revenue (Million), by End User 2025 & 2033
- Figure 17: Europe Third-Party Logistics Industry in Brazil Revenue Share (%), by End User 2025 & 2033
- Figure 18: Europe Third-Party Logistics Industry in Brazil Revenue (Million), by Country 2025 & 2033
- Figure 19: Europe Third-Party Logistics Industry in Brazil Revenue Share (%), by Country 2025 & 2033
- Figure 20: Middle East & Africa Third-Party Logistics Industry in Brazil Revenue (Million), by Services 2025 & 2033
- Figure 21: Middle East & Africa Third-Party Logistics Industry in Brazil Revenue Share (%), by Services 2025 & 2033
- Figure 22: Middle East & Africa Third-Party Logistics Industry in Brazil Revenue (Million), by End User 2025 & 2033
- Figure 23: Middle East & Africa Third-Party Logistics Industry in Brazil Revenue Share (%), by End User 2025 & 2033
- Figure 24: Middle East & Africa Third-Party Logistics Industry in Brazil Revenue (Million), by Country 2025 & 2033
- Figure 25: Middle East & Africa Third-Party Logistics Industry in Brazil Revenue Share (%), by Country 2025 & 2033
- Figure 26: Asia Pacific Third-Party Logistics Industry in Brazil Revenue (Million), by Services 2025 & 2033
- Figure 27: Asia Pacific Third-Party Logistics Industry in Brazil Revenue Share (%), by Services 2025 & 2033
- Figure 28: Asia Pacific Third-Party Logistics Industry in Brazil Revenue (Million), by End User 2025 & 2033
- Figure 29: Asia Pacific Third-Party Logistics Industry in Brazil Revenue Share (%), by End User 2025 & 2033
- Figure 30: Asia Pacific Third-Party Logistics Industry in Brazil Revenue (Million), by Country 2025 & 2033
- Figure 31: Asia Pacific Third-Party Logistics Industry in Brazil Revenue Share (%), by Country 2025 & 2033
List of Tables
- Table 1: Global Third-Party Logistics Industry in Brazil Revenue Million Forecast, by Services 2020 & 2033
- Table 2: Global Third-Party Logistics Industry in Brazil Revenue Million Forecast, by End User 2020 & 2033
- Table 3: Global Third-Party Logistics Industry in Brazil Revenue Million Forecast, by Region 2020 & 2033
- Table 4: Global Third-Party Logistics Industry in Brazil Revenue Million Forecast, by Services 2020 & 2033
- Table 5: Global Third-Party Logistics Industry in Brazil Revenue Million Forecast, by End User 2020 & 2033
- Table 6: Global Third-Party Logistics Industry in Brazil Revenue Million Forecast, by Country 2020 & 2033
- Table 7: United States Third-Party Logistics Industry in Brazil Revenue (Million) Forecast, by Application 2020 & 2033
- Table 8: Canada Third-Party Logistics Industry in Brazil Revenue (Million) Forecast, by Application 2020 & 2033
- Table 9: Mexico Third-Party Logistics Industry in Brazil Revenue (Million) Forecast, by Application 2020 & 2033
- Table 10: Global Third-Party Logistics Industry in Brazil Revenue Million Forecast, by Services 2020 & 2033
- Table 11: Global Third-Party Logistics Industry in Brazil Revenue Million Forecast, by End User 2020 & 2033
- Table 12: Global Third-Party Logistics Industry in Brazil Revenue Million Forecast, by Country 2020 & 2033
- Table 13: Brazil Third-Party Logistics Industry in Brazil Revenue (Million) Forecast, by Application 2020 & 2033
- Table 14: Argentina Third-Party Logistics Industry in Brazil Revenue (Million) Forecast, by Application 2020 & 2033
- Table 15: Rest of South America Third-Party Logistics Industry in Brazil Revenue (Million) Forecast, by Application 2020 & 2033
- Table 16: Global Third-Party Logistics Industry in Brazil Revenue Million Forecast, by Services 2020 & 2033
- Table 17: Global Third-Party Logistics Industry in Brazil Revenue Million Forecast, by End User 2020 & 2033
- Table 18: Global Third-Party Logistics Industry in Brazil Revenue Million Forecast, by Country 2020 & 2033
- Table 19: United Kingdom Third-Party Logistics Industry in Brazil Revenue (Million) Forecast, by Application 2020 & 2033
- Table 20: Germany Third-Party Logistics Industry in Brazil Revenue (Million) Forecast, by Application 2020 & 2033
- Table 21: France Third-Party Logistics Industry in Brazil Revenue (Million) Forecast, by Application 2020 & 2033
- Table 22: Italy Third-Party Logistics Industry in Brazil Revenue (Million) Forecast, by Application 2020 & 2033
- Table 23: Spain Third-Party Logistics Industry in Brazil Revenue (Million) Forecast, by Application 2020 & 2033
- Table 24: Russia Third-Party Logistics Industry in Brazil Revenue (Million) Forecast, by Application 2020 & 2033
- Table 25: Benelux Third-Party Logistics Industry in Brazil Revenue (Million) Forecast, by Application 2020 & 2033
- Table 26: Nordics Third-Party Logistics Industry in Brazil Revenue (Million) Forecast, by Application 2020 & 2033
- Table 27: Rest of Europe Third-Party Logistics Industry in Brazil Revenue (Million) Forecast, by Application 2020 & 2033
- Table 28: Global Third-Party Logistics Industry in Brazil Revenue Million Forecast, by Services 2020 & 2033
- Table 29: Global Third-Party Logistics Industry in Brazil Revenue Million Forecast, by End User 2020 & 2033
- Table 30: Global Third-Party Logistics Industry in Brazil Revenue Million Forecast, by Country 2020 & 2033
- Table 31: Turkey Third-Party Logistics Industry in Brazil Revenue (Million) Forecast, by Application 2020 & 2033
- Table 32: Israel Third-Party Logistics Industry in Brazil Revenue (Million) Forecast, by Application 2020 & 2033
- Table 33: GCC Third-Party Logistics Industry in Brazil Revenue (Million) Forecast, by Application 2020 & 2033
- Table 34: North Africa Third-Party Logistics Industry in Brazil Revenue (Million) Forecast, by Application 2020 & 2033
- Table 35: South Africa Third-Party Logistics Industry in Brazil Revenue (Million) Forecast, by Application 2020 & 2033
- Table 36: Rest of Middle East & Africa Third-Party Logistics Industry in Brazil Revenue (Million) Forecast, by Application 2020 & 2033
- Table 37: Global Third-Party Logistics Industry in Brazil Revenue Million Forecast, by Services 2020 & 2033
- Table 38: Global Third-Party Logistics Industry in Brazil Revenue Million Forecast, by End User 2020 & 2033
- Table 39: Global Third-Party Logistics Industry in Brazil Revenue Million Forecast, by Country 2020 & 2033
- Table 40: China Third-Party Logistics Industry in Brazil Revenue (Million) Forecast, by Application 2020 & 2033
- Table 41: India Third-Party Logistics Industry in Brazil Revenue (Million) Forecast, by Application 2020 & 2033
- Table 42: Japan Third-Party Logistics Industry in Brazil Revenue (Million) Forecast, by Application 2020 & 2033
- Table 43: South Korea Third-Party Logistics Industry in Brazil Revenue (Million) Forecast, by Application 2020 & 2033
- Table 44: ASEAN Third-Party Logistics Industry in Brazil Revenue (Million) Forecast, by Application 2020 & 2033
- Table 45: Oceania Third-Party Logistics Industry in Brazil Revenue (Million) Forecast, by Application 2020 & 2033
- Table 46: Rest of Asia Pacific Third-Party Logistics Industry in Brazil Revenue (Million) Forecast, by Application 2020 & 2033
Frequently Asked Questions
1. What is the projected Compound Annual Growth Rate (CAGR) of the Third-Party Logistics Industry in Brazil?
The projected CAGR is approximately 4.26%.
2. Which companies are prominent players in the Third-Party Logistics Industry in Brazil?
Key companies in the market include DB Schenker, CEVA Logistics AG, Penske Logistics do Brasil Ltda**List Not Exhaustive 6 3 Other Companie, C H Robinson Worldwide Inc, Nippon Express Co Ltd, Kuehne + Nagel International AG, FedEx, BBM Logística SA, DSV AS, Deutsche Post AG, Gafor SA.
3. What are the main segments of the Third-Party Logistics Industry in Brazil?
The market segments include Services, End User.
4. Can you provide details about the market size?
The market size is estimated to be USD 33.20 Million as of 2022.
5. What are some drivers contributing to market growth?
E-commerce Fueling the Growth of 3PL Market.
6. What are the notable trends driving market growth?
Increasing Freight Trucking is Driving Market Growth.
7. Are there any restraints impacting market growth?
Slow Infrastructure Development.
8. Can you provide examples of recent developments in the market?
N/A
9. What pricing options are available for accessing the report?
Pricing options include single-user, multi-user, and enterprise licenses priced at USD 3800, USD 4500, and USD 5800 respectively.
10. Is the market size provided in terms of value or volume?
The market size is provided in terms of value, measured in Million.
11. Are there any specific market keywords associated with the report?
Yes, the market keyword associated with the report is "Third-Party Logistics Industry in Brazil," which aids in identifying and referencing the specific market segment covered.
12. How do I determine which pricing option suits my needs best?
The pricing options vary based on user requirements and access needs. Individual users may opt for single-user licenses, while businesses requiring broader access may choose multi-user or enterprise licenses for cost-effective access to the report.
13. Are there any additional resources or data provided in the Third-Party Logistics Industry in Brazil report?
While the report offers comprehensive insights, it's advisable to review the specific contents or supplementary materials provided to ascertain if additional resources or data are available.
14. How can I stay updated on further developments or reports in the Third-Party Logistics Industry in Brazil?
To stay informed about further developments, trends, and reports in the Third-Party Logistics Industry in Brazil, consider subscribing to industry newsletters, following relevant companies and organizations, or regularly checking reputable industry news sources and publications.
Methodology
Step 1 - Identification of Relevant Samples Size from Population Database


Step 2 - Approaches for Defining Global Market Size (Value, Volume* & Price*)

Note*: In applicable scenarios
Step 3 - Data Sources
Primary Research
- Web Analytics
- Survey Reports
- Research Institute
- Latest Research Reports
- Opinion Leaders
Secondary Research
- Annual Reports
- White Paper
- Latest Press Release
- Industry Association
- Paid Database
- Investor Presentations

Step 4 - Data Triangulation
Involves using different sources of information in order to increase the validity of a study
These sources are likely to be stakeholders in a program - participants, other researchers, program staff, other community members, and so on.
Then we put all data in single framework & apply various statistical tools to find out the dynamic on the market.
During the analysis stage, feedback from the stakeholder groups would be compared to determine areas of agreement as well as areas of divergence