
Key Insights
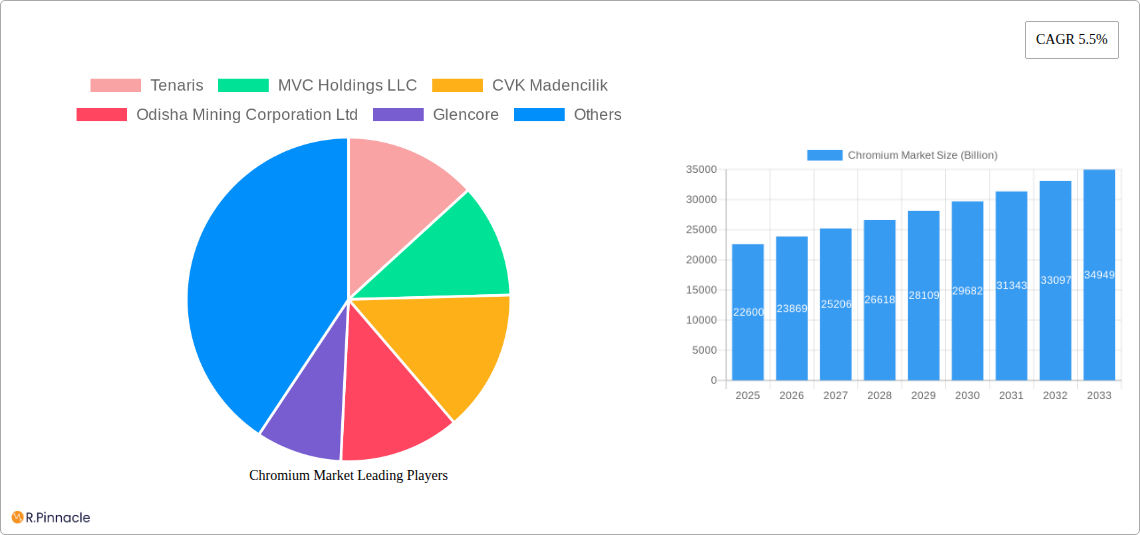
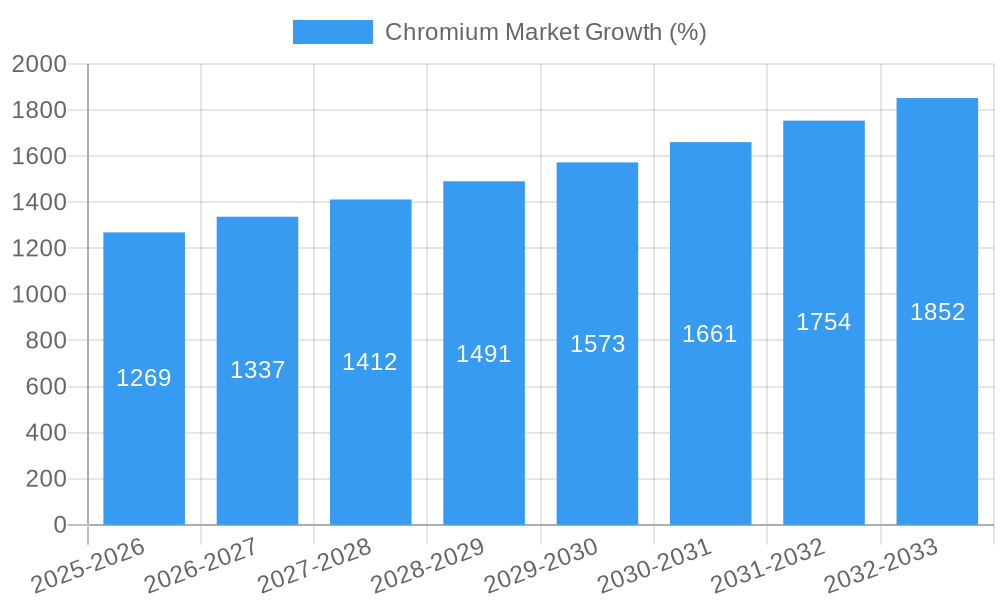
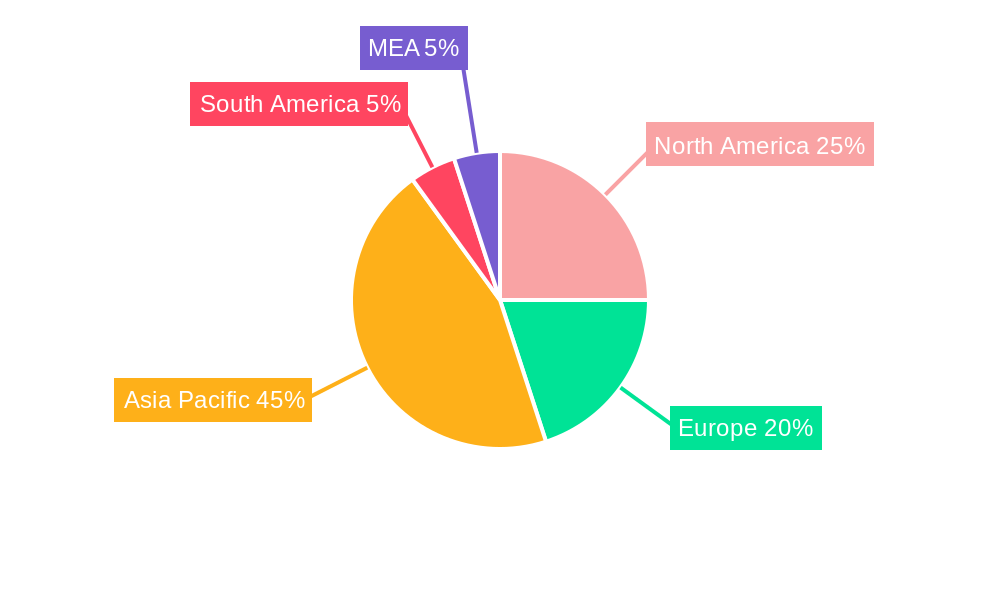
The global chromium market, valued at $22.6 billion in 2025, is projected to experience robust growth, driven by a compound annual growth rate (CAGR) of 5.5% from 2025 to 2033. This expansion is fueled by several key factors. The burgeoning stainless steel industry, a primary consumer of chromium, is a significant driver, with increasing demand from construction, automotive, and consumer goods sectors. Furthermore, the growing use of chromium in the chemical industry as a catalyst and in metallurgical applications for alloying purposes contributes significantly to market growth. The refractory sector also relies heavily on chromium for high-temperature applications. While specific regional breakdowns aren't provided, it's reasonable to expect that regions with significant steel production and industrial activity, such as Asia-Pacific (particularly China and India) and North America, will dominate the market share, followed by Europe. Technological advancements in chromium extraction and processing, aimed at improving efficiency and reducing environmental impact, are also shaping the market landscape. However, price volatility in raw materials and potential environmental concerns related to chromium production pose challenges to sustained growth. The market is fragmented, with several key players – including Tenaris, MVC Holdings LLC, CVK Madencilik, and Glencore – competing for market share. The diverse applications of chromium across various sectors ensures the long-term viability and potential for continued expansion of this market.
The forecast period of 2025-2033 anticipates continued growth, influenced by expanding industrialization globally and the ongoing demand for stainless steel. The segmentation by application (chemical, metallurgical, refractory, and others) provides further insight into the market's diverse structure. While the "Other Applications" segment, encompassing glass polishing, industrial catalysts, and pigments, might represent a smaller portion currently, its growth potential should not be underestimated. Future market trends will likely focus on sustainability and the development of more environmentally friendly chromium production and utilization methods. Competition among existing players and potential new entrants will continue to shape the market dynamics, emphasizing the need for innovation and strategic partnerships.
Chromium Market Report: A Comprehensive Analysis (2019-2033)
This in-depth report provides a comprehensive analysis of the global Chromium Market, projecting a market valuation exceeding Billion USD by 2033. It offers actionable insights for industry professionals, investors, and strategic decision-makers, covering market dynamics, competitive landscape, and future growth opportunities. The report uses 2025 as the base year, with historical data spanning 2019-2024 and a forecast period of 2025-2033.
Chromium Market Market Structure & Innovation Trends
This section analyzes the structure of the Chromium market, focusing on concentration, innovation, regulatory aspects, and M&A activity. The market exhibits a moderately concentrated structure, with key players holding significant market shares. Several factors drive innovation, including the increasing demand for high-performance alloys and the need for sustainable production methods. Stringent environmental regulations are shaping the industry, pushing companies to adopt cleaner technologies. Product substitutes, like alternative alloys, pose a competitive threat, but chromium’s unique properties maintain its dominance in several applications.
- Market Concentration: The top 5 players hold an estimated xx% market share.
- Innovation Drivers: Demand for high-performance alloys, sustainable production, and stringent environmental regulations.
- Regulatory Framework: Emission standards and waste management regulations significantly impact operational costs and strategies.
- Product Substitutes: Alternative alloys are emerging, but chromium's unique properties maintain its relevance.
- End-User Demographics: Key end-users are concentrated in the chemical, metallurgical, and refractory industries.
- M&A Activity: Recent years have witnessed significant M&A activity, with deals exceeding Billion USD in value. The acquisition of Elementis plc's chromium business by Yildirim Group highlights this trend.
Chromium Market Market Dynamics & Trends
The Chromium market is experiencing robust growth, driven by the expanding metallurgical and chemical industries. Technological advancements in alloy production and processing are improving efficiency and product quality. Consumer preferences for high-performance materials are boosting demand, while competitive dynamics are leading to continuous innovation and price optimization. The market's CAGR is projected at xx% during the forecast period, indicating substantial market expansion. Market penetration in emerging economies is also expected to increase, further fueling growth.
Dominant Regions & Segments in Chromium Market
The Metallurgical segment dominates the Chromium market due to its widespread use in stainless steel production. Asia-Pacific is the leading region due to its large and rapidly growing steel industry and robust infrastructure development. Key drivers of its dominance include:
- Economic Policies: Government support for infrastructure projects and industrial expansion.
- Infrastructure Development: Rapid urbanization and industrialization drive the demand for steel and related products.
- Cost-Effectiveness: Lower production costs compared to other regions contribute to its competitive advantage.
Other regions, including North America and Europe, also show significant demand, driven by the automotive, aerospace, and chemical sectors. The Chemical segment demonstrates steady growth, fueled by the expanding chemical industry and the increasing demand for chromium compounds in various applications.
Chromium Market Product Innovations
Recent innovations focus on enhancing chromium's properties and expanding its applications. Developments include higher-purity chromium alloys with improved corrosion resistance and specialized coatings for enhanced performance. These innovations cater to the growing demand for advanced materials in high-performance applications, such as aerospace and energy, creating a strong market fit.
Report Scope & Segmentation Analysis
The report segments the Chromium market by application:
- Chemical: This segment is expected to grow at a CAGR of xx%, driven by the increasing demand for chromium compounds in various chemical processes. Competitive dynamics are characterized by pricing pressures and technological advancements.
- Metallurgical: This segment holds the largest market share, with a projected CAGR of xx% due to its crucial role in stainless steel production. Competition is intense, driven by economies of scale and technological innovation.
- Refractory: This segment shows steady growth, driven by the demand for high-temperature materials in industrial furnaces. The market is relatively concentrated, with several key players.
- Other Applications: (Glass polishing, Industrial Catalysts, and Pigments) This segment represents a niche market with a projected CAGR of xx%, driven by specialized applications. Competition is relatively less intense compared to other segments.
Key Drivers of Chromium Market Growth
The Chromium market's growth is primarily driven by the burgeoning stainless steel industry, expanding chemical sector, and increasing demand for high-performance materials in various applications. Technological advancements in alloy production and processing, coupled with supportive government policies promoting industrial development, further accelerate market growth.
Challenges in the Chromium Market Sector
The Chromium market faces challenges like fluctuating raw material prices, environmental concerns related to chromium production and waste management, and intense competition among producers. These factors can impact profitability and sustainability in the long term. Supply chain disruptions due to geopolitical factors also pose a significant challenge.
Emerging Opportunities in Chromium Market
Emerging opportunities include the development of advanced chromium alloys for niche applications such as additive manufacturing and the adoption of circular economy models for sustainable chromium production and recycling. Expansion into emerging markets and the development of innovative applications for chromium compounds present significant potential for future growth.
Leading Players in the Chromium Market Market
- Tenaris
- MVC Holdings LLC
- CVK Madencilik
- Odisha Mining Corporation Ltd
- Glencore
- International Ferro Metals (IFM)
- Al Tamman Indsil FerroChrome L L C
- Kermas Investment Group
- Hernic Ferrochrome (Pty) Ltd (Hernic)
- YILDIRIM Group of Companies
- Assmang Proprietary Limited
Key Developments in Chromium Market Industry
- November 2022: Yildirim Group acquired Elementis plc's chromium business for USD 170 Million, expanding its production capacity significantly.
- June 2022: Tenaris invested USD 29 Million to expand its specialty steel production capacity, increasing the supply of high-chromium steels.
- January 2022: Yildirim Group acquired Albchrome Holding, strengthening its global market position.
Future Outlook for Chromium Market Market
The Chromium market is poised for sustained growth, driven by increasing demand from key industries and technological advancements leading to new applications. Strategic collaborations, investments in sustainable production methods, and expansion into emerging markets will be crucial for future success in this dynamic sector. The market's future outlook is positive, with substantial growth potential in the coming years.
Chromium Market Segmentation
-
1. Application
- 1.1. Chemical
- 1.2. Metallurgical
- 1.3. Refractory
- 1.4. Other Ap
Chromium Market Segmentation By Geography
-
1. Asia Pacific
- 1.1. China
- 1.2. India
- 1.3. Japan
- 1.4. South Korea
- 1.5. Malaysia
- 1.6. Thailand
- 1.7. Indonesia
- 1.8. Vietnam
- 1.9. Rest of Asia Pacific
-
2. North America
- 2.1. United States
- 2.2. Canada
- 2.3. Mexico
-
3. Europe
- 3.1. Germany
- 3.2. United Kingdom
- 3.3. Italy
- 3.4. France
- 3.5. Spain
- 3.6. NORDIC
- 3.7. Turkey
- 3.8. Russia
- 3.9. Rest of Europe
-
4. South America
- 4.1. Brazil
- 4.2. Argentina
- 4.3. Colombia
- 4.4. Rest of South America
-
5. Middle East and Africa
- 5.1. Saudi Arabia
- 5.2. South Africa
- 5.3. Nigeria
- 5.4. Qatar
- 5.5. Egypt
- 5.6. United Arab Emirates
- 5.7. Rest of Middle East and Africa
Chromium Market REPORT HIGHLIGHTS
| Aspects | Details |
|---|---|
| Study Period | 2019-2033 |
| Base Year | 2024 |
| Estimated Year | 2025 |
| Forecast Period | 2025-2033 |
| Historical Period | 2019-2024 |
| Growth Rate | CAGR of 5.5% from 2019-2033 |
| Segmentation |
|
Table of Contents
- 1. Introduction
- 1.1. Research Scope
- 1.2. Market Segmentation
- 1.3. Research Methodology
- 1.4. Definitions and Assumptions
- 2. Executive Summary
- 2.1. Introduction
- 3. Market Dynamics
- 3.1. Introduction
- 3.2. Market Drivers
- 3.2.1. Growing Demand for Metallurgical Uses; Increasing Refractory Applications in Industries; Other Drivers
- 3.3. Market Restrains
- 3.3.1. Associated Health Effects; Other Restraints
- 3.4. Market Trends
- 3.4.1. Metallurgical Applications to Witness Growth in Future
- 4. Market Factor Analysis
- 4.1. Porters Five Forces
- 4.2. Supply/Value Chain
- 4.3. PESTEL analysis
- 4.4. Market Entropy
- 4.5. Patent/Trademark Analysis
- 5. Global Chromium Market Analysis, Insights and Forecast, 2019-2031
- 5.1. Market Analysis, Insights and Forecast - by Application
- 5.1.1. Chemical
- 5.1.2. Metallurgical
- 5.1.3. Refractory
- 5.1.4. Other Ap
- 5.2. Market Analysis, Insights and Forecast - by Region
- 5.2.1. Asia Pacific
- 5.2.2. North America
- 5.2.3. Europe
- 5.2.4. South America
- 5.2.5. Middle East and Africa
- 5.1. Market Analysis, Insights and Forecast - by Application
- 6. Asia Pacific Chromium Market Analysis, Insights and Forecast, 2019-2031
- 6.1. Market Analysis, Insights and Forecast - by Application
- 6.1.1. Chemical
- 6.1.2. Metallurgical
- 6.1.3. Refractory
- 6.1.4. Other Ap
- 6.1. Market Analysis, Insights and Forecast - by Application
- 7. North America Chromium Market Analysis, Insights and Forecast, 2019-2031
- 7.1. Market Analysis, Insights and Forecast - by Application
- 7.1.1. Chemical
- 7.1.2. Metallurgical
- 7.1.3. Refractory
- 7.1.4. Other Ap
- 7.1. Market Analysis, Insights and Forecast - by Application
- 8. Europe Chromium Market Analysis, Insights and Forecast, 2019-2031
- 8.1. Market Analysis, Insights and Forecast - by Application
- 8.1.1. Chemical
- 8.1.2. Metallurgical
- 8.1.3. Refractory
- 8.1.4. Other Ap
- 8.1. Market Analysis, Insights and Forecast - by Application
- 9. South America Chromium Market Analysis, Insights and Forecast, 2019-2031
- 9.1. Market Analysis, Insights and Forecast - by Application
- 9.1.1. Chemical
- 9.1.2. Metallurgical
- 9.1.3. Refractory
- 9.1.4. Other Ap
- 9.1. Market Analysis, Insights and Forecast - by Application
- 10. Middle East and Africa Chromium Market Analysis, Insights and Forecast, 2019-2031
- 10.1. Market Analysis, Insights and Forecast - by Application
- 10.1.1. Chemical
- 10.1.2. Metallurgical
- 10.1.3. Refractory
- 10.1.4. Other Ap
- 10.1. Market Analysis, Insights and Forecast - by Application
- 11. North America Chromium Market Analysis, Insights and Forecast, 2019-2031
- 11.1. Market Analysis, Insights and Forecast - By Country/Sub-region
- 11.1.1 United States
- 11.1.2 Canada
- 11.1.3 Mexico
- 12. Europe Chromium Market Analysis, Insights and Forecast, 2019-2031
- 12.1. Market Analysis, Insights and Forecast - By Country/Sub-region
- 12.1.1 Germany
- 12.1.2 France
- 12.1.3 Italy
- 12.1.4 United Kingdom
- 12.1.5 Netherlands
- 12.1.6 Rest of Europe
- 13. Asia Pacific Chromium Market Analysis, Insights and Forecast, 2019-2031
- 13.1. Market Analysis, Insights and Forecast - By Country/Sub-region
- 13.1.1 China
- 13.1.2 Japan
- 13.1.3 India
- 13.1.4 South Korea
- 13.1.5 Taiwan
- 13.1.6 Australia
- 13.1.7 Rest of Asia-Pacific
- 14. South America Chromium Market Analysis, Insights and Forecast, 2019-2031
- 14.1. Market Analysis, Insights and Forecast - By Country/Sub-region
- 14.1.1 Brazil
- 14.1.2 Argentina
- 14.1.3 Rest of South America
- 15. MEA Chromium Market Analysis, Insights and Forecast, 2019-2031
- 15.1. Market Analysis, Insights and Forecast - By Country/Sub-region
- 15.1.1 Middle East
- 15.1.2 Africa
- 16. Competitive Analysis
- 16.1. Global Market Share Analysis 2024
- 16.2. Company Profiles
- 16.2.1 Tenaris
- 16.2.1.1. Overview
- 16.2.1.2. Products
- 16.2.1.3. SWOT Analysis
- 16.2.1.4. Recent Developments
- 16.2.1.5. Financials (Based on Availability)
- 16.2.2 MVC Holdings LLC
- 16.2.2.1. Overview
- 16.2.2.2. Products
- 16.2.2.3. SWOT Analysis
- 16.2.2.4. Recent Developments
- 16.2.2.5. Financials (Based on Availability)
- 16.2.3 CVK Madencilik
- 16.2.3.1. Overview
- 16.2.3.2. Products
- 16.2.3.3. SWOT Analysis
- 16.2.3.4. Recent Developments
- 16.2.3.5. Financials (Based on Availability)
- 16.2.4 Odisha Mining Corporation Ltd
- 16.2.4.1. Overview
- 16.2.4.2. Products
- 16.2.4.3. SWOT Analysis
- 16.2.4.4. Recent Developments
- 16.2.4.5. Financials (Based on Availability)
- 16.2.5 Glencore
- 16.2.5.1. Overview
- 16.2.5.2. Products
- 16.2.5.3. SWOT Analysis
- 16.2.5.4. Recent Developments
- 16.2.5.5. Financials (Based on Availability)
- 16.2.6 International Ferro Metals (IFM)
- 16.2.6.1. Overview
- 16.2.6.2. Products
- 16.2.6.3. SWOT Analysis
- 16.2.6.4. Recent Developments
- 16.2.6.5. Financials (Based on Availability)
- 16.2.7 Al Tamman Indsil FerroChrome L L C
- 16.2.7.1. Overview
- 16.2.7.2. Products
- 16.2.7.3. SWOT Analysis
- 16.2.7.4. Recent Developments
- 16.2.7.5. Financials (Based on Availability)
- 16.2.8 Kermas Investment Group
- 16.2.8.1. Overview
- 16.2.8.2. Products
- 16.2.8.3. SWOT Analysis
- 16.2.8.4. Recent Developments
- 16.2.8.5. Financials (Based on Availability)
- 16.2.9 Hernic Ferrochrome (Pty) Ltd (Hernic)
- 16.2.9.1. Overview
- 16.2.9.2. Products
- 16.2.9.3. SWOT Analysis
- 16.2.9.4. Recent Developments
- 16.2.9.5. Financials (Based on Availability)
- 16.2.10 YILDIRIM Group of Companies
- 16.2.10.1. Overview
- 16.2.10.2. Products
- 16.2.10.3. SWOT Analysis
- 16.2.10.4. Recent Developments
- 16.2.10.5. Financials (Based on Availability)
- 16.2.11 Assmang Proprietary Limited
- 16.2.11.1. Overview
- 16.2.11.2. Products
- 16.2.11.3. SWOT Analysis
- 16.2.11.4. Recent Developments
- 16.2.11.5. Financials (Based on Availability)
- 16.2.1 Tenaris
List of Figures
- Figure 1: Global Chromium Market Revenue Breakdown (Billion, %) by Region 2024 & 2032
- Figure 2: Global Chromium Market Volume Breakdown (K Tons, %) by Region 2024 & 2032
- Figure 3: North America Chromium Market Revenue (Billion), by Country 2024 & 2032
- Figure 4: North America Chromium Market Volume (K Tons), by Country 2024 & 2032
- Figure 5: North America Chromium Market Revenue Share (%), by Country 2024 & 2032
- Figure 6: North America Chromium Market Volume Share (%), by Country 2024 & 2032
- Figure 7: Europe Chromium Market Revenue (Billion), by Country 2024 & 2032
- Figure 8: Europe Chromium Market Volume (K Tons), by Country 2024 & 2032
- Figure 9: Europe Chromium Market Revenue Share (%), by Country 2024 & 2032
- Figure 10: Europe Chromium Market Volume Share (%), by Country 2024 & 2032
- Figure 11: Asia Pacific Chromium Market Revenue (Billion), by Country 2024 & 2032
- Figure 12: Asia Pacific Chromium Market Volume (K Tons), by Country 2024 & 2032
- Figure 13: Asia Pacific Chromium Market Revenue Share (%), by Country 2024 & 2032
- Figure 14: Asia Pacific Chromium Market Volume Share (%), by Country 2024 & 2032
- Figure 15: South America Chromium Market Revenue (Billion), by Country 2024 & 2032
- Figure 16: South America Chromium Market Volume (K Tons), by Country 2024 & 2032
- Figure 17: South America Chromium Market Revenue Share (%), by Country 2024 & 2032
- Figure 18: South America Chromium Market Volume Share (%), by Country 2024 & 2032
- Figure 19: MEA Chromium Market Revenue (Billion), by Country 2024 & 2032
- Figure 20: MEA Chromium Market Volume (K Tons), by Country 2024 & 2032
- Figure 21: MEA Chromium Market Revenue Share (%), by Country 2024 & 2032
- Figure 22: MEA Chromium Market Volume Share (%), by Country 2024 & 2032
- Figure 23: Asia Pacific Chromium Market Revenue (Billion), by Application 2024 & 2032
- Figure 24: Asia Pacific Chromium Market Volume (K Tons), by Application 2024 & 2032
- Figure 25: Asia Pacific Chromium Market Revenue Share (%), by Application 2024 & 2032
- Figure 26: Asia Pacific Chromium Market Volume Share (%), by Application 2024 & 2032
- Figure 27: Asia Pacific Chromium Market Revenue (Billion), by Country 2024 & 2032
- Figure 28: Asia Pacific Chromium Market Volume (K Tons), by Country 2024 & 2032
- Figure 29: Asia Pacific Chromium Market Revenue Share (%), by Country 2024 & 2032
- Figure 30: Asia Pacific Chromium Market Volume Share (%), by Country 2024 & 2032
- Figure 31: North America Chromium Market Revenue (Billion), by Application 2024 & 2032
- Figure 32: North America Chromium Market Volume (K Tons), by Application 2024 & 2032
- Figure 33: North America Chromium Market Revenue Share (%), by Application 2024 & 2032
- Figure 34: North America Chromium Market Volume Share (%), by Application 2024 & 2032
- Figure 35: North America Chromium Market Revenue (Billion), by Country 2024 & 2032
- Figure 36: North America Chromium Market Volume (K Tons), by Country 2024 & 2032
- Figure 37: North America Chromium Market Revenue Share (%), by Country 2024 & 2032
- Figure 38: North America Chromium Market Volume Share (%), by Country 2024 & 2032
- Figure 39: Europe Chromium Market Revenue (Billion), by Application 2024 & 2032
- Figure 40: Europe Chromium Market Volume (K Tons), by Application 2024 & 2032
- Figure 41: Europe Chromium Market Revenue Share (%), by Application 2024 & 2032
- Figure 42: Europe Chromium Market Volume Share (%), by Application 2024 & 2032
- Figure 43: Europe Chromium Market Revenue (Billion), by Country 2024 & 2032
- Figure 44: Europe Chromium Market Volume (K Tons), by Country 2024 & 2032
- Figure 45: Europe Chromium Market Revenue Share (%), by Country 2024 & 2032
- Figure 46: Europe Chromium Market Volume Share (%), by Country 2024 & 2032
- Figure 47: South America Chromium Market Revenue (Billion), by Application 2024 & 2032
- Figure 48: South America Chromium Market Volume (K Tons), by Application 2024 & 2032
- Figure 49: South America Chromium Market Revenue Share (%), by Application 2024 & 2032
- Figure 50: South America Chromium Market Volume Share (%), by Application 2024 & 2032
- Figure 51: South America Chromium Market Revenue (Billion), by Country 2024 & 2032
- Figure 52: South America Chromium Market Volume (K Tons), by Country 2024 & 2032
- Figure 53: South America Chromium Market Revenue Share (%), by Country 2024 & 2032
- Figure 54: South America Chromium Market Volume Share (%), by Country 2024 & 2032
- Figure 55: Middle East and Africa Chromium Market Revenue (Billion), by Application 2024 & 2032
- Figure 56: Middle East and Africa Chromium Market Volume (K Tons), by Application 2024 & 2032
- Figure 57: Middle East and Africa Chromium Market Revenue Share (%), by Application 2024 & 2032
- Figure 58: Middle East and Africa Chromium Market Volume Share (%), by Application 2024 & 2032
- Figure 59: Middle East and Africa Chromium Market Revenue (Billion), by Country 2024 & 2032
- Figure 60: Middle East and Africa Chromium Market Volume (K Tons), by Country 2024 & 2032
- Figure 61: Middle East and Africa Chromium Market Revenue Share (%), by Country 2024 & 2032
- Figure 62: Middle East and Africa Chromium Market Volume Share (%), by Country 2024 & 2032
List of Tables
- Table 1: Global Chromium Market Revenue Billion Forecast, by Region 2019 & 2032
- Table 2: Global Chromium Market Volume K Tons Forecast, by Region 2019 & 2032
- Table 3: Global Chromium Market Revenue Billion Forecast, by Application 2019 & 2032
- Table 4: Global Chromium Market Volume K Tons Forecast, by Application 2019 & 2032
- Table 5: Global Chromium Market Revenue Billion Forecast, by Region 2019 & 2032
- Table 6: Global Chromium Market Volume K Tons Forecast, by Region 2019 & 2032
- Table 7: Global Chromium Market Revenue Billion Forecast, by Country 2019 & 2032
- Table 8: Global Chromium Market Volume K Tons Forecast, by Country 2019 & 2032
- Table 9: United States Chromium Market Revenue (Billion) Forecast, by Application 2019 & 2032
- Table 10: United States Chromium Market Volume (K Tons) Forecast, by Application 2019 & 2032
- Table 11: Canada Chromium Market Revenue (Billion) Forecast, by Application 2019 & 2032
- Table 12: Canada Chromium Market Volume (K Tons) Forecast, by Application 2019 & 2032
- Table 13: Mexico Chromium Market Revenue (Billion) Forecast, by Application 2019 & 2032
- Table 14: Mexico Chromium Market Volume (K Tons) Forecast, by Application 2019 & 2032
- Table 15: Global Chromium Market Revenue Billion Forecast, by Country 2019 & 2032
- Table 16: Global Chromium Market Volume K Tons Forecast, by Country 2019 & 2032
- Table 17: Germany Chromium Market Revenue (Billion) Forecast, by Application 2019 & 2032
- Table 18: Germany Chromium Market Volume (K Tons) Forecast, by Application 2019 & 2032
- Table 19: France Chromium Market Revenue (Billion) Forecast, by Application 2019 & 2032
- Table 20: France Chromium Market Volume (K Tons) Forecast, by Application 2019 & 2032
- Table 21: Italy Chromium Market Revenue (Billion) Forecast, by Application 2019 & 2032
- Table 22: Italy Chromium Market Volume (K Tons) Forecast, by Application 2019 & 2032
- Table 23: United Kingdom Chromium Market Revenue (Billion) Forecast, by Application 2019 & 2032
- Table 24: United Kingdom Chromium Market Volume (K Tons) Forecast, by Application 2019 & 2032
- Table 25: Netherlands Chromium Market Revenue (Billion) Forecast, by Application 2019 & 2032
- Table 26: Netherlands Chromium Market Volume (K Tons) Forecast, by Application 2019 & 2032
- Table 27: Rest of Europe Chromium Market Revenue (Billion) Forecast, by Application 2019 & 2032
- Table 28: Rest of Europe Chromium Market Volume (K Tons) Forecast, by Application 2019 & 2032
- Table 29: Global Chromium Market Revenue Billion Forecast, by Country 2019 & 2032
- Table 30: Global Chromium Market Volume K Tons Forecast, by Country 2019 & 2032
- Table 31: China Chromium Market Revenue (Billion) Forecast, by Application 2019 & 2032
- Table 32: China Chromium Market Volume (K Tons) Forecast, by Application 2019 & 2032
- Table 33: Japan Chromium Market Revenue (Billion) Forecast, by Application 2019 & 2032
- Table 34: Japan Chromium Market Volume (K Tons) Forecast, by Application 2019 & 2032
- Table 35: India Chromium Market Revenue (Billion) Forecast, by Application 2019 & 2032
- Table 36: India Chromium Market Volume (K Tons) Forecast, by Application 2019 & 2032
- Table 37: South Korea Chromium Market Revenue (Billion) Forecast, by Application 2019 & 2032
- Table 38: South Korea Chromium Market Volume (K Tons) Forecast, by Application 2019 & 2032
- Table 39: Taiwan Chromium Market Revenue (Billion) Forecast, by Application 2019 & 2032
- Table 40: Taiwan Chromium Market Volume (K Tons) Forecast, by Application 2019 & 2032
- Table 41: Australia Chromium Market Revenue (Billion) Forecast, by Application 2019 & 2032
- Table 42: Australia Chromium Market Volume (K Tons) Forecast, by Application 2019 & 2032
- Table 43: Rest of Asia-Pacific Chromium Market Revenue (Billion) Forecast, by Application 2019 & 2032
- Table 44: Rest of Asia-Pacific Chromium Market Volume (K Tons) Forecast, by Application 2019 & 2032
- Table 45: Global Chromium Market Revenue Billion Forecast, by Country 2019 & 2032
- Table 46: Global Chromium Market Volume K Tons Forecast, by Country 2019 & 2032
- Table 47: Brazil Chromium Market Revenue (Billion) Forecast, by Application 2019 & 2032
- Table 48: Brazil Chromium Market Volume (K Tons) Forecast, by Application 2019 & 2032
- Table 49: Argentina Chromium Market Revenue (Billion) Forecast, by Application 2019 & 2032
- Table 50: Argentina Chromium Market Volume (K Tons) Forecast, by Application 2019 & 2032
- Table 51: Rest of South America Chromium Market Revenue (Billion) Forecast, by Application 2019 & 2032
- Table 52: Rest of South America Chromium Market Volume (K Tons) Forecast, by Application 2019 & 2032
- Table 53: Global Chromium Market Revenue Billion Forecast, by Country 2019 & 2032
- Table 54: Global Chromium Market Volume K Tons Forecast, by Country 2019 & 2032
- Table 55: Middle East Chromium Market Revenue (Billion) Forecast, by Application 2019 & 2032
- Table 56: Middle East Chromium Market Volume (K Tons) Forecast, by Application 2019 & 2032
- Table 57: Africa Chromium Market Revenue (Billion) Forecast, by Application 2019 & 2032
- Table 58: Africa Chromium Market Volume (K Tons) Forecast, by Application 2019 & 2032
- Table 59: Global Chromium Market Revenue Billion Forecast, by Application 2019 & 2032
- Table 60: Global Chromium Market Volume K Tons Forecast, by Application 2019 & 2032
- Table 61: Global Chromium Market Revenue Billion Forecast, by Country 2019 & 2032
- Table 62: Global Chromium Market Volume K Tons Forecast, by Country 2019 & 2032
- Table 63: China Chromium Market Revenue (Billion) Forecast, by Application 2019 & 2032
- Table 64: China Chromium Market Volume (K Tons) Forecast, by Application 2019 & 2032
- Table 65: India Chromium Market Revenue (Billion) Forecast, by Application 2019 & 2032
- Table 66: India Chromium Market Volume (K Tons) Forecast, by Application 2019 & 2032
- Table 67: Japan Chromium Market Revenue (Billion) Forecast, by Application 2019 & 2032
- Table 68: Japan Chromium Market Volume (K Tons) Forecast, by Application 2019 & 2032
- Table 69: South Korea Chromium Market Revenue (Billion) Forecast, by Application 2019 & 2032
- Table 70: South Korea Chromium Market Volume (K Tons) Forecast, by Application 2019 & 2032
- Table 71: Malaysia Chromium Market Revenue (Billion) Forecast, by Application 2019 & 2032
- Table 72: Malaysia Chromium Market Volume (K Tons) Forecast, by Application 2019 & 2032
- Table 73: Thailand Chromium Market Revenue (Billion) Forecast, by Application 2019 & 2032
- Table 74: Thailand Chromium Market Volume (K Tons) Forecast, by Application 2019 & 2032
- Table 75: Indonesia Chromium Market Revenue (Billion) Forecast, by Application 2019 & 2032
- Table 76: Indonesia Chromium Market Volume (K Tons) Forecast, by Application 2019 & 2032
- Table 77: Vietnam Chromium Market Revenue (Billion) Forecast, by Application 2019 & 2032
- Table 78: Vietnam Chromium Market Volume (K Tons) Forecast, by Application 2019 & 2032
- Table 79: Rest of Asia Pacific Chromium Market Revenue (Billion) Forecast, by Application 2019 & 2032
- Table 80: Rest of Asia Pacific Chromium Market Volume (K Tons) Forecast, by Application 2019 & 2032
- Table 81: Global Chromium Market Revenue Billion Forecast, by Application 2019 & 2032
- Table 82: Global Chromium Market Volume K Tons Forecast, by Application 2019 & 2032
- Table 83: Global Chromium Market Revenue Billion Forecast, by Country 2019 & 2032
- Table 84: Global Chromium Market Volume K Tons Forecast, by Country 2019 & 2032
- Table 85: United States Chromium Market Revenue (Billion) Forecast, by Application 2019 & 2032
- Table 86: United States Chromium Market Volume (K Tons) Forecast, by Application 2019 & 2032
- Table 87: Canada Chromium Market Revenue (Billion) Forecast, by Application 2019 & 2032
- Table 88: Canada Chromium Market Volume (K Tons) Forecast, by Application 2019 & 2032
- Table 89: Mexico Chromium Market Revenue (Billion) Forecast, by Application 2019 & 2032
- Table 90: Mexico Chromium Market Volume (K Tons) Forecast, by Application 2019 & 2032
- Table 91: Global Chromium Market Revenue Billion Forecast, by Application 2019 & 2032
- Table 92: Global Chromium Market Volume K Tons Forecast, by Application 2019 & 2032
- Table 93: Global Chromium Market Revenue Billion Forecast, by Country 2019 & 2032
- Table 94: Global Chromium Market Volume K Tons Forecast, by Country 2019 & 2032
- Table 95: Germany Chromium Market Revenue (Billion) Forecast, by Application 2019 & 2032
- Table 96: Germany Chromium Market Volume (K Tons) Forecast, by Application 2019 & 2032
- Table 97: United Kingdom Chromium Market Revenue (Billion) Forecast, by Application 2019 & 2032
- Table 98: United Kingdom Chromium Market Volume (K Tons) Forecast, by Application 2019 & 2032
- Table 99: Italy Chromium Market Revenue (Billion) Forecast, by Application 2019 & 2032
- Table 100: Italy Chromium Market Volume (K Tons) Forecast, by Application 2019 & 2032
- Table 101: France Chromium Market Revenue (Billion) Forecast, by Application 2019 & 2032
- Table 102: France Chromium Market Volume (K Tons) Forecast, by Application 2019 & 2032
- Table 103: Spain Chromium Market Revenue (Billion) Forecast, by Application 2019 & 2032
- Table 104: Spain Chromium Market Volume (K Tons) Forecast, by Application 2019 & 2032
- Table 105: NORDIC Chromium Market Revenue (Billion) Forecast, by Application 2019 & 2032
- Table 106: NORDIC Chromium Market Volume (K Tons) Forecast, by Application 2019 & 2032
- Table 107: Turkey Chromium Market Revenue (Billion) Forecast, by Application 2019 & 2032
- Table 108: Turkey Chromium Market Volume (K Tons) Forecast, by Application 2019 & 2032
- Table 109: Russia Chromium Market Revenue (Billion) Forecast, by Application 2019 & 2032
- Table 110: Russia Chromium Market Volume (K Tons) Forecast, by Application 2019 & 2032
- Table 111: Rest of Europe Chromium Market Revenue (Billion) Forecast, by Application 2019 & 2032
- Table 112: Rest of Europe Chromium Market Volume (K Tons) Forecast, by Application 2019 & 2032
- Table 113: Global Chromium Market Revenue Billion Forecast, by Application 2019 & 2032
- Table 114: Global Chromium Market Volume K Tons Forecast, by Application 2019 & 2032
- Table 115: Global Chromium Market Revenue Billion Forecast, by Country 2019 & 2032
- Table 116: Global Chromium Market Volume K Tons Forecast, by Country 2019 & 2032
- Table 117: Brazil Chromium Market Revenue (Billion) Forecast, by Application 2019 & 2032
- Table 118: Brazil Chromium Market Volume (K Tons) Forecast, by Application 2019 & 2032
- Table 119: Argentina Chromium Market Revenue (Billion) Forecast, by Application 2019 & 2032
- Table 120: Argentina Chromium Market Volume (K Tons) Forecast, by Application 2019 & 2032
- Table 121: Colombia Chromium Market Revenue (Billion) Forecast, by Application 2019 & 2032
- Table 122: Colombia Chromium Market Volume (K Tons) Forecast, by Application 2019 & 2032
- Table 123: Rest of South America Chromium Market Revenue (Billion) Forecast, by Application 2019 & 2032
- Table 124: Rest of South America Chromium Market Volume (K Tons) Forecast, by Application 2019 & 2032
- Table 125: Global Chromium Market Revenue Billion Forecast, by Application 2019 & 2032
- Table 126: Global Chromium Market Volume K Tons Forecast, by Application 2019 & 2032
- Table 127: Global Chromium Market Revenue Billion Forecast, by Country 2019 & 2032
- Table 128: Global Chromium Market Volume K Tons Forecast, by Country 2019 & 2032
- Table 129: Saudi Arabia Chromium Market Revenue (Billion) Forecast, by Application 2019 & 2032
- Table 130: Saudi Arabia Chromium Market Volume (K Tons) Forecast, by Application 2019 & 2032
- Table 131: South Africa Chromium Market Revenue (Billion) Forecast, by Application 2019 & 2032
- Table 132: South Africa Chromium Market Volume (K Tons) Forecast, by Application 2019 & 2032
- Table 133: Nigeria Chromium Market Revenue (Billion) Forecast, by Application 2019 & 2032
- Table 134: Nigeria Chromium Market Volume (K Tons) Forecast, by Application 2019 & 2032
- Table 135: Qatar Chromium Market Revenue (Billion) Forecast, by Application 2019 & 2032
- Table 136: Qatar Chromium Market Volume (K Tons) Forecast, by Application 2019 & 2032
- Table 137: Egypt Chromium Market Revenue (Billion) Forecast, by Application 2019 & 2032
- Table 138: Egypt Chromium Market Volume (K Tons) Forecast, by Application 2019 & 2032
- Table 139: United Arab Emirates Chromium Market Revenue (Billion) Forecast, by Application 2019 & 2032
- Table 140: United Arab Emirates Chromium Market Volume (K Tons) Forecast, by Application 2019 & 2032
- Table 141: Rest of Middle East and Africa Chromium Market Revenue (Billion) Forecast, by Application 2019 & 2032
- Table 142: Rest of Middle East and Africa Chromium Market Volume (K Tons) Forecast, by Application 2019 & 2032
Frequently Asked Questions
1. What is the projected Compound Annual Growth Rate (CAGR) of the Chromium Market?
The projected CAGR is approximately 5.5%.
2. Which companies are prominent players in the Chromium Market?
Key companies in the market include Tenaris, MVC Holdings LLC, CVK Madencilik, Odisha Mining Corporation Ltd, Glencore, International Ferro Metals (IFM), Al Tamman Indsil FerroChrome L L C, Kermas Investment Group, Hernic Ferrochrome (Pty) Ltd (Hernic), YILDIRIM Group of Companies, Assmang Proprietary Limited.
3. What are the main segments of the Chromium Market?
The market segments include Application.
4. Can you provide details about the market size?
The market size is estimated to be USD 22.6 Billion as of 2022.
5. What are some drivers contributing to market growth?
Growing Demand for Metallurgical Uses; Increasing Refractory Applications in Industries; Other Drivers.
6. What are the notable trends driving market growth?
Metallurgical Applications to Witness Growth in Future.
7. Are there any restraints impacting market growth?
Associated Health Effects; Other Restraints.
8. Can you provide examples of recent developments in the market?
November 2022: Yildirim Group announced the acquisition of 100% shares of Elementis plc's chromium business for an enterprise value of USD 170 million. With this agreement in place, Yildirim Group has acquired Elementis Chromium's two production facilities in Corpus Christi (TX) and Castle Hayne (NC), as well as three facilities in Amarillo (TX), Dakota (NE) and Milwaukee (WI).
9. What pricing options are available for accessing the report?
Pricing options include single-user, multi-user, and enterprise licenses priced at USD 3,950, USD 4,950, and USD 6,950 respectively.
10. Is the market size provided in terms of value or volume?
The market size is provided in terms of value, measured in Billion and volume, measured in K Tons.
11. Are there any specific market keywords associated with the report?
Yes, the market keyword associated with the report is "Chromium Market," which aids in identifying and referencing the specific market segment covered.
12. How do I determine which pricing option suits my needs best?
The pricing options vary based on user requirements and access needs. Individual users may opt for single-user licenses, while businesses requiring broader access may choose multi-user or enterprise licenses for cost-effective access to the report.
13. Are there any additional resources or data provided in the Chromium Market report?
While the report offers comprehensive insights, it's advisable to review the specific contents or supplementary materials provided to ascertain if additional resources or data are available.
14. How can I stay updated on further developments or reports in the Chromium Market?
To stay informed about further developments, trends, and reports in the Chromium Market, consider subscribing to industry newsletters, following relevant companies and organizations, or regularly checking reputable industry news sources and publications.
Methodology
Step 1 - Identification of Relevant Samples Size from Population Database


Step 2 - Approaches for Defining Global Market Size (Value, Volume* & Price*)

Note*: In applicable scenarios
Step 3 - Data Sources
Primary Research
- Web Analytics
- Survey Reports
- Research Institute
- Latest Research Reports
- Opinion Leaders
Secondary Research
- Annual Reports
- White Paper
- Latest Press Release
- Industry Association
- Paid Database
- Investor Presentations

Step 4 - Data Triangulation
Involves using different sources of information in order to increase the validity of a study
These sources are likely to be stakeholders in a program - participants, other researchers, program staff, other community members, and so on.
Then we put all data in single framework & apply various statistical tools to find out the dynamic on the market.
During the analysis stage, feedback from the stakeholder groups would be compared to determine areas of agreement as well as areas of divergence


