
Key Insights
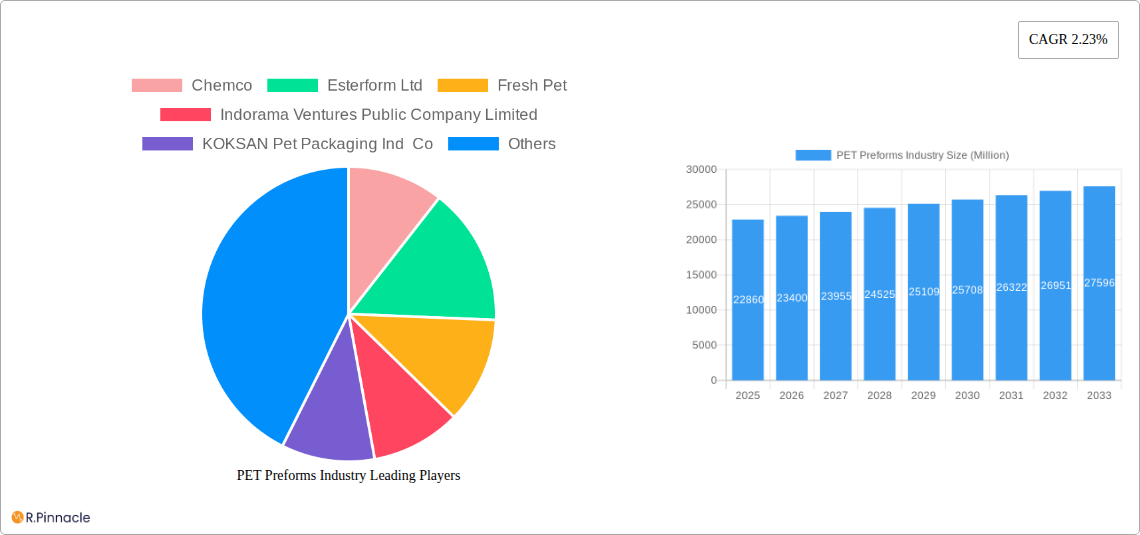
The global PET preforms market, valued at $22.86 billion in 2025, is projected to experience steady growth, driven by the burgeoning demand for packaged beverages and food products. The 2.23% CAGR from 2025 to 2033 indicates a consistent expansion, fueled by several key factors. The increasing popularity of convenience foods and drinks, coupled with the lightweight and recyclable nature of PET preforms, contributes significantly to this growth. Furthermore, advancements in preform manufacturing technologies, leading to improved efficiency and reduced production costs, are further bolstering market expansion. The rising adoption of sustainable packaging solutions and stricter regulations regarding single-use plastics are also shaping the industry landscape, pushing manufacturers to innovate and adopt eco-friendly practices. Competition among established players like Chemco, Esterform Ltd, and Plastipak Holdings Inc., alongside emerging regional companies, is fostering innovation and creating diverse product offerings.
However, several challenges exist. Fluctuations in raw material prices, particularly PET resin, can significantly impact profitability. The market also faces pressure from alternative packaging materials, such as glass and aluminum, particularly in segments emphasizing premium or environmentally conscious branding. Addressing these challenges requires manufacturers to optimize their supply chains, invest in cost-effective production processes, and continuously explore sustainable and innovative solutions to maintain competitiveness and meet evolving consumer demands. Geographic variations in market growth are expected, with regions experiencing higher economic growth and rising disposable incomes likely showing stronger performance. The forecast period of 2025-2033 holds significant opportunity for industry stakeholders who can successfully navigate these trends and challenges.
PET Preforms Industry Report: 2019-2033
This comprehensive report provides an in-depth analysis of the PET Preforms industry, offering invaluable insights for industry professionals, investors, and strategic decision-makers. Covering the period from 2019 to 2033, with a focus on 2025, this report unveils market trends, competitive dynamics, and future growth opportunities within this dynamic sector. The global market size is projected to reach xx Million by 2033.
PET Preforms Industry Market Structure & Innovation Trends
This section analyzes the competitive landscape of the PET Preforms industry, examining market concentration, innovation drivers, regulatory frameworks, and key M&A activities. The industry is characterized by a mix of large multinational corporations and smaller regional players, with varying degrees of market share. While exact market share figures for each company are proprietary information and vary year to year, we can state that several key players hold significant positions. The industry is moderately concentrated, with some players demonstrating considerable market power. Innovation is driven by the increasing demand for lightweighting, sustainable packaging solutions, and enhanced barrier properties. Stringent regulatory frameworks regarding recyclability and food safety significantly influence product development and manufacturing processes. Substitute materials like glass and aluminum pose some competition, but PET's cost-effectiveness and versatility maintain its dominant position.
- Market Concentration: Moderately concentrated, with several major players dominating significant market share.
- Innovation Drivers: Lightweighting, sustainability (rPET), enhanced barrier properties, and improved recyclability.
- Regulatory Frameworks: Stringent food safety and environmental regulations drive innovation and compliance.
- Product Substitutes: Glass and aluminum, although PET maintains a significant competitive edge due to cost and versatility.
- End-User Demographics: Driven by the growth of the food and beverage industry, particularly bottled water and carbonated soft drinks.
- M&A Activities: Significant M&A activity observed, with deal values exceeding xx Million in recent years. Examples include Valgroup's acquisition of Garda Plast Group.
PET Preforms Industry Market Dynamics & Trends
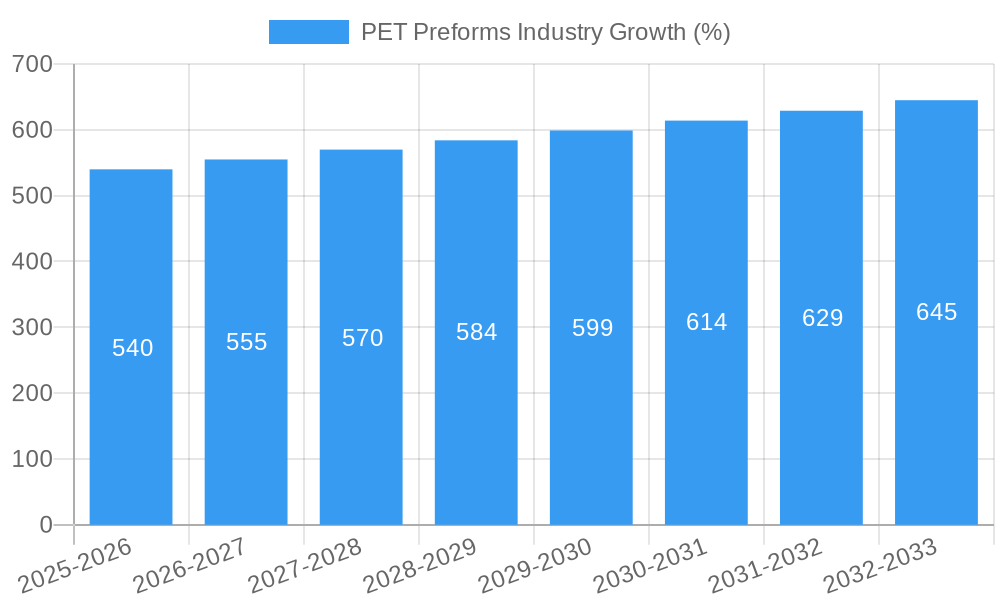
The PET Preforms industry is experiencing robust growth, driven by several key factors. The rising demand for packaged beverages globally, coupled with the cost-effectiveness and recyclability of PET, fuels this expansion. The shift towards lightweighting in packaging reduces material costs and carbon emissions, while the adoption of rPET (recycled PET) aligns with sustainability initiatives. Technological advancements in preform design and manufacturing processes are improving efficiency and product quality. However, fluctuating raw material prices and intense competition pose challenges. The industry displays a steady compound annual growth rate (CAGR) of xx% during the forecast period (2025-2033), driven by increased consumer preference for convenience, and technological advancements leading to higher penetration rates.
Dominant Regions & Segments in PET Preforms Industry
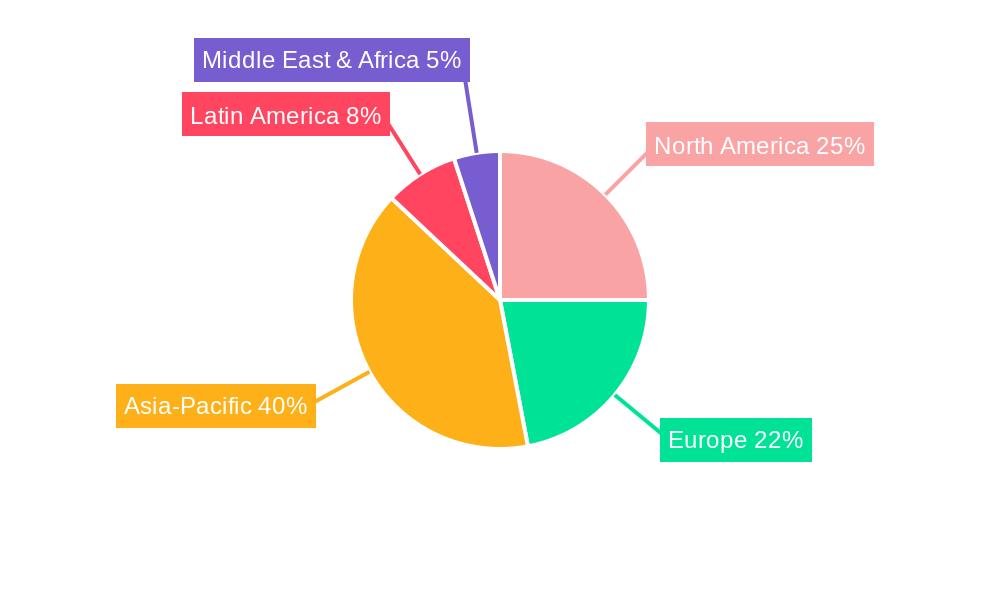
The Asia-Pacific region emerges as the leading market for PET preforms, primarily due to its robust economic growth, burgeoning food and beverage sector, and rising consumer disposable income. Europe and North America also represent substantial markets. The beverage segment dominates within the industry, with significant contributions from the food and personal care sectors.
- Key Drivers in Asia-Pacific: Rapid economic growth, large population base, expanding middle class, increasing demand for packaged goods.
- Key Drivers in Europe: Established manufacturing base, strong regulatory framework promoting sustainability, demand for high-quality packaging.
- Key Drivers in North America: High consumer disposable income, established food and beverage industry, strong demand for convenience packaging.
- Dominance Analysis: Asia-Pacific's rapid economic development and large consumer base contribute to its dominance. However, Europe and North America maintain significant market share.
PET Preforms Industry Product Innovations
Recent innovations in PET preforms focus on enhanced barrier properties, lighter weight designs, and improved recyclability. These advancements cater to the growing demand for sustainable and functional packaging solutions. Advances in preform design and manufacturing technologies allow for more intricate shapes and improved process efficiency. This results in reduced material usage and improved cost-effectiveness for manufacturers. The market fit for these innovations is strong, as consumers increasingly prioritize environmentally friendly and functional packaging options.
Report Scope & Segmentation Analysis
This report comprehensively segments the PET preforms market by product type (e.g., monolayer, multilayer), application (e.g., beverages, food, personal care), and region. Each segment showcases unique growth trajectories and competitive dynamics, providing a granular understanding of market opportunities and challenges. Growth projections for each segment are detailed, indicating varying market sizes and potential for expansion. Competitive analysis within each segment identifies key players, their market positioning, and strategic approaches.
Key Drivers of PET Preforms Industry Growth
The PET preforms industry thrives on several key drivers. The rise in packaged beverage consumption worldwide significantly contributes to this growth. Technological advancements resulting in lightweighting, improved barrier properties, and increased recyclability all boost the industry's trajectory. Favorable government regulations promoting sustainability and economic growth further contribute to market expansion. The increasing consumer demand for convenient and sustainable packaging is a key accelerator for growth.
Challenges in the PET Preforms Industry Sector
The PET preforms industry faces challenges including fluctuating raw material prices, particularly petroleum-based resins. Stringent environmental regulations and the associated compliance costs impact profitability. Intense competition, particularly from established players, puts pressure on profit margins. Supply chain disruptions related to raw material availability and logistics can also impede growth.
Emerging Opportunities in PET Preforms Industry
Opportunities exist in the growing demand for sustainable and recycled PET preforms (rPET). Innovations in preform design for enhanced barrier properties and lightweighting present significant potential. Expansion into emerging markets with high growth rates in packaged food and beverage consumption offers considerable scope for market entry. The development of specialized preforms for niche applications presents another significant growth opportunity.
Leading Players in the PET Preforms Industry Market
- Chemco
- Esterform Ltd
- Fresh Pet
- Indorama Ventures Public Company Limited (Indorama Ventures)
- KOKSAN Pet Packaging Ind Co
- OZEMBAL
- Plastipak Holdings Inc (Plastipak)
- Polisang Hellas
- RESILUX NV (Resilux)
- RETAL Industries Ltd (Retal)
- SGT
- TPAC PACKAGING INDIA PRIVATE LIMITED
- Valgroup
- Varioform PET
- Winley Polymers Pvt Ltd
*List Not Exhaustive
Key Developments in PET Preforms Industry
- September 2023: Retal Czech launched monolayer preforms at its Melnik facility, expanding its European market reach.
- October 2023: Valgroup's acquisition of Garda Plast Group significantly expanded its presence in the Italian market.
- May 2024: Retal Industries Ltd partnered with Orzuplast in Uzbekistan, expanding its global reach and service capabilities.
Future Outlook for PET Preforms Industry Market
The PET preforms industry is poised for continued growth, driven by increasing consumer demand for packaged goods, particularly in emerging markets. The focus on sustainable and recycled materials, coupled with ongoing technological advancements, will shape the industry's trajectory. Strategic partnerships and acquisitions will continue to reshape the competitive landscape, fostering innovation and market expansion. The industry's future hinges on its ability to adapt to evolving consumer preferences and environmental regulations, maximizing opportunities while mitigating potential challenges.
PET Preforms Industry Segmentation
-
1. Application
- 1.1. Carbonated Soft Drinks and Water
- 1.2. Food and Dairy
- 1.3. Personal Care
- 1.4. Alcoholic Beverages
- 1.5. Other Applications (Household Cleaning)
PET Preforms Industry Segmentation By Geography
-
1. Asia Pacific
- 1.1. China
- 1.2. India
- 1.3. Japan
- 1.4. South Korea
- 1.5. Malaysia
- 1.6. Thailand
- 1.7. Indonesia
- 1.8. Vietnam
- 1.9. Rest of Asia Pacific
-
2. North America
- 2.1. United States
- 2.2. Canada
- 2.3. Mexico
-
3. Europe
- 3.1. Germany
- 3.2. United Kingdom
- 3.3. France
- 3.4. Italy
- 3.5. Spain
- 3.6. NORDIC Countries
- 3.7. Turkey
- 3.8. Russia
- 3.9. Rest of Europe
-
4. South America
- 4.1. Brazil
- 4.2. Argentina
- 4.3. Colombia
- 4.4. Rest of South America
-
5. Middle East and Africa
- 5.1. Saudi Arabia
- 5.2. Qatar
- 5.3. United Arab Emirates
- 5.4. Nigeria
- 5.5. Egypt
- 5.6. South Africa
- 5.7. Rest of Middle East and Africa
PET Preforms Industry REPORT HIGHLIGHTS
| Aspects | Details |
|---|---|
| Study Period | 2019-2033 |
| Base Year | 2024 |
| Estimated Year | 2025 |
| Forecast Period | 2025-2033 |
| Historical Period | 2019-2024 |
| Growth Rate | CAGR of 2.23% from 2019-2033 |
| Segmentation |
|
Table of Contents
- 1. Introduction
- 1.1. Research Scope
- 1.2. Market Segmentation
- 1.3. Research Methodology
- 1.4. Definitions and Assumptions
- 2. Executive Summary
- 2.1. Introduction
- 3. Market Dynamics
- 3.1. Introduction
- 3.2. Market Drivers
- 3.2.1. Increasing Demand from Food and Beverage Applications; High Consumption of Carbonated Soft Drinks and Water; Other Drivers
- 3.3. Market Restrains
- 3.3.1. Increasing Demand from Food and Beverage Applications; High Consumption of Carbonated Soft Drinks and Water; Other Drivers
- 3.4. Market Trends
- 3.4.1. Carbonated Soft Drinks and Water to Dominate the Market
- 4. Market Factor Analysis
- 4.1. Porters Five Forces
- 4.2. Supply/Value Chain
- 4.3. PESTEL analysis
- 4.4. Market Entropy
- 4.5. Patent/Trademark Analysis
- 5. Global PET Preforms Industry Analysis, Insights and Forecast, 2019-2031
- 5.1. Market Analysis, Insights and Forecast - by Application
- 5.1.1. Carbonated Soft Drinks and Water
- 5.1.2. Food and Dairy
- 5.1.3. Personal Care
- 5.1.4. Alcoholic Beverages
- 5.1.5. Other Applications (Household Cleaning)
- 5.2. Market Analysis, Insights and Forecast - by Region
- 5.2.1. Asia Pacific
- 5.2.2. North America
- 5.2.3. Europe
- 5.2.4. South America
- 5.2.5. Middle East and Africa
- 5.1. Market Analysis, Insights and Forecast - by Application
- 6. Asia Pacific PET Preforms Industry Analysis, Insights and Forecast, 2019-2031
- 6.1. Market Analysis, Insights and Forecast - by Application
- 6.1.1. Carbonated Soft Drinks and Water
- 6.1.2. Food and Dairy
- 6.1.3. Personal Care
- 6.1.4. Alcoholic Beverages
- 6.1.5. Other Applications (Household Cleaning)
- 6.1. Market Analysis, Insights and Forecast - by Application
- 7. North America PET Preforms Industry Analysis, Insights and Forecast, 2019-2031
- 7.1. Market Analysis, Insights and Forecast - by Application
- 7.1.1. Carbonated Soft Drinks and Water
- 7.1.2. Food and Dairy
- 7.1.3. Personal Care
- 7.1.4. Alcoholic Beverages
- 7.1.5. Other Applications (Household Cleaning)
- 7.1. Market Analysis, Insights and Forecast - by Application
- 8. Europe PET Preforms Industry Analysis, Insights and Forecast, 2019-2031
- 8.1. Market Analysis, Insights and Forecast - by Application
- 8.1.1. Carbonated Soft Drinks and Water
- 8.1.2. Food and Dairy
- 8.1.3. Personal Care
- 8.1.4. Alcoholic Beverages
- 8.1.5. Other Applications (Household Cleaning)
- 8.1. Market Analysis, Insights and Forecast - by Application
- 9. South America PET Preforms Industry Analysis, Insights and Forecast, 2019-2031
- 9.1. Market Analysis, Insights and Forecast - by Application
- 9.1.1. Carbonated Soft Drinks and Water
- 9.1.2. Food and Dairy
- 9.1.3. Personal Care
- 9.1.4. Alcoholic Beverages
- 9.1.5. Other Applications (Household Cleaning)
- 9.1. Market Analysis, Insights and Forecast - by Application
- 10. Middle East and Africa PET Preforms Industry Analysis, Insights and Forecast, 2019-2031
- 10.1. Market Analysis, Insights and Forecast - by Application
- 10.1.1. Carbonated Soft Drinks and Water
- 10.1.2. Food and Dairy
- 10.1.3. Personal Care
- 10.1.4. Alcoholic Beverages
- 10.1.5. Other Applications (Household Cleaning)
- 10.1. Market Analysis, Insights and Forecast - by Application
- 11. Competitive Analysis
- 11.1. Global Market Share Analysis 2024
- 11.2. Company Profiles
- 11.2.1 Chemco
- 11.2.1.1. Overview
- 11.2.1.2. Products
- 11.2.1.3. SWOT Analysis
- 11.2.1.4. Recent Developments
- 11.2.1.5. Financials (Based on Availability)
- 11.2.2 Esterform Ltd
- 11.2.2.1. Overview
- 11.2.2.2. Products
- 11.2.2.3. SWOT Analysis
- 11.2.2.4. Recent Developments
- 11.2.2.5. Financials (Based on Availability)
- 11.2.3 Fresh Pet
- 11.2.3.1. Overview
- 11.2.3.2. Products
- 11.2.3.3. SWOT Analysis
- 11.2.3.4. Recent Developments
- 11.2.3.5. Financials (Based on Availability)
- 11.2.4 Indorama Ventures Public Company Limited
- 11.2.4.1. Overview
- 11.2.4.2. Products
- 11.2.4.3. SWOT Analysis
- 11.2.4.4. Recent Developments
- 11.2.4.5. Financials (Based on Availability)
- 11.2.5 KOKSAN Pet Packaging Ind Co
- 11.2.5.1. Overview
- 11.2.5.2. Products
- 11.2.5.3. SWOT Analysis
- 11.2.5.4. Recent Developments
- 11.2.5.5. Financials (Based on Availability)
- 11.2.6 OZEMBAL
- 11.2.6.1. Overview
- 11.2.6.2. Products
- 11.2.6.3. SWOT Analysis
- 11.2.6.4. Recent Developments
- 11.2.6.5. Financials (Based on Availability)
- 11.2.7 Plastipak Holdings Inc
- 11.2.7.1. Overview
- 11.2.7.2. Products
- 11.2.7.3. SWOT Analysis
- 11.2.7.4. Recent Developments
- 11.2.7.5. Financials (Based on Availability)
- 11.2.8 Polisan Hellas
- 11.2.8.1. Overview
- 11.2.8.2. Products
- 11.2.8.3. SWOT Analysis
- 11.2.8.4. Recent Developments
- 11.2.8.5. Financials (Based on Availability)
- 11.2.9 RESILUX NV
- 11.2.9.1. Overview
- 11.2.9.2. Products
- 11.2.9.3. SWOT Analysis
- 11.2.9.4. Recent Developments
- 11.2.9.5. Financials (Based on Availability)
- 11.2.10 RETAL Industries Ltd
- 11.2.10.1. Overview
- 11.2.10.2. Products
- 11.2.10.3. SWOT Analysis
- 11.2.10.4. Recent Developments
- 11.2.10.5. Financials (Based on Availability)
- 11.2.11 SGT
- 11.2.11.1. Overview
- 11.2.11.2. Products
- 11.2.11.3. SWOT Analysis
- 11.2.11.4. Recent Developments
- 11.2.11.5. Financials (Based on Availability)
- 11.2.12 TPAC PACKAGING INDIA PRIVATE LIMITED
- 11.2.12.1. Overview
- 11.2.12.2. Products
- 11.2.12.3. SWOT Analysis
- 11.2.12.4. Recent Developments
- 11.2.12.5. Financials (Based on Availability)
- 11.2.13 Valgroup
- 11.2.13.1. Overview
- 11.2.13.2. Products
- 11.2.13.3. SWOT Analysis
- 11.2.13.4. Recent Developments
- 11.2.13.5. Financials (Based on Availability)
- 11.2.14 Varioform PET
- 11.2.14.1. Overview
- 11.2.14.2. Products
- 11.2.14.3. SWOT Analysis
- 11.2.14.4. Recent Developments
- 11.2.14.5. Financials (Based on Availability)
- 11.2.15 Winley Polymers Pvt Ltd*List Not Exhaustive
- 11.2.15.1. Overview
- 11.2.15.2. Products
- 11.2.15.3. SWOT Analysis
- 11.2.15.4. Recent Developments
- 11.2.15.5. Financials (Based on Availability)
- 11.2.1 Chemco
List of Figures
- Figure 1: Global PET Preforms Industry Revenue Breakdown (Million, %) by Region 2024 & 2032
- Figure 2: Global PET Preforms Industry Volume Breakdown (Billion, %) by Region 2024 & 2032
- Figure 3: Asia Pacific PET Preforms Industry Revenue (Million), by Application 2024 & 2032
- Figure 4: Asia Pacific PET Preforms Industry Volume (Billion), by Application 2024 & 2032
- Figure 5: Asia Pacific PET Preforms Industry Revenue Share (%), by Application 2024 & 2032
- Figure 6: Asia Pacific PET Preforms Industry Volume Share (%), by Application 2024 & 2032
- Figure 7: Asia Pacific PET Preforms Industry Revenue (Million), by Country 2024 & 2032
- Figure 8: Asia Pacific PET Preforms Industry Volume (Billion), by Country 2024 & 2032
- Figure 9: Asia Pacific PET Preforms Industry Revenue Share (%), by Country 2024 & 2032
- Figure 10: Asia Pacific PET Preforms Industry Volume Share (%), by Country 2024 & 2032
- Figure 11: North America PET Preforms Industry Revenue (Million), by Application 2024 & 2032
- Figure 12: North America PET Preforms Industry Volume (Billion), by Application 2024 & 2032
- Figure 13: North America PET Preforms Industry Revenue Share (%), by Application 2024 & 2032
- Figure 14: North America PET Preforms Industry Volume Share (%), by Application 2024 & 2032
- Figure 15: North America PET Preforms Industry Revenue (Million), by Country 2024 & 2032
- Figure 16: North America PET Preforms Industry Volume (Billion), by Country 2024 & 2032
- Figure 17: North America PET Preforms Industry Revenue Share (%), by Country 2024 & 2032
- Figure 18: North America PET Preforms Industry Volume Share (%), by Country 2024 & 2032
- Figure 19: Europe PET Preforms Industry Revenue (Million), by Application 2024 & 2032
- Figure 20: Europe PET Preforms Industry Volume (Billion), by Application 2024 & 2032
- Figure 21: Europe PET Preforms Industry Revenue Share (%), by Application 2024 & 2032
- Figure 22: Europe PET Preforms Industry Volume Share (%), by Application 2024 & 2032
- Figure 23: Europe PET Preforms Industry Revenue (Million), by Country 2024 & 2032
- Figure 24: Europe PET Preforms Industry Volume (Billion), by Country 2024 & 2032
- Figure 25: Europe PET Preforms Industry Revenue Share (%), by Country 2024 & 2032
- Figure 26: Europe PET Preforms Industry Volume Share (%), by Country 2024 & 2032
- Figure 27: South America PET Preforms Industry Revenue (Million), by Application 2024 & 2032
- Figure 28: South America PET Preforms Industry Volume (Billion), by Application 2024 & 2032
- Figure 29: South America PET Preforms Industry Revenue Share (%), by Application 2024 & 2032
- Figure 30: South America PET Preforms Industry Volume Share (%), by Application 2024 & 2032
- Figure 31: South America PET Preforms Industry Revenue (Million), by Country 2024 & 2032
- Figure 32: South America PET Preforms Industry Volume (Billion), by Country 2024 & 2032
- Figure 33: South America PET Preforms Industry Revenue Share (%), by Country 2024 & 2032
- Figure 34: South America PET Preforms Industry Volume Share (%), by Country 2024 & 2032
- Figure 35: Middle East and Africa PET Preforms Industry Revenue (Million), by Application 2024 & 2032
- Figure 36: Middle East and Africa PET Preforms Industry Volume (Billion), by Application 2024 & 2032
- Figure 37: Middle East and Africa PET Preforms Industry Revenue Share (%), by Application 2024 & 2032
- Figure 38: Middle East and Africa PET Preforms Industry Volume Share (%), by Application 2024 & 2032
- Figure 39: Middle East and Africa PET Preforms Industry Revenue (Million), by Country 2024 & 2032
- Figure 40: Middle East and Africa PET Preforms Industry Volume (Billion), by Country 2024 & 2032
- Figure 41: Middle East and Africa PET Preforms Industry Revenue Share (%), by Country 2024 & 2032
- Figure 42: Middle East and Africa PET Preforms Industry Volume Share (%), by Country 2024 & 2032
List of Tables
- Table 1: Global PET Preforms Industry Revenue Million Forecast, by Region 2019 & 2032
- Table 2: Global PET Preforms Industry Volume Billion Forecast, by Region 2019 & 2032
- Table 3: Global PET Preforms Industry Revenue Million Forecast, by Application 2019 & 2032
- Table 4: Global PET Preforms Industry Volume Billion Forecast, by Application 2019 & 2032
- Table 5: Global PET Preforms Industry Revenue Million Forecast, by Region 2019 & 2032
- Table 6: Global PET Preforms Industry Volume Billion Forecast, by Region 2019 & 2032
- Table 7: Global PET Preforms Industry Revenue Million Forecast, by Application 2019 & 2032
- Table 8: Global PET Preforms Industry Volume Billion Forecast, by Application 2019 & 2032
- Table 9: Global PET Preforms Industry Revenue Million Forecast, by Country 2019 & 2032
- Table 10: Global PET Preforms Industry Volume Billion Forecast, by Country 2019 & 2032
- Table 11: China PET Preforms Industry Revenue (Million) Forecast, by Application 2019 & 2032
- Table 12: China PET Preforms Industry Volume (Billion) Forecast, by Application 2019 & 2032
- Table 13: India PET Preforms Industry Revenue (Million) Forecast, by Application 2019 & 2032
- Table 14: India PET Preforms Industry Volume (Billion) Forecast, by Application 2019 & 2032
- Table 15: Japan PET Preforms Industry Revenue (Million) Forecast, by Application 2019 & 2032
- Table 16: Japan PET Preforms Industry Volume (Billion) Forecast, by Application 2019 & 2032
- Table 17: South Korea PET Preforms Industry Revenue (Million) Forecast, by Application 2019 & 2032
- Table 18: South Korea PET Preforms Industry Volume (Billion) Forecast, by Application 2019 & 2032
- Table 19: Malaysia PET Preforms Industry Revenue (Million) Forecast, by Application 2019 & 2032
- Table 20: Malaysia PET Preforms Industry Volume (Billion) Forecast, by Application 2019 & 2032
- Table 21: Thailand PET Preforms Industry Revenue (Million) Forecast, by Application 2019 & 2032
- Table 22: Thailand PET Preforms Industry Volume (Billion) Forecast, by Application 2019 & 2032
- Table 23: Indonesia PET Preforms Industry Revenue (Million) Forecast, by Application 2019 & 2032
- Table 24: Indonesia PET Preforms Industry Volume (Billion) Forecast, by Application 2019 & 2032
- Table 25: Vietnam PET Preforms Industry Revenue (Million) Forecast, by Application 2019 & 2032
- Table 26: Vietnam PET Preforms Industry Volume (Billion) Forecast, by Application 2019 & 2032
- Table 27: Rest of Asia Pacific PET Preforms Industry Revenue (Million) Forecast, by Application 2019 & 2032
- Table 28: Rest of Asia Pacific PET Preforms Industry Volume (Billion) Forecast, by Application 2019 & 2032
- Table 29: Global PET Preforms Industry Revenue Million Forecast, by Application 2019 & 2032
- Table 30: Global PET Preforms Industry Volume Billion Forecast, by Application 2019 & 2032
- Table 31: Global PET Preforms Industry Revenue Million Forecast, by Country 2019 & 2032
- Table 32: Global PET Preforms Industry Volume Billion Forecast, by Country 2019 & 2032
- Table 33: United States PET Preforms Industry Revenue (Million) Forecast, by Application 2019 & 2032
- Table 34: United States PET Preforms Industry Volume (Billion) Forecast, by Application 2019 & 2032
- Table 35: Canada PET Preforms Industry Revenue (Million) Forecast, by Application 2019 & 2032
- Table 36: Canada PET Preforms Industry Volume (Billion) Forecast, by Application 2019 & 2032
- Table 37: Mexico PET Preforms Industry Revenue (Million) Forecast, by Application 2019 & 2032
- Table 38: Mexico PET Preforms Industry Volume (Billion) Forecast, by Application 2019 & 2032
- Table 39: Global PET Preforms Industry Revenue Million Forecast, by Application 2019 & 2032
- Table 40: Global PET Preforms Industry Volume Billion Forecast, by Application 2019 & 2032
- Table 41: Global PET Preforms Industry Revenue Million Forecast, by Country 2019 & 2032
- Table 42: Global PET Preforms Industry Volume Billion Forecast, by Country 2019 & 2032
- Table 43: Germany PET Preforms Industry Revenue (Million) Forecast, by Application 2019 & 2032
- Table 44: Germany PET Preforms Industry Volume (Billion) Forecast, by Application 2019 & 2032
- Table 45: United Kingdom PET Preforms Industry Revenue (Million) Forecast, by Application 2019 & 2032
- Table 46: United Kingdom PET Preforms Industry Volume (Billion) Forecast, by Application 2019 & 2032
- Table 47: France PET Preforms Industry Revenue (Million) Forecast, by Application 2019 & 2032
- Table 48: France PET Preforms Industry Volume (Billion) Forecast, by Application 2019 & 2032
- Table 49: Italy PET Preforms Industry Revenue (Million) Forecast, by Application 2019 & 2032
- Table 50: Italy PET Preforms Industry Volume (Billion) Forecast, by Application 2019 & 2032
- Table 51: Spain PET Preforms Industry Revenue (Million) Forecast, by Application 2019 & 2032
- Table 52: Spain PET Preforms Industry Volume (Billion) Forecast, by Application 2019 & 2032
- Table 53: NORDIC Countries PET Preforms Industry Revenue (Million) Forecast, by Application 2019 & 2032
- Table 54: NORDIC Countries PET Preforms Industry Volume (Billion) Forecast, by Application 2019 & 2032
- Table 55: Turkey PET Preforms Industry Revenue (Million) Forecast, by Application 2019 & 2032
- Table 56: Turkey PET Preforms Industry Volume (Billion) Forecast, by Application 2019 & 2032
- Table 57: Russia PET Preforms Industry Revenue (Million) Forecast, by Application 2019 & 2032
- Table 58: Russia PET Preforms Industry Volume (Billion) Forecast, by Application 2019 & 2032
- Table 59: Rest of Europe PET Preforms Industry Revenue (Million) Forecast, by Application 2019 & 2032
- Table 60: Rest of Europe PET Preforms Industry Volume (Billion) Forecast, by Application 2019 & 2032
- Table 61: Global PET Preforms Industry Revenue Million Forecast, by Application 2019 & 2032
- Table 62: Global PET Preforms Industry Volume Billion Forecast, by Application 2019 & 2032
- Table 63: Global PET Preforms Industry Revenue Million Forecast, by Country 2019 & 2032
- Table 64: Global PET Preforms Industry Volume Billion Forecast, by Country 2019 & 2032
- Table 65: Brazil PET Preforms Industry Revenue (Million) Forecast, by Application 2019 & 2032
- Table 66: Brazil PET Preforms Industry Volume (Billion) Forecast, by Application 2019 & 2032
- Table 67: Argentina PET Preforms Industry Revenue (Million) Forecast, by Application 2019 & 2032
- Table 68: Argentina PET Preforms Industry Volume (Billion) Forecast, by Application 2019 & 2032
- Table 69: Colombia PET Preforms Industry Revenue (Million) Forecast, by Application 2019 & 2032
- Table 70: Colombia PET Preforms Industry Volume (Billion) Forecast, by Application 2019 & 2032
- Table 71: Rest of South America PET Preforms Industry Revenue (Million) Forecast, by Application 2019 & 2032
- Table 72: Rest of South America PET Preforms Industry Volume (Billion) Forecast, by Application 2019 & 2032
- Table 73: Global PET Preforms Industry Revenue Million Forecast, by Application 2019 & 2032
- Table 74: Global PET Preforms Industry Volume Billion Forecast, by Application 2019 & 2032
- Table 75: Global PET Preforms Industry Revenue Million Forecast, by Country 2019 & 2032
- Table 76: Global PET Preforms Industry Volume Billion Forecast, by Country 2019 & 2032
- Table 77: Saudi Arabia PET Preforms Industry Revenue (Million) Forecast, by Application 2019 & 2032
- Table 78: Saudi Arabia PET Preforms Industry Volume (Billion) Forecast, by Application 2019 & 2032
- Table 79: Qatar PET Preforms Industry Revenue (Million) Forecast, by Application 2019 & 2032
- Table 80: Qatar PET Preforms Industry Volume (Billion) Forecast, by Application 2019 & 2032
- Table 81: United Arab Emirates PET Preforms Industry Revenue (Million) Forecast, by Application 2019 & 2032
- Table 82: United Arab Emirates PET Preforms Industry Volume (Billion) Forecast, by Application 2019 & 2032
- Table 83: Nigeria PET Preforms Industry Revenue (Million) Forecast, by Application 2019 & 2032
- Table 84: Nigeria PET Preforms Industry Volume (Billion) Forecast, by Application 2019 & 2032
- Table 85: Egypt PET Preforms Industry Revenue (Million) Forecast, by Application 2019 & 2032
- Table 86: Egypt PET Preforms Industry Volume (Billion) Forecast, by Application 2019 & 2032
- Table 87: South Africa PET Preforms Industry Revenue (Million) Forecast, by Application 2019 & 2032
- Table 88: South Africa PET Preforms Industry Volume (Billion) Forecast, by Application 2019 & 2032
- Table 89: Rest of Middle East and Africa PET Preforms Industry Revenue (Million) Forecast, by Application 2019 & 2032
- Table 90: Rest of Middle East and Africa PET Preforms Industry Volume (Billion) Forecast, by Application 2019 & 2032
Frequently Asked Questions
1. What is the projected Compound Annual Growth Rate (CAGR) of the PET Preforms Industry?
The projected CAGR is approximately 2.23%.
2. Which companies are prominent players in the PET Preforms Industry?
Key companies in the market include Chemco, Esterform Ltd, Fresh Pet, Indorama Ventures Public Company Limited, KOKSAN Pet Packaging Ind Co, OZEMBAL, Plastipak Holdings Inc, Polisan Hellas, RESILUX NV, RETAL Industries Ltd, SGT, TPAC PACKAGING INDIA PRIVATE LIMITED, Valgroup, Varioform PET, Winley Polymers Pvt Ltd*List Not Exhaustive.
3. What are the main segments of the PET Preforms Industry?
The market segments include Application.
4. Can you provide details about the market size?
The market size is estimated to be USD 22.86 Million as of 2022.
5. What are some drivers contributing to market growth?
Increasing Demand from Food and Beverage Applications; High Consumption of Carbonated Soft Drinks and Water; Other Drivers.
6. What are the notable trends driving market growth?
Carbonated Soft Drinks and Water to Dominate the Market.
7. Are there any restraints impacting market growth?
Increasing Demand from Food and Beverage Applications; High Consumption of Carbonated Soft Drinks and Water; Other Drivers.
8. Can you provide examples of recent developments in the market?
May 2024: Retal Industries Ltd forged a new industrial partnership with Polymer Industries LLC, operating under the trade name Orzuplast. Based in Uzbekistan, Orzuplast specializes in packaging solutions for both local and neighboring markets. With this collaboration, RETAL expanded its partner network and enhanced its service capabilities for the global food and beverage packaging industries by offering its PET preforms and related products.October 2023: Valgroup acquired Garda Plast Group (GP Group), significantly expanding into the Italian PET preforms market. Specializing in the production of both PET and rPET preforms, GP Group's integration bolstered Valgroup's foothold in Italy. This move fortified Valgroup's ties with local suppliers and enhanced its ability to cater to regional customers with greater depth and breadth.September 2023: Retal Czech commenced the production of monolayer preforms at its Melnik facility. The 26/22 GME 30.37 preform, offered in various weights, is perfectly tailored for European markets, catering to carbonated and non-carbonated beverages that utilize this specific neck finish. This latest addition broadened its portfolio, enabling it to cater to local clientele and neighboring European countries.
9. What pricing options are available for accessing the report?
Pricing options include single-user, multi-user, and enterprise licenses priced at USD 4750, USD 5250, and USD 8750 respectively.
10. Is the market size provided in terms of value or volume?
The market size is provided in terms of value, measured in Million and volume, measured in Billion.
11. Are there any specific market keywords associated with the report?
Yes, the market keyword associated with the report is "PET Preforms Industry," which aids in identifying and referencing the specific market segment covered.
12. How do I determine which pricing option suits my needs best?
The pricing options vary based on user requirements and access needs. Individual users may opt for single-user licenses, while businesses requiring broader access may choose multi-user or enterprise licenses for cost-effective access to the report.
13. Are there any additional resources or data provided in the PET Preforms Industry report?
While the report offers comprehensive insights, it's advisable to review the specific contents or supplementary materials provided to ascertain if additional resources or data are available.
14. How can I stay updated on further developments or reports in the PET Preforms Industry?
To stay informed about further developments, trends, and reports in the PET Preforms Industry, consider subscribing to industry newsletters, following relevant companies and organizations, or regularly checking reputable industry news sources and publications.
Methodology
Step 1 - Identification of Relevant Samples Size from Population Database


Step 2 - Approaches for Defining Global Market Size (Value, Volume* & Price*)

Note*: In applicable scenarios
Step 3 - Data Sources
Primary Research
- Web Analytics
- Survey Reports
- Research Institute
- Latest Research Reports
- Opinion Leaders
Secondary Research
- Annual Reports
- White Paper
- Latest Press Release
- Industry Association
- Paid Database
- Investor Presentations

Step 4 - Data Triangulation
Involves using different sources of information in order to increase the validity of a study
These sources are likely to be stakeholders in a program - participants, other researchers, program staff, other community members, and so on.
Then we put all data in single framework & apply various statistical tools to find out the dynamic on the market.
During the analysis stage, feedback from the stakeholder groups would be compared to determine areas of agreement as well as areas of divergence


