
Key Insights
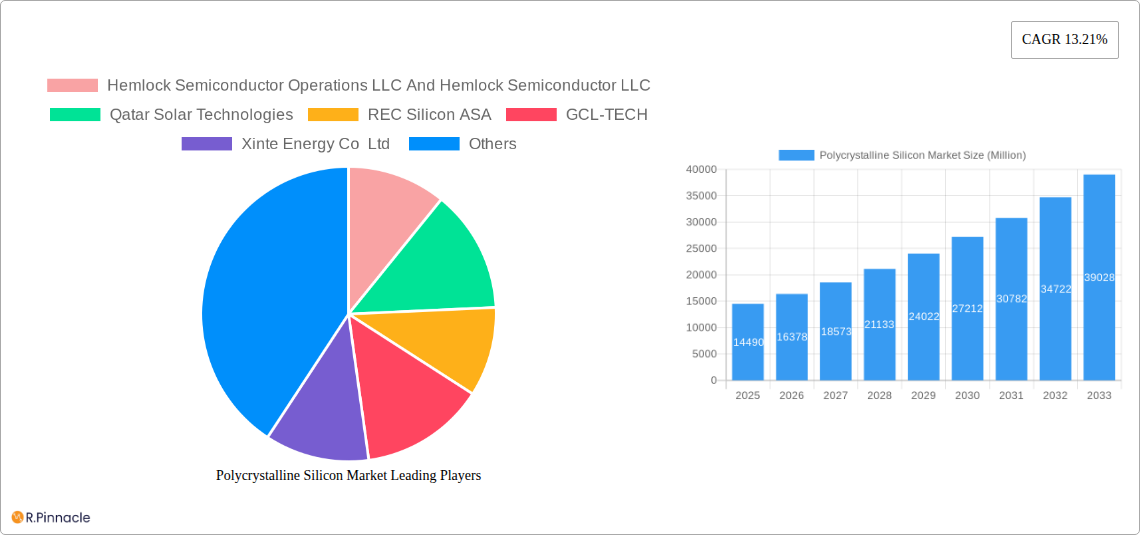
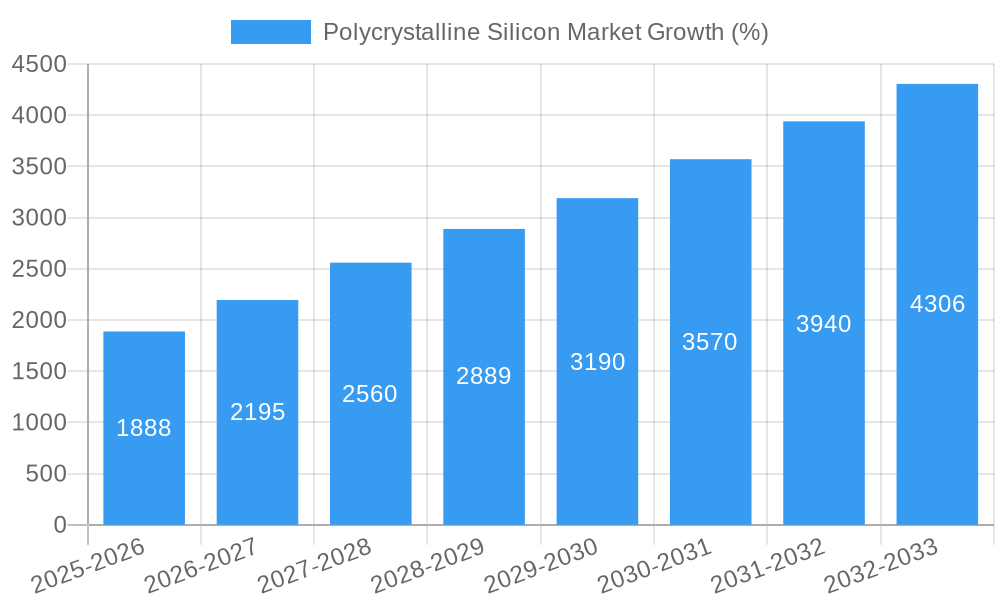
The polycrystalline silicon (polysilicon) market, valued at $14.49 billion in 2025, is projected to experience robust growth, driven by the burgeoning solar photovoltaic (PV) industry and the increasing demand for electronics. A compound annual growth rate (CAGR) of 13.21% from 2025 to 2033 indicates a significant expansion of the market, reaching an estimated value exceeding $45 billion by 2033. This growth is primarily fueled by the escalating global energy transition towards renewable sources, with solar energy playing a pivotal role. Government incentives, supportive policies promoting clean energy adoption, and declining polysilicon production costs are further accelerating market expansion. The increasing integration of polysilicon in advanced electronics, particularly semiconductors, represents another significant driver. While challenges such as fluctuating raw material prices and geopolitical factors may pose some restraints, the overall market outlook remains positive, underpinned by the long-term growth trajectory of the solar and electronics sectors.
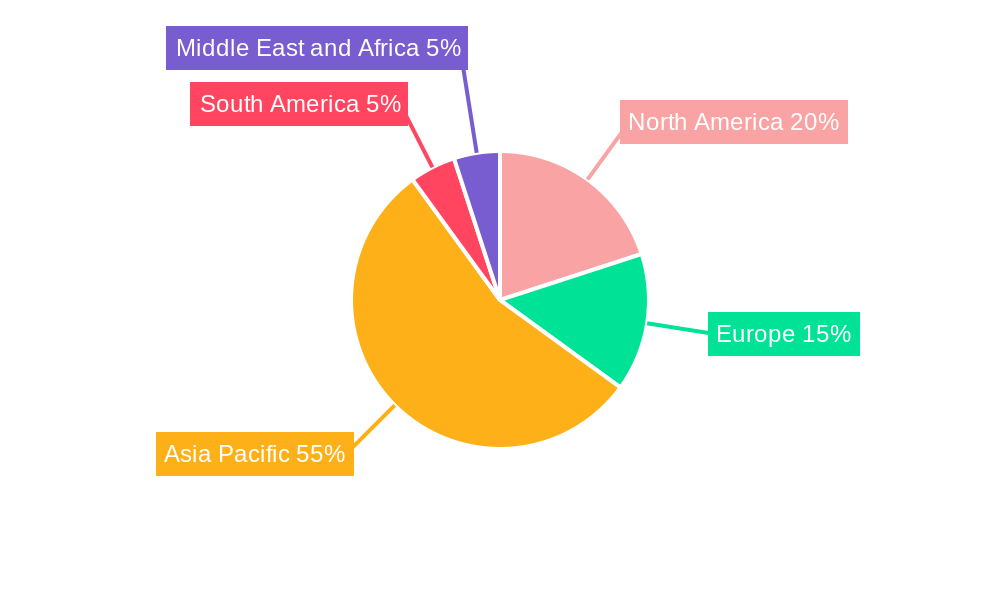
Significant regional variations exist within the polycrystalline silicon market. Asia-Pacific, particularly China, is expected to maintain its dominant position due to its substantial manufacturing capacity and large-scale solar energy initiatives. North America and Europe will also contribute significantly, driven by robust demand from both the solar and electronics industries. However, emerging markets in South America, the Middle East, and Africa are anticipated to witness accelerated growth, fueled by rising energy demands and increasing investments in renewable energy infrastructure. The competitive landscape is characterized by major players like Hemlock Semiconductor, REC Silicon, GCL-TECH, and Daqo New Energy, alongside several other significant regional producers. Continuous innovation in polysilicon production technologies, aimed at improving efficiency and lowering costs, will be crucial for maintaining a competitive edge in this rapidly evolving market.
Polycrystalline Silicon Market Report: 2019-2033
This comprehensive report provides a detailed analysis of the Polycrystalline Silicon market, offering actionable insights for industry professionals and investors. Covering the period 2019-2033, with a focus on 2025, this report delves into market dynamics, competitive landscapes, and future growth potential. The report leverages extensive data and analysis to provide a clear understanding of this crucial sector within the renewable energy and electronics industries.
Polycrystalline Silicon Market Structure & Innovation Trends
The polycrystalline silicon market exhibits a moderately concentrated structure, with key players holding significant market share. Hemlock Semiconductor Operations LLC and Hemlock Semiconductor LLC, REC Silicon ASA, GCL-TECH, and Daqo New Energy Co Ltd are among the leading companies, each contributing significantly to the overall production capacity. Market share analysis reveals a competitive landscape with ongoing mergers and acquisitions (M&A) activity influencing market dynamics. For example, in 2022, M&A deal values reached approximately xx Million USD, indicating significant consolidation efforts within the industry.
- Market Concentration: Moderately concentrated, with top 5 players holding xx% market share (2024).
- Innovation Drivers: Increasing demand for solar energy, advancements in polysilicon production technology, and the drive for higher efficiency in electronic components.
- Regulatory Frameworks: Government policies promoting renewable energy adoption and stricter environmental regulations influence production methods and market growth.
- Product Substitutes: While limited, alternative materials are being researched and developed, potentially influencing market dynamics in the long term.
- End-User Demographics: Primarily driven by the solar PV industry, with a growing contribution from the electronics sector.
- M&A Activities: Significant M&A activity has been observed in recent years, impacting market consolidation and competitive dynamics.
Polycrystalline Silicon Market Dynamics & Trends
The polycrystalline silicon market is experiencing robust growth, driven by the expanding global solar power industry and increasing demand for electronic components. The compound annual growth rate (CAGR) is projected to be xx% from 2025 to 2033, fueled by several key factors. Technological advancements, including improved production processes and higher purity silicon, are enhancing efficiency and reducing costs. Consumer preferences for renewable energy sources and supportive government policies are driving market penetration, with the market size expected to reach xx Million USD by 2033. Competitive dynamics are characterized by price competition and technological innovation, fostering constant improvement within the industry. Market penetration in the solar PV sector is estimated at xx% in 2025, with projections indicating substantial growth in the coming years.
Dominant Regions & Segments in Polycrystalline Silicon Market
The Asia-Pacific region currently dominates the polycrystalline silicon market, driven by strong demand from China and other rapidly developing economies. China's substantial investment in solar energy infrastructure and supportive government policies have established it as the leading market.
- Key Drivers in Asia-Pacific:
- Massive investments in renewable energy infrastructure.
- Favorable government policies and incentives.
- Rapid growth of the solar PV industry.
- Cost-effective manufacturing capabilities.
- Solar PV Segment: This segment is the largest end-user industry, accounting for approximately xx% of market demand, driven by the global push towards renewable energy.
- Multicrystalline Solar Panel Segment (Electronics): The electronics sector is a growing segment, with demand projected to increase at a CAGR of xx% due to increasing demand for higher efficiency electronic components. This segment shows promising growth due to the miniaturization trends in electronics and the need for higher performing semiconductors.
The dominance of Asia-Pacific is attributed to several factors, including large-scale manufacturing facilities, significant government support for renewable energy initiatives, and a robust domestic solar power industry. The cost-effectiveness of production within this region further enhances its leading position.
Polycrystalline Silicon Market Product Innovations
Recent innovations focus on improving the efficiency of polysilicon production, reducing impurities, and enhancing the quality of the final product. These advancements are crucial for improving the performance of solar panels and electronic components. Technological trends emphasize sustainable manufacturing practices, alongside cost reductions. The market fit for these innovations is exceptionally high given the increasing global demand for renewable energy and the persistent need for higher-quality semiconductors.
Report Scope & Segmentation Analysis
This report segments the polycrystalline silicon market by end-user industry (Solar PV, Electronics – Multicrystalline Solar Panels) and geography. The Solar PV segment is projected to dominate, with significant growth anticipated in the forecast period due to rising global energy demands and supportive government policies. The Electronics segment is expected to experience steady growth driven by the increasing demand for higher-efficiency semiconductors in various applications. Each segment displays unique competitive dynamics and growth projections. Market size and growth rates are provided for each segment in detailed tables within the full report.
Key Drivers of Polycrystalline Silicon Market Growth
The growth of the polycrystalline silicon market is primarily driven by the global push toward renewable energy, particularly solar power. The increasing demand for solar energy worldwide, coupled with favorable government policies and subsidies, has fueled significant growth. Technological advancements leading to higher efficiency and lower costs of polysilicon production further stimulate market expansion. Furthermore, the increasing use of polysilicon in the electronics industry contributes to market growth.
Challenges in the Polycrystalline Silicon Market Sector
Challenges include fluctuations in raw material prices, stringent environmental regulations impacting production costs, and intense competition among manufacturers. Supply chain disruptions can also significantly impact production and availability. The market is impacted by price volatility of raw silicon and energy costs. The environmental impact of manufacturing processes also poses significant challenges that need to be addressed.
Emerging Opportunities in Polycrystalline Silicon Market
Emerging opportunities lie in developing innovative production technologies, focusing on cost reduction and improved efficiency. The exploration of new applications for polysilicon, alongside expanding into emerging markets, offers significant growth potential. Further, improvements in recycling and reuse technologies could significantly contribute to market expansion and enhance sustainability.
Leading Players in the Polycrystalline Silicon Market Market
- Hemlock Semiconductor Operations LLC And Hemlock Semiconductor LLC
- Qatar Solar Technologies
- REC Silicon ASA
- GCL-TECH
- Xinte Energy Co Ltd
- Tokuyama Corporation
- Asia Silicon (Qinghai) Co Ltd
- Daqo New Energy Co Ltd
- Sichuan Yongxiang Co Ltd (Tongwei)
- OCI Company Ltd
- Wacker Chemie AG
- Mitsubishi Polycrystalline Silicon America Corporation
Key Developments in Polycrystalline Silicon Market Industry
- August 2022: REC Silicon ASA and Mississippi Silicon collaborated to develop a solar supply chain in the United States, aiming to bolster domestic polysilicon production and reduce reliance on foreign sources.
- April 2022: OCI Company Ltd secured a USD 1.2 Billion order from Hanwha Solutions for polysilicon supply, demonstrating strong market demand and boosting OCI's profitability.
These developments highlight the strategic investments and collaborations within the industry, driving both supply chain development and increasing production capacity.
Future Outlook for Polycrystalline Silicon Market Market
The future outlook for the polycrystalline silicon market is highly positive, driven by continued growth in the solar PV and electronics sectors. The increasing demand for renewable energy, coupled with ongoing technological advancements leading to cost reductions and improved efficiency, ensures sustained market expansion. Strategic partnerships and investments in research and development will further propel market growth in the coming years. Expanding into emerging markets and developing sustainable production methods will present key strategic opportunities for market players.
Polycrystalline Silicon Market Segmentation
-
1. End-user Industry
-
1.1. Solar PV
- 1.1.1. Monocrystalline Solar Panel
- 1.1.2. Multicrystalline Solar Panel
- 1.2. Electronics (Semiconductor)
-
1.1. Solar PV
Polycrystalline Silicon Market Segmentation By Geography
-
1. Asia Pacific
- 1.1. China
- 1.2. India
- 1.3. Japan
- 1.4. South Korea
- 1.5. Rest of Asia Pacific
-
2. North America
- 2.1. United States
- 2.2. Canada
- 2.3. Mexico
-
3. Europe
- 3.1. Germany
- 3.2. United Kingdom
- 3.3. Italy
- 3.4. France
- 3.5. Rest of Europe
-
4. South America
- 4.1. Brazil
- 4.2. Argentina
- 4.3. Rest of South America
-
5. Middle East and Africa
- 5.1. Saudi Arabia
- 5.2. South Africa
- 5.3. Rest of Middle East and Africa
Polycrystalline Silicon Market REPORT HIGHLIGHTS
| Aspects | Details |
|---|---|
| Study Period | 2019-2033 |
| Base Year | 2024 |
| Estimated Year | 2025 |
| Forecast Period | 2025-2033 |
| Historical Period | 2019-2024 |
| Growth Rate | CAGR of 13.21% from 2019-2033 |
| Segmentation |
|
Table of Contents
- 1. Introduction
- 1.1. Research Scope
- 1.2. Market Segmentation
- 1.3. Research Methodology
- 1.4. Definitions and Assumptions
- 2. Executive Summary
- 2.1. Introduction
- 3. Market Dynamics
- 3.1. Introduction
- 3.2. Market Drivers
- 3.2.1. Increasing Number of Solar PV Installation; Growth in the Semiconductor Industry
- 3.3. Market Restrains
- 3.3.1 Emerging Competitors
- 3.3.2 such as Upgraded Metallurgical-grade Silicon (UMG-Si) Solar Cell; High Capital Expenditure
- 3.4. Market Trends
- 3.4.1. Growing Demand from the Solar PV Industry
- 4. Market Factor Analysis
- 4.1. Porters Five Forces
- 4.2. Supply/Value Chain
- 4.3. PESTEL analysis
- 4.4. Market Entropy
- 4.5. Patent/Trademark Analysis
- 5. Global Polycrystalline Silicon Market Analysis, Insights and Forecast, 2019-2031
- 5.1. Market Analysis, Insights and Forecast - by End-user Industry
- 5.1.1. Solar PV
- 5.1.1.1. Monocrystalline Solar Panel
- 5.1.1.2. Multicrystalline Solar Panel
- 5.1.2. Electronics (Semiconductor)
- 5.1.1. Solar PV
- 5.2. Market Analysis, Insights and Forecast - by Region
- 5.2.1. Asia Pacific
- 5.2.2. North America
- 5.2.3. Europe
- 5.2.4. South America
- 5.2.5. Middle East and Africa
- 5.1. Market Analysis, Insights and Forecast - by End-user Industry
- 6. Asia Pacific Polycrystalline Silicon Market Analysis, Insights and Forecast, 2019-2031
- 6.1. Market Analysis, Insights and Forecast - by End-user Industry
- 6.1.1. Solar PV
- 6.1.1.1. Monocrystalline Solar Panel
- 6.1.1.2. Multicrystalline Solar Panel
- 6.1.2. Electronics (Semiconductor)
- 6.1.1. Solar PV
- 6.1. Market Analysis, Insights and Forecast - by End-user Industry
- 7. North America Polycrystalline Silicon Market Analysis, Insights and Forecast, 2019-2031
- 7.1. Market Analysis, Insights and Forecast - by End-user Industry
- 7.1.1. Solar PV
- 7.1.1.1. Monocrystalline Solar Panel
- 7.1.1.2. Multicrystalline Solar Panel
- 7.1.2. Electronics (Semiconductor)
- 7.1.1. Solar PV
- 7.1. Market Analysis, Insights and Forecast - by End-user Industry
- 8. Europe Polycrystalline Silicon Market Analysis, Insights and Forecast, 2019-2031
- 8.1. Market Analysis, Insights and Forecast - by End-user Industry
- 8.1.1. Solar PV
- 8.1.1.1. Monocrystalline Solar Panel
- 8.1.1.2. Multicrystalline Solar Panel
- 8.1.2. Electronics (Semiconductor)
- 8.1.1. Solar PV
- 8.1. Market Analysis, Insights and Forecast - by End-user Industry
- 9. South America Polycrystalline Silicon Market Analysis, Insights and Forecast, 2019-2031
- 9.1. Market Analysis, Insights and Forecast - by End-user Industry
- 9.1.1. Solar PV
- 9.1.1.1. Monocrystalline Solar Panel
- 9.1.1.2. Multicrystalline Solar Panel
- 9.1.2. Electronics (Semiconductor)
- 9.1.1. Solar PV
- 9.1. Market Analysis, Insights and Forecast - by End-user Industry
- 10. Middle East and Africa Polycrystalline Silicon Market Analysis, Insights and Forecast, 2019-2031
- 10.1. Market Analysis, Insights and Forecast - by End-user Industry
- 10.1.1. Solar PV
- 10.1.1.1. Monocrystalline Solar Panel
- 10.1.1.2. Multicrystalline Solar Panel
- 10.1.2. Electronics (Semiconductor)
- 10.1.1. Solar PV
- 10.1. Market Analysis, Insights and Forecast - by End-user Industry
- 11. Asia Pacific Polycrystalline Silicon Market Analysis, Insights and Forecast, 2019-2031
- 11.1. Market Analysis, Insights and Forecast - By Country/Sub-region
- 11.1.1 China
- 11.1.2 India
- 11.1.3 Japan
- 11.1.4 South Korea
- 11.1.5 Rest of Asia Pacific
- 12. North America Polycrystalline Silicon Market Analysis, Insights and Forecast, 2019-2031
- 12.1. Market Analysis, Insights and Forecast - By Country/Sub-region
- 12.1.1 United States
- 12.1.2 Canada
- 12.1.3 Mexico
- 13. Europe Polycrystalline Silicon Market Analysis, Insights and Forecast, 2019-2031
- 13.1. Market Analysis, Insights and Forecast - By Country/Sub-region
- 13.1.1 Germany
- 13.1.2 United Kingdom
- 13.1.3 Italy
- 13.1.4 France
- 13.1.5 Rest of Europe
- 14. South America Polycrystalline Silicon Market Analysis, Insights and Forecast, 2019-2031
- 14.1. Market Analysis, Insights and Forecast - By Country/Sub-region
- 14.1.1 Brazil
- 14.1.2 Argentina
- 14.1.3 Rest of South America
- 15. Middle East and Africa Polycrystalline Silicon Market Analysis, Insights and Forecast, 2019-2031
- 15.1. Market Analysis, Insights and Forecast - By Country/Sub-region
- 15.1.1 Saudi Arabia
- 15.1.2 South Africa
- 15.1.3 Rest of Middle East and Africa
- 16. Competitive Analysis
- 16.1. Global Market Share Analysis 2024
- 16.2. Company Profiles
- 16.2.1 Hemlock Semiconductor Operations LLC And Hemlock Semiconductor LLC
- 16.2.1.1. Overview
- 16.2.1.2. Products
- 16.2.1.3. SWOT Analysis
- 16.2.1.4. Recent Developments
- 16.2.1.5. Financials (Based on Availability)
- 16.2.2 Qatar Solar Technologies
- 16.2.2.1. Overview
- 16.2.2.2. Products
- 16.2.2.3. SWOT Analysis
- 16.2.2.4. Recent Developments
- 16.2.2.5. Financials (Based on Availability)
- 16.2.3 REC Silicon ASA
- 16.2.3.1. Overview
- 16.2.3.2. Products
- 16.2.3.3. SWOT Analysis
- 16.2.3.4. Recent Developments
- 16.2.3.5. Financials (Based on Availability)
- 16.2.4 GCL-TECH
- 16.2.4.1. Overview
- 16.2.4.2. Products
- 16.2.4.3. SWOT Analysis
- 16.2.4.4. Recent Developments
- 16.2.4.5. Financials (Based on Availability)
- 16.2.5 Xinte Energy Co Ltd
- 16.2.5.1. Overview
- 16.2.5.2. Products
- 16.2.5.3. SWOT Analysis
- 16.2.5.4. Recent Developments
- 16.2.5.5. Financials (Based on Availability)
- 16.2.6 Tokuyama Corporation
- 16.2.6.1. Overview
- 16.2.6.2. Products
- 16.2.6.3. SWOT Analysis
- 16.2.6.4. Recent Developments
- 16.2.6.5. Financials (Based on Availability)
- 16.2.7 Asia Silicon (Qinghai) Co Ltd
- 16.2.7.1. Overview
- 16.2.7.2. Products
- 16.2.7.3. SWOT Analysis
- 16.2.7.4. Recent Developments
- 16.2.7.5. Financials (Based on Availability)
- 16.2.8 Daqo New Energy Co Ltd
- 16.2.8.1. Overview
- 16.2.8.2. Products
- 16.2.8.3. SWOT Analysis
- 16.2.8.4. Recent Developments
- 16.2.8.5. Financials (Based on Availability)
- 16.2.9 Sichuan Yongxiang Co Ltd (Tongwei)
- 16.2.9.1. Overview
- 16.2.9.2. Products
- 16.2.9.3. SWOT Analysis
- 16.2.9.4. Recent Developments
- 16.2.9.5. Financials (Based on Availability)
- 16.2.10 OCI Company Ltd
- 16.2.10.1. Overview
- 16.2.10.2. Products
- 16.2.10.3. SWOT Analysis
- 16.2.10.4. Recent Developments
- 16.2.10.5. Financials (Based on Availability)
- 16.2.11 Wacker Chemie AG
- 16.2.11.1. Overview
- 16.2.11.2. Products
- 16.2.11.3. SWOT Analysis
- 16.2.11.4. Recent Developments
- 16.2.11.5. Financials (Based on Availability)
- 16.2.12 Mitsubishi Polycrystalline Silicon America Corporation
- 16.2.12.1. Overview
- 16.2.12.2. Products
- 16.2.12.3. SWOT Analysis
- 16.2.12.4. Recent Developments
- 16.2.12.5. Financials (Based on Availability)
- 16.2.1 Hemlock Semiconductor Operations LLC And Hemlock Semiconductor LLC
List of Figures
- Figure 1: Global Polycrystalline Silicon Market Revenue Breakdown (Million, %) by Region 2024 & 2032
- Figure 2: Global Polycrystalline Silicon Market Volume Breakdown (K Tons, %) by Region 2024 & 2032
- Figure 3: Asia Pacific Polycrystalline Silicon Market Revenue (Million), by Country 2024 & 2032
- Figure 4: Asia Pacific Polycrystalline Silicon Market Volume (K Tons), by Country 2024 & 2032
- Figure 5: Asia Pacific Polycrystalline Silicon Market Revenue Share (%), by Country 2024 & 2032
- Figure 6: Asia Pacific Polycrystalline Silicon Market Volume Share (%), by Country 2024 & 2032
- Figure 7: North America Polycrystalline Silicon Market Revenue (Million), by Country 2024 & 2032
- Figure 8: North America Polycrystalline Silicon Market Volume (K Tons), by Country 2024 & 2032
- Figure 9: North America Polycrystalline Silicon Market Revenue Share (%), by Country 2024 & 2032
- Figure 10: North America Polycrystalline Silicon Market Volume Share (%), by Country 2024 & 2032
- Figure 11: Europe Polycrystalline Silicon Market Revenue (Million), by Country 2024 & 2032
- Figure 12: Europe Polycrystalline Silicon Market Volume (K Tons), by Country 2024 & 2032
- Figure 13: Europe Polycrystalline Silicon Market Revenue Share (%), by Country 2024 & 2032
- Figure 14: Europe Polycrystalline Silicon Market Volume Share (%), by Country 2024 & 2032
- Figure 15: South America Polycrystalline Silicon Market Revenue (Million), by Country 2024 & 2032
- Figure 16: South America Polycrystalline Silicon Market Volume (K Tons), by Country 2024 & 2032
- Figure 17: South America Polycrystalline Silicon Market Revenue Share (%), by Country 2024 & 2032
- Figure 18: South America Polycrystalline Silicon Market Volume Share (%), by Country 2024 & 2032
- Figure 19: Middle East and Africa Polycrystalline Silicon Market Revenue (Million), by Country 2024 & 2032
- Figure 20: Middle East and Africa Polycrystalline Silicon Market Volume (K Tons), by Country 2024 & 2032
- Figure 21: Middle East and Africa Polycrystalline Silicon Market Revenue Share (%), by Country 2024 & 2032
- Figure 22: Middle East and Africa Polycrystalline Silicon Market Volume Share (%), by Country 2024 & 2032
- Figure 23: Asia Pacific Polycrystalline Silicon Market Revenue (Million), by End-user Industry 2024 & 2032
- Figure 24: Asia Pacific Polycrystalline Silicon Market Volume (K Tons), by End-user Industry 2024 & 2032
- Figure 25: Asia Pacific Polycrystalline Silicon Market Revenue Share (%), by End-user Industry 2024 & 2032
- Figure 26: Asia Pacific Polycrystalline Silicon Market Volume Share (%), by End-user Industry 2024 & 2032
- Figure 27: Asia Pacific Polycrystalline Silicon Market Revenue (Million), by Country 2024 & 2032
- Figure 28: Asia Pacific Polycrystalline Silicon Market Volume (K Tons), by Country 2024 & 2032
- Figure 29: Asia Pacific Polycrystalline Silicon Market Revenue Share (%), by Country 2024 & 2032
- Figure 30: Asia Pacific Polycrystalline Silicon Market Volume Share (%), by Country 2024 & 2032
- Figure 31: North America Polycrystalline Silicon Market Revenue (Million), by End-user Industry 2024 & 2032
- Figure 32: North America Polycrystalline Silicon Market Volume (K Tons), by End-user Industry 2024 & 2032
- Figure 33: North America Polycrystalline Silicon Market Revenue Share (%), by End-user Industry 2024 & 2032
- Figure 34: North America Polycrystalline Silicon Market Volume Share (%), by End-user Industry 2024 & 2032
- Figure 35: North America Polycrystalline Silicon Market Revenue (Million), by Country 2024 & 2032
- Figure 36: North America Polycrystalline Silicon Market Volume (K Tons), by Country 2024 & 2032
- Figure 37: North America Polycrystalline Silicon Market Revenue Share (%), by Country 2024 & 2032
- Figure 38: North America Polycrystalline Silicon Market Volume Share (%), by Country 2024 & 2032
- Figure 39: Europe Polycrystalline Silicon Market Revenue (Million), by End-user Industry 2024 & 2032
- Figure 40: Europe Polycrystalline Silicon Market Volume (K Tons), by End-user Industry 2024 & 2032
- Figure 41: Europe Polycrystalline Silicon Market Revenue Share (%), by End-user Industry 2024 & 2032
- Figure 42: Europe Polycrystalline Silicon Market Volume Share (%), by End-user Industry 2024 & 2032
- Figure 43: Europe Polycrystalline Silicon Market Revenue (Million), by Country 2024 & 2032
- Figure 44: Europe Polycrystalline Silicon Market Volume (K Tons), by Country 2024 & 2032
- Figure 45: Europe Polycrystalline Silicon Market Revenue Share (%), by Country 2024 & 2032
- Figure 46: Europe Polycrystalline Silicon Market Volume Share (%), by Country 2024 & 2032
- Figure 47: South America Polycrystalline Silicon Market Revenue (Million), by End-user Industry 2024 & 2032
- Figure 48: South America Polycrystalline Silicon Market Volume (K Tons), by End-user Industry 2024 & 2032
- Figure 49: South America Polycrystalline Silicon Market Revenue Share (%), by End-user Industry 2024 & 2032
- Figure 50: South America Polycrystalline Silicon Market Volume Share (%), by End-user Industry 2024 & 2032
- Figure 51: South America Polycrystalline Silicon Market Revenue (Million), by Country 2024 & 2032
- Figure 52: South America Polycrystalline Silicon Market Volume (K Tons), by Country 2024 & 2032
- Figure 53: South America Polycrystalline Silicon Market Revenue Share (%), by Country 2024 & 2032
- Figure 54: South America Polycrystalline Silicon Market Volume Share (%), by Country 2024 & 2032
- Figure 55: Middle East and Africa Polycrystalline Silicon Market Revenue (Million), by End-user Industry 2024 & 2032
- Figure 56: Middle East and Africa Polycrystalline Silicon Market Volume (K Tons), by End-user Industry 2024 & 2032
- Figure 57: Middle East and Africa Polycrystalline Silicon Market Revenue Share (%), by End-user Industry 2024 & 2032
- Figure 58: Middle East and Africa Polycrystalline Silicon Market Volume Share (%), by End-user Industry 2024 & 2032
- Figure 59: Middle East and Africa Polycrystalline Silicon Market Revenue (Million), by Country 2024 & 2032
- Figure 60: Middle East and Africa Polycrystalline Silicon Market Volume (K Tons), by Country 2024 & 2032
- Figure 61: Middle East and Africa Polycrystalline Silicon Market Revenue Share (%), by Country 2024 & 2032
- Figure 62: Middle East and Africa Polycrystalline Silicon Market Volume Share (%), by Country 2024 & 2032
List of Tables
- Table 1: Global Polycrystalline Silicon Market Revenue Million Forecast, by Region 2019 & 2032
- Table 2: Global Polycrystalline Silicon Market Volume K Tons Forecast, by Region 2019 & 2032
- Table 3: Global Polycrystalline Silicon Market Revenue Million Forecast, by End-user Industry 2019 & 2032
- Table 4: Global Polycrystalline Silicon Market Volume K Tons Forecast, by End-user Industry 2019 & 2032
- Table 5: Global Polycrystalline Silicon Market Revenue Million Forecast, by Region 2019 & 2032
- Table 6: Global Polycrystalline Silicon Market Volume K Tons Forecast, by Region 2019 & 2032
- Table 7: Global Polycrystalline Silicon Market Revenue Million Forecast, by Country 2019 & 2032
- Table 8: Global Polycrystalline Silicon Market Volume K Tons Forecast, by Country 2019 & 2032
- Table 9: China Polycrystalline Silicon Market Revenue (Million) Forecast, by Application 2019 & 2032
- Table 10: China Polycrystalline Silicon Market Volume (K Tons) Forecast, by Application 2019 & 2032
- Table 11: India Polycrystalline Silicon Market Revenue (Million) Forecast, by Application 2019 & 2032
- Table 12: India Polycrystalline Silicon Market Volume (K Tons) Forecast, by Application 2019 & 2032
- Table 13: Japan Polycrystalline Silicon Market Revenue (Million) Forecast, by Application 2019 & 2032
- Table 14: Japan Polycrystalline Silicon Market Volume (K Tons) Forecast, by Application 2019 & 2032
- Table 15: South Korea Polycrystalline Silicon Market Revenue (Million) Forecast, by Application 2019 & 2032
- Table 16: South Korea Polycrystalline Silicon Market Volume (K Tons) Forecast, by Application 2019 & 2032
- Table 17: Rest of Asia Pacific Polycrystalline Silicon Market Revenue (Million) Forecast, by Application 2019 & 2032
- Table 18: Rest of Asia Pacific Polycrystalline Silicon Market Volume (K Tons) Forecast, by Application 2019 & 2032
- Table 19: Global Polycrystalline Silicon Market Revenue Million Forecast, by Country 2019 & 2032
- Table 20: Global Polycrystalline Silicon Market Volume K Tons Forecast, by Country 2019 & 2032
- Table 21: United States Polycrystalline Silicon Market Revenue (Million) Forecast, by Application 2019 & 2032
- Table 22: United States Polycrystalline Silicon Market Volume (K Tons) Forecast, by Application 2019 & 2032
- Table 23: Canada Polycrystalline Silicon Market Revenue (Million) Forecast, by Application 2019 & 2032
- Table 24: Canada Polycrystalline Silicon Market Volume (K Tons) Forecast, by Application 2019 & 2032
- Table 25: Mexico Polycrystalline Silicon Market Revenue (Million) Forecast, by Application 2019 & 2032
- Table 26: Mexico Polycrystalline Silicon Market Volume (K Tons) Forecast, by Application 2019 & 2032
- Table 27: Global Polycrystalline Silicon Market Revenue Million Forecast, by Country 2019 & 2032
- Table 28: Global Polycrystalline Silicon Market Volume K Tons Forecast, by Country 2019 & 2032
- Table 29: Germany Polycrystalline Silicon Market Revenue (Million) Forecast, by Application 2019 & 2032
- Table 30: Germany Polycrystalline Silicon Market Volume (K Tons) Forecast, by Application 2019 & 2032
- Table 31: United Kingdom Polycrystalline Silicon Market Revenue (Million) Forecast, by Application 2019 & 2032
- Table 32: United Kingdom Polycrystalline Silicon Market Volume (K Tons) Forecast, by Application 2019 & 2032
- Table 33: Italy Polycrystalline Silicon Market Revenue (Million) Forecast, by Application 2019 & 2032
- Table 34: Italy Polycrystalline Silicon Market Volume (K Tons) Forecast, by Application 2019 & 2032
- Table 35: France Polycrystalline Silicon Market Revenue (Million) Forecast, by Application 2019 & 2032
- Table 36: France Polycrystalline Silicon Market Volume (K Tons) Forecast, by Application 2019 & 2032
- Table 37: Rest of Europe Polycrystalline Silicon Market Revenue (Million) Forecast, by Application 2019 & 2032
- Table 38: Rest of Europe Polycrystalline Silicon Market Volume (K Tons) Forecast, by Application 2019 & 2032
- Table 39: Global Polycrystalline Silicon Market Revenue Million Forecast, by Country 2019 & 2032
- Table 40: Global Polycrystalline Silicon Market Volume K Tons Forecast, by Country 2019 & 2032
- Table 41: Brazil Polycrystalline Silicon Market Revenue (Million) Forecast, by Application 2019 & 2032
- Table 42: Brazil Polycrystalline Silicon Market Volume (K Tons) Forecast, by Application 2019 & 2032
- Table 43: Argentina Polycrystalline Silicon Market Revenue (Million) Forecast, by Application 2019 & 2032
- Table 44: Argentina Polycrystalline Silicon Market Volume (K Tons) Forecast, by Application 2019 & 2032
- Table 45: Rest of South America Polycrystalline Silicon Market Revenue (Million) Forecast, by Application 2019 & 2032
- Table 46: Rest of South America Polycrystalline Silicon Market Volume (K Tons) Forecast, by Application 2019 & 2032
- Table 47: Global Polycrystalline Silicon Market Revenue Million Forecast, by Country 2019 & 2032
- Table 48: Global Polycrystalline Silicon Market Volume K Tons Forecast, by Country 2019 & 2032
- Table 49: Saudi Arabia Polycrystalline Silicon Market Revenue (Million) Forecast, by Application 2019 & 2032
- Table 50: Saudi Arabia Polycrystalline Silicon Market Volume (K Tons) Forecast, by Application 2019 & 2032
- Table 51: South Africa Polycrystalline Silicon Market Revenue (Million) Forecast, by Application 2019 & 2032
- Table 52: South Africa Polycrystalline Silicon Market Volume (K Tons) Forecast, by Application 2019 & 2032
- Table 53: Rest of Middle East and Africa Polycrystalline Silicon Market Revenue (Million) Forecast, by Application 2019 & 2032
- Table 54: Rest of Middle East and Africa Polycrystalline Silicon Market Volume (K Tons) Forecast, by Application 2019 & 2032
- Table 55: Global Polycrystalline Silicon Market Revenue Million Forecast, by End-user Industry 2019 & 2032
- Table 56: Global Polycrystalline Silicon Market Volume K Tons Forecast, by End-user Industry 2019 & 2032
- Table 57: Global Polycrystalline Silicon Market Revenue Million Forecast, by Country 2019 & 2032
- Table 58: Global Polycrystalline Silicon Market Volume K Tons Forecast, by Country 2019 & 2032
- Table 59: China Polycrystalline Silicon Market Revenue (Million) Forecast, by Application 2019 & 2032
- Table 60: China Polycrystalline Silicon Market Volume (K Tons) Forecast, by Application 2019 & 2032
- Table 61: India Polycrystalline Silicon Market Revenue (Million) Forecast, by Application 2019 & 2032
- Table 62: India Polycrystalline Silicon Market Volume (K Tons) Forecast, by Application 2019 & 2032
- Table 63: Japan Polycrystalline Silicon Market Revenue (Million) Forecast, by Application 2019 & 2032
- Table 64: Japan Polycrystalline Silicon Market Volume (K Tons) Forecast, by Application 2019 & 2032
- Table 65: South Korea Polycrystalline Silicon Market Revenue (Million) Forecast, by Application 2019 & 2032
- Table 66: South Korea Polycrystalline Silicon Market Volume (K Tons) Forecast, by Application 2019 & 2032
- Table 67: Rest of Asia Pacific Polycrystalline Silicon Market Revenue (Million) Forecast, by Application 2019 & 2032
- Table 68: Rest of Asia Pacific Polycrystalline Silicon Market Volume (K Tons) Forecast, by Application 2019 & 2032
- Table 69: Global Polycrystalline Silicon Market Revenue Million Forecast, by End-user Industry 2019 & 2032
- Table 70: Global Polycrystalline Silicon Market Volume K Tons Forecast, by End-user Industry 2019 & 2032
- Table 71: Global Polycrystalline Silicon Market Revenue Million Forecast, by Country 2019 & 2032
- Table 72: Global Polycrystalline Silicon Market Volume K Tons Forecast, by Country 2019 & 2032
- Table 73: United States Polycrystalline Silicon Market Revenue (Million) Forecast, by Application 2019 & 2032
- Table 74: United States Polycrystalline Silicon Market Volume (K Tons) Forecast, by Application 2019 & 2032
- Table 75: Canada Polycrystalline Silicon Market Revenue (Million) Forecast, by Application 2019 & 2032
- Table 76: Canada Polycrystalline Silicon Market Volume (K Tons) Forecast, by Application 2019 & 2032
- Table 77: Mexico Polycrystalline Silicon Market Revenue (Million) Forecast, by Application 2019 & 2032
- Table 78: Mexico Polycrystalline Silicon Market Volume (K Tons) Forecast, by Application 2019 & 2032
- Table 79: Global Polycrystalline Silicon Market Revenue Million Forecast, by End-user Industry 2019 & 2032
- Table 80: Global Polycrystalline Silicon Market Volume K Tons Forecast, by End-user Industry 2019 & 2032
- Table 81: Global Polycrystalline Silicon Market Revenue Million Forecast, by Country 2019 & 2032
- Table 82: Global Polycrystalline Silicon Market Volume K Tons Forecast, by Country 2019 & 2032
- Table 83: Germany Polycrystalline Silicon Market Revenue (Million) Forecast, by Application 2019 & 2032
- Table 84: Germany Polycrystalline Silicon Market Volume (K Tons) Forecast, by Application 2019 & 2032
- Table 85: United Kingdom Polycrystalline Silicon Market Revenue (Million) Forecast, by Application 2019 & 2032
- Table 86: United Kingdom Polycrystalline Silicon Market Volume (K Tons) Forecast, by Application 2019 & 2032
- Table 87: Italy Polycrystalline Silicon Market Revenue (Million) Forecast, by Application 2019 & 2032
- Table 88: Italy Polycrystalline Silicon Market Volume (K Tons) Forecast, by Application 2019 & 2032
- Table 89: France Polycrystalline Silicon Market Revenue (Million) Forecast, by Application 2019 & 2032
- Table 90: France Polycrystalline Silicon Market Volume (K Tons) Forecast, by Application 2019 & 2032
- Table 91: Rest of Europe Polycrystalline Silicon Market Revenue (Million) Forecast, by Application 2019 & 2032
- Table 92: Rest of Europe Polycrystalline Silicon Market Volume (K Tons) Forecast, by Application 2019 & 2032
- Table 93: Global Polycrystalline Silicon Market Revenue Million Forecast, by End-user Industry 2019 & 2032
- Table 94: Global Polycrystalline Silicon Market Volume K Tons Forecast, by End-user Industry 2019 & 2032
- Table 95: Global Polycrystalline Silicon Market Revenue Million Forecast, by Country 2019 & 2032
- Table 96: Global Polycrystalline Silicon Market Volume K Tons Forecast, by Country 2019 & 2032
- Table 97: Brazil Polycrystalline Silicon Market Revenue (Million) Forecast, by Application 2019 & 2032
- Table 98: Brazil Polycrystalline Silicon Market Volume (K Tons) Forecast, by Application 2019 & 2032
- Table 99: Argentina Polycrystalline Silicon Market Revenue (Million) Forecast, by Application 2019 & 2032
- Table 100: Argentina Polycrystalline Silicon Market Volume (K Tons) Forecast, by Application 2019 & 2032
- Table 101: Rest of South America Polycrystalline Silicon Market Revenue (Million) Forecast, by Application 2019 & 2032
- Table 102: Rest of South America Polycrystalline Silicon Market Volume (K Tons) Forecast, by Application 2019 & 2032
- Table 103: Global Polycrystalline Silicon Market Revenue Million Forecast, by End-user Industry 2019 & 2032
- Table 104: Global Polycrystalline Silicon Market Volume K Tons Forecast, by End-user Industry 2019 & 2032
- Table 105: Global Polycrystalline Silicon Market Revenue Million Forecast, by Country 2019 & 2032
- Table 106: Global Polycrystalline Silicon Market Volume K Tons Forecast, by Country 2019 & 2032
- Table 107: Saudi Arabia Polycrystalline Silicon Market Revenue (Million) Forecast, by Application 2019 & 2032
- Table 108: Saudi Arabia Polycrystalline Silicon Market Volume (K Tons) Forecast, by Application 2019 & 2032
- Table 109: South Africa Polycrystalline Silicon Market Revenue (Million) Forecast, by Application 2019 & 2032
- Table 110: South Africa Polycrystalline Silicon Market Volume (K Tons) Forecast, by Application 2019 & 2032
- Table 111: Rest of Middle East and Africa Polycrystalline Silicon Market Revenue (Million) Forecast, by Application 2019 & 2032
- Table 112: Rest of Middle East and Africa Polycrystalline Silicon Market Volume (K Tons) Forecast, by Application 2019 & 2032
Frequently Asked Questions
1. What is the projected Compound Annual Growth Rate (CAGR) of the Polycrystalline Silicon Market?
The projected CAGR is approximately 13.21%.
2. Which companies are prominent players in the Polycrystalline Silicon Market?
Key companies in the market include Hemlock Semiconductor Operations LLC And Hemlock Semiconductor LLC, Qatar Solar Technologies, REC Silicon ASA, GCL-TECH, Xinte Energy Co Ltd , Tokuyama Corporation, Asia Silicon (Qinghai) Co Ltd, Daqo New Energy Co Ltd, Sichuan Yongxiang Co Ltd (Tongwei), OCI Company Ltd, Wacker Chemie AG, Mitsubishi Polycrystalline Silicon America Corporation.
3. What are the main segments of the Polycrystalline Silicon Market?
The market segments include End-user Industry.
4. Can you provide details about the market size?
The market size is estimated to be USD 14.49 Million as of 2022.
5. What are some drivers contributing to market growth?
Increasing Number of Solar PV Installation; Growth in the Semiconductor Industry.
6. What are the notable trends driving market growth?
Growing Demand from the Solar PV Industry.
7. Are there any restraints impacting market growth?
Emerging Competitors. such as Upgraded Metallurgical-grade Silicon (UMG-Si) Solar Cell; High Capital Expenditure.
8. Can you provide examples of recent developments in the market?
August 2022: REC Silicon ASA and Mississippi Silicon collaborated to develop a solar supply chain in the United States. They plan to develop this solar supply chain from raw silicon to polysilicon and finally to fully assembled modules.
9. What pricing options are available for accessing the report?
Pricing options include single-user, multi-user, and enterprise licenses priced at USD 4750, USD 5250, and USD 8750 respectively.
10. Is the market size provided in terms of value or volume?
The market size is provided in terms of value, measured in Million and volume, measured in K Tons.
11. Are there any specific market keywords associated with the report?
Yes, the market keyword associated with the report is "Polycrystalline Silicon Market," which aids in identifying and referencing the specific market segment covered.
12. How do I determine which pricing option suits my needs best?
The pricing options vary based on user requirements and access needs. Individual users may opt for single-user licenses, while businesses requiring broader access may choose multi-user or enterprise licenses for cost-effective access to the report.
13. Are there any additional resources or data provided in the Polycrystalline Silicon Market report?
While the report offers comprehensive insights, it's advisable to review the specific contents or supplementary materials provided to ascertain if additional resources or data are available.
14. How can I stay updated on further developments or reports in the Polycrystalline Silicon Market?
To stay informed about further developments, trends, and reports in the Polycrystalline Silicon Market, consider subscribing to industry newsletters, following relevant companies and organizations, or regularly checking reputable industry news sources and publications.
Methodology
Step 1 - Identification of Relevant Samples Size from Population Database


Step 2 - Approaches for Defining Global Market Size (Value, Volume* & Price*)

Note*: In applicable scenarios
Step 3 - Data Sources
Primary Research
- Web Analytics
- Survey Reports
- Research Institute
- Latest Research Reports
- Opinion Leaders
Secondary Research
- Annual Reports
- White Paper
- Latest Press Release
- Industry Association
- Paid Database
- Investor Presentations

Step 4 - Data Triangulation
Involves using different sources of information in order to increase the validity of a study
These sources are likely to be stakeholders in a program - participants, other researchers, program staff, other community members, and so on.
Then we put all data in single framework & apply various statistical tools to find out the dynamic on the market.
During the analysis stage, feedback from the stakeholder groups would be compared to determine areas of agreement as well as areas of divergence


