
Key Insights
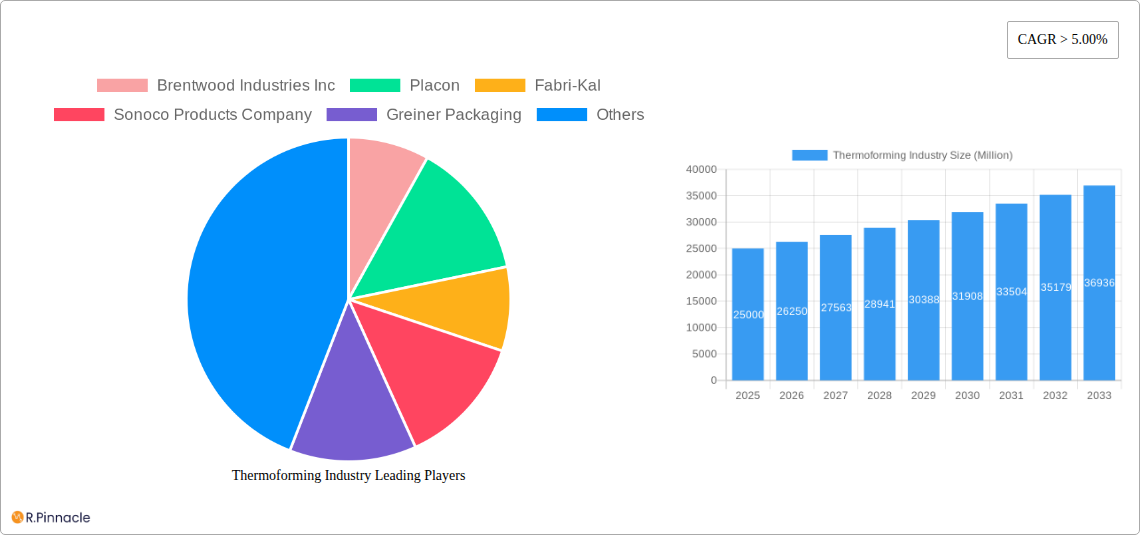
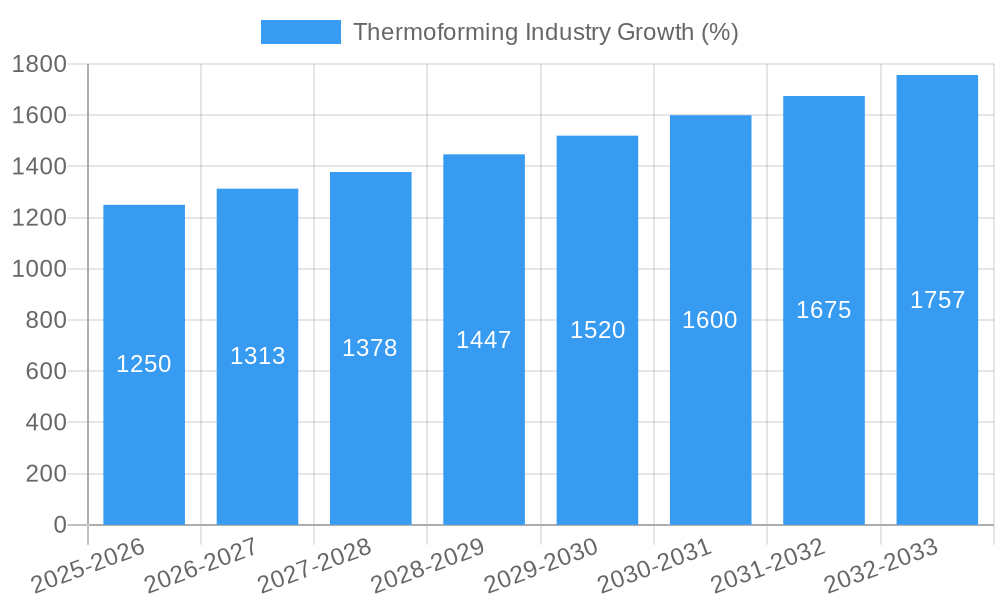
The thermoforming industry, valued at approximately $XX million in 2025, is experiencing robust growth, projected to maintain a CAGR exceeding 5% from 2025 to 2033. This expansion is driven by several key factors. The increasing demand for lightweight, cost-effective packaging across diverse end-user industries like food & beverage (packaging), healthcare (medical devices & blister packs), and electronics (protective casings) is a significant catalyst. Furthermore, advancements in thermoforming technologies, such as thin-gauge thermoforming for enhanced efficiency and biodegradable polymer utilization aligning with sustainability goals, are fueling market growth. The widespread adoption of automation in manufacturing processes further contributes to improved productivity and reduced costs, making thermoforming an attractive solution for various applications. Geographical expansion, particularly in rapidly developing economies of Asia-Pacific and South America, presents significant untapped potential. While challenges such as fluctuations in raw material prices and stringent environmental regulations exist, the overall industry outlook remains positive, anticipating substantial growth over the forecast period.
The market segmentation reveals a diverse landscape. Polyethylene (PE) and Polypropylene (PP) dominate the product type segment due to their versatility, cost-effectiveness, and recyclability. Within the process segment, vacuum snapback and plug-assist forming are widely used, while thin-gauge thermoforming is gaining traction due to its efficiency in producing lightweight products. Major players like Amcor plc, Berry Global Inc., and Sonoco Products Company hold significant market share, leveraging their established manufacturing capabilities and global reach. However, the increasing participation of smaller, specialized companies focusing on niche applications and sustainable solutions is also a notable trend. Competitive pressures necessitate continuous innovation and the development of specialized thermoforming solutions tailored to specific industry requirements to maintain a leading position in this dynamic market.
Thermoforming Industry Market Report: 2019-2033
This comprehensive report provides an in-depth analysis of the global thermoforming industry, offering invaluable insights for industry professionals, investors, and strategic decision-makers. Covering the period from 2019 to 2033, with a focus on 2025, this report leverages rigorous research to project market trends and growth opportunities. The report forecasts a market valued at $XX Million by 2033, presenting a detailed breakdown across key segments and regions.
Thermoforming Industry Market Structure & Innovation Trends
This section analyzes the competitive landscape of the thermoforming industry, encompassing market concentration, innovation drivers, regulatory frameworks, and M&A activities. The study period (2019-2024) reveals a moderately consolidated market with key players like Amcor plc, Berry Global Inc., and Sonoco Products Company holding significant market share. However, the emergence of smaller, specialized companies is also noteworthy.
- Market Concentration: The top 5 players hold an estimated xx% market share in 2025, indicating a moderately consolidated market.
- Innovation Drivers: Sustainability concerns are driving innovation toward biodegradable polymers and improved recycling processes. Technological advancements in automation and tooling are also enhancing efficiency and reducing production costs.
- Regulatory Framework: Stringent environmental regulations are influencing material choices and manufacturing processes, pushing the adoption of eco-friendly materials.
- M&A Activity: The historical period (2019-2024) saw approximately xx M&A deals valued at $XX Million, primarily driven by expansion strategies and technological acquisitions. Examples include (Specific examples of M&A from the period need to be added here).
- Product Substitutes: Competition from alternative packaging technologies, such as injection molding and blow molding, continues to shape the market dynamics. However, thermoforming’s versatility and cost-effectiveness maintain its competitive edge.
Thermoforming Industry Market Dynamics & Trends
This section delves into the key market dynamics and trends shaping the thermoforming industry. The forecast period (2025-2033) projects a CAGR of xx% driven by several factors. Growing demand from end-use sectors like packaging and healthcare, coupled with technological advancements in automation and material science, are propelling market growth. However, fluctuations in raw material prices and economic uncertainties pose potential challenges. Increasing consumer preference for sustainable and eco-friendly packaging options necessitates ongoing innovation in biodegradable materials and recycling techniques.
The competitive landscape is characterized by both intense competition among large established players and the emergence of new entrants focusing on niche applications and specialized processes.
Dominant Regions & Segments in Thermoforming Industry
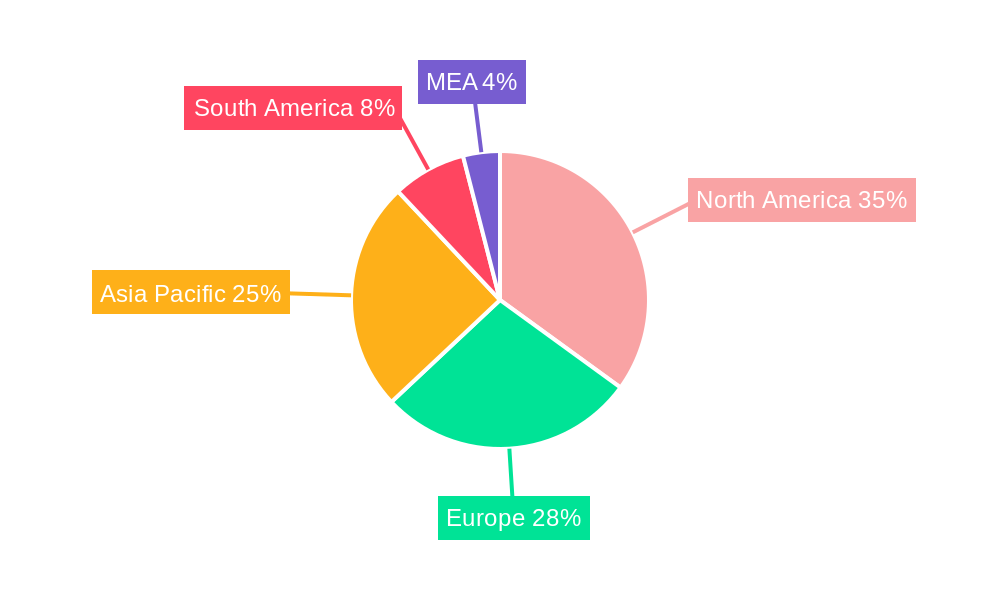
This section identifies the leading regions and segments within the thermoforming industry. North America and Europe currently hold significant market shares due to established manufacturing bases and high consumer demand. However, Asia-Pacific is projected to experience substantial growth in the forecast period driven by rising disposable incomes and industrialization.
Leading Regions:
- North America: Strong presence of major players, established infrastructure, and high demand in packaging and healthcare sectors contribute to its dominance.
- Europe: Similar to North America, a mature market with a focus on advanced materials and sustainable practices.
- Asia-Pacific: Rapid industrialization, increasing disposable incomes, and growing demand for consumer goods are driving significant growth.
Leading Segments:
- End-user Industry: Packaging remains the dominant segment, driven by the growing demand for food, beverage, and consumer goods packaging. The healthcare segment is experiencing strong growth due to increasing demand for medical devices and pharmaceutical packaging.
- Product Type: Polyethylene (PE) and Polypropylene (PP) dominate due to their versatility, cost-effectiveness, and recyclability. The adoption of bio-degradable polymers is increasing steadily.
- Process: Vacuum snapback and plug assist forming are the most widely used processes, offering a balance of efficiency and product quality.
Key Drivers: Strong economic growth, supportive government policies, and well-developed infrastructure in leading regions are significant drivers.
Thermoforming Industry Product Innovations
Recent innovations focus on thinner gauge materials for cost reduction and improved recyclability, alongside the development of more sustainable bio-based polymers. Advances in automation and tooling technologies enhance production speed and precision. These innovations cater to growing consumer demand for sustainable and convenient packaging solutions, enhancing market competitiveness.
Report Scope & Segmentation Analysis
This report provides a comprehensive segmentation of the thermoforming industry across various parameters. Detailed market size projections, growth rates, and competitive analyses are provided for each segment. The report covers the following segments:
- End-user Industry: Packaging, Healthcare, Automotive, Electricals & Electronics, Construction, Consumer Goods & Appliances, Others. Each segment’s growth is analyzed based on factors specific to each industry. For example, the healthcare sector is driven by the need for sterile and safe packaging.
- Product Type: Polyethylene (PE), Polypropylene (PP), Polystyrene (PS), Polyvinyl Chloride (PVC), Polymethyl Methacrylate (PMMA), Bio-degradable Polymers, Others. Growth in biodegradable polymers reflects increasing environmental awareness.
- Process: Vacuum Snapback, Plug Assist Forming, Thin Gauge Thermoforming, Thick Gauge Thermoforming. The choice of process depends on factors such as product complexity and material thickness.
Key Drivers of Thermoforming Industry Growth
Several factors drive the growth of the thermoforming industry, including increasing demand from diverse end-use sectors, technological advancements leading to improved efficiency and product quality, and the rising adoption of sustainable materials to meet stringent environmental regulations. Furthermore, growing disposable incomes in developing economies and robust infrastructure development are contributing to the expansion of this market.
Challenges in the Thermoforming Industry Sector
The thermoforming industry faces several challenges including price volatility of raw materials, intense competition from other packaging technologies, and stringent environmental regulations requiring continuous innovation in sustainable materials and manufacturing processes. Supply chain disruptions also pose significant hurdles, potentially affecting production and delivery timelines. The estimated impact of these challenges on market growth is xx%.
Emerging Opportunities in Thermoforming Industry
Emerging opportunities include the growing demand for sustainable packaging solutions, expansion into new markets like medical devices and electronics, and the development of advanced materials with enhanced properties. Further opportunities lie in exploring new applications for thermoforming technology in diverse sectors and leveraging digitalization for optimizing production processes.
Leading Players in the Thermoforming Industry Market
- Brentwood Industries Inc
- Placon
- Fabri-Kal
- Sonoco Products Company
- Greiner Packaging
- SILGAN HOLDINGS INC
- Silgan Plastics
- Amcor plc
- D&W Fine Pack
- Huhtamaki Global
- DISPLAY PACK
- Penda
- WINPAK LTD
- Sabert Corporation
- Pactiv LLC
- Anchor Packaging Inc
- Berry Global Inc
- Genpak LLC
- Spencer Industries Inc
- Dart Container Corporation
Key Developments in Thermoforming Industry Industry
- [Month, Year]: [Specific development, e.g., Amcor plc launched a new range of recyclable thermoformed packaging.] Impact: [Explain the impact of the development]
- [Month, Year]: [Specific development, e.g., Berry Global acquired a smaller thermoforming company.] Impact: [Explain the impact of the development]
- (Add more bullet points with specific examples)
Future Outlook for Thermoforming Industry Market
The thermoforming industry is poised for continued growth, driven by technological advancements, increasing demand for sustainable packaging, and expansion into new applications. Strategic partnerships, investments in R&D, and focusing on sustainable materials will be crucial for companies to capitalize on the market's potential. The market is expected to witness further consolidation through M&A activity as companies strive for scale and efficiency.
Thermoforming Industry Segmentation
-
1. Product Type
- 1.1. Polyethylene (PE)
- 1.2. Polypropylene (PP)
- 1.3. Polystyrene (PS)
- 1.4. Polyvinyl Chloride (PVC)
- 1.5. Polymethyl Methacrylate (PMMA)
- 1.6. Bio-degradable Polymers
- 1.7. Others
-
2. Process
- 2.1. Vacuum Snapback
- 2.2. Plug Assist Forming
- 2.3. Thin Gauge Thermoforming
- 2.4. Thick Gauge Thermoforming
-
3. End-user Industry
- 3.1. Packaging
- 3.2. Heathcare
- 3.3. Automotive
- 3.4. Electricals & Electronics
- 3.5. Construction
- 3.6. Consumer Goods & Appliances
- 3.7. Others
Thermoforming Industry Segmentation By Geography
-
1. Asia Pacific
- 1.1. China
- 1.2. India
- 1.3. Japan
- 1.4. South Korea
- 1.5. Rest of Asia Pacific
-
2. North America
- 2.1. United States
- 2.2. Canada
- 2.3. Mexico
-
3. Europe
- 3.1. Germany
- 3.2. United Kingdom
- 3.3. Italy
- 3.4. France
- 3.5. Rest of Europe
-
4. South America
- 4.1. Brazil
- 4.2. Argentina
- 4.3. Rest of South America
-
5. Middle East and Africa
- 5.1. Saudi Arabia
- 5.2. South Africa
- 5.3. Rest of Middle East and Africa
Thermoforming Industry REPORT HIGHLIGHTS
| Aspects | Details |
|---|---|
| Study Period | 2019-2033 |
| Base Year | 2024 |
| Estimated Year | 2025 |
| Forecast Period | 2025-2033 |
| Historical Period | 2019-2024 |
| Growth Rate | CAGR of > 5.00% from 2019-2033 |
| Segmentation |
|
Table of Contents
- 1. Introduction
- 1.1. Research Scope
- 1.2. Market Segmentation
- 1.3. Research Methodology
- 1.4. Definitions and Assumptions
- 2. Executive Summary
- 2.1. Introduction
- 3. Market Dynamics
- 3.1. Introduction
- 3.2. Market Drivers
- 3.2.1. ; Increasing Demand from Food Packaging Industry; Rising Demand from Healthcare Industry
- 3.3. Market Restrains
- 3.3.1. ; Stringent Rules and Regulations Imposed on the Usage of Plastic Products; Unfavourable Conditions Arising Due to COVID-19 Outbreak
- 3.4. Market Trends
- 3.4.1. Increasing Demand from Packaging Industry
- 4. Market Factor Analysis
- 4.1. Porters Five Forces
- 4.2. Supply/Value Chain
- 4.3. PESTEL analysis
- 4.4. Market Entropy
- 4.5. Patent/Trademark Analysis
- 5. Global Thermoforming Industry Analysis, Insights and Forecast, 2019-2031
- 5.1. Market Analysis, Insights and Forecast - by Product Type
- 5.1.1. Polyethylene (PE)
- 5.1.2. Polypropylene (PP)
- 5.1.3. Polystyrene (PS)
- 5.1.4. Polyvinyl Chloride (PVC)
- 5.1.5. Polymethyl Methacrylate (PMMA)
- 5.1.6. Bio-degradable Polymers
- 5.1.7. Others
- 5.2. Market Analysis, Insights and Forecast - by Process
- 5.2.1. Vacuum Snapback
- 5.2.2. Plug Assist Forming
- 5.2.3. Thin Gauge Thermoforming
- 5.2.4. Thick Gauge Thermoforming
- 5.3. Market Analysis, Insights and Forecast - by End-user Industry
- 5.3.1. Packaging
- 5.3.2. Heathcare
- 5.3.3. Automotive
- 5.3.4. Electricals & Electronics
- 5.3.5. Construction
- 5.3.6. Consumer Goods & Appliances
- 5.3.7. Others
- 5.4. Market Analysis, Insights and Forecast - by Region
- 5.4.1. Asia Pacific
- 5.4.2. North America
- 5.4.3. Europe
- 5.4.4. South America
- 5.4.5. Middle East and Africa
- 5.1. Market Analysis, Insights and Forecast - by Product Type
- 6. Asia Pacific Thermoforming Industry Analysis, Insights and Forecast, 2019-2031
- 6.1. Market Analysis, Insights and Forecast - by Product Type
- 6.1.1. Polyethylene (PE)
- 6.1.2. Polypropylene (PP)
- 6.1.3. Polystyrene (PS)
- 6.1.4. Polyvinyl Chloride (PVC)
- 6.1.5. Polymethyl Methacrylate (PMMA)
- 6.1.6. Bio-degradable Polymers
- 6.1.7. Others
- 6.2. Market Analysis, Insights and Forecast - by Process
- 6.2.1. Vacuum Snapback
- 6.2.2. Plug Assist Forming
- 6.2.3. Thin Gauge Thermoforming
- 6.2.4. Thick Gauge Thermoforming
- 6.3. Market Analysis, Insights and Forecast - by End-user Industry
- 6.3.1. Packaging
- 6.3.2. Heathcare
- 6.3.3. Automotive
- 6.3.4. Electricals & Electronics
- 6.3.5. Construction
- 6.3.6. Consumer Goods & Appliances
- 6.3.7. Others
- 6.1. Market Analysis, Insights and Forecast - by Product Type
- 7. North America Thermoforming Industry Analysis, Insights and Forecast, 2019-2031
- 7.1. Market Analysis, Insights and Forecast - by Product Type
- 7.1.1. Polyethylene (PE)
- 7.1.2. Polypropylene (PP)
- 7.1.3. Polystyrene (PS)
- 7.1.4. Polyvinyl Chloride (PVC)
- 7.1.5. Polymethyl Methacrylate (PMMA)
- 7.1.6. Bio-degradable Polymers
- 7.1.7. Others
- 7.2. Market Analysis, Insights and Forecast - by Process
- 7.2.1. Vacuum Snapback
- 7.2.2. Plug Assist Forming
- 7.2.3. Thin Gauge Thermoforming
- 7.2.4. Thick Gauge Thermoforming
- 7.3. Market Analysis, Insights and Forecast - by End-user Industry
- 7.3.1. Packaging
- 7.3.2. Heathcare
- 7.3.3. Automotive
- 7.3.4. Electricals & Electronics
- 7.3.5. Construction
- 7.3.6. Consumer Goods & Appliances
- 7.3.7. Others
- 7.1. Market Analysis, Insights and Forecast - by Product Type
- 8. Europe Thermoforming Industry Analysis, Insights and Forecast, 2019-2031
- 8.1. Market Analysis, Insights and Forecast - by Product Type
- 8.1.1. Polyethylene (PE)
- 8.1.2. Polypropylene (PP)
- 8.1.3. Polystyrene (PS)
- 8.1.4. Polyvinyl Chloride (PVC)
- 8.1.5. Polymethyl Methacrylate (PMMA)
- 8.1.6. Bio-degradable Polymers
- 8.1.7. Others
- 8.2. Market Analysis, Insights and Forecast - by Process
- 8.2.1. Vacuum Snapback
- 8.2.2. Plug Assist Forming
- 8.2.3. Thin Gauge Thermoforming
- 8.2.4. Thick Gauge Thermoforming
- 8.3. Market Analysis, Insights and Forecast - by End-user Industry
- 8.3.1. Packaging
- 8.3.2. Heathcare
- 8.3.3. Automotive
- 8.3.4. Electricals & Electronics
- 8.3.5. Construction
- 8.3.6. Consumer Goods & Appliances
- 8.3.7. Others
- 8.1. Market Analysis, Insights and Forecast - by Product Type
- 9. South America Thermoforming Industry Analysis, Insights and Forecast, 2019-2031
- 9.1. Market Analysis, Insights and Forecast - by Product Type
- 9.1.1. Polyethylene (PE)
- 9.1.2. Polypropylene (PP)
- 9.1.3. Polystyrene (PS)
- 9.1.4. Polyvinyl Chloride (PVC)
- 9.1.5. Polymethyl Methacrylate (PMMA)
- 9.1.6. Bio-degradable Polymers
- 9.1.7. Others
- 9.2. Market Analysis, Insights and Forecast - by Process
- 9.2.1. Vacuum Snapback
- 9.2.2. Plug Assist Forming
- 9.2.3. Thin Gauge Thermoforming
- 9.2.4. Thick Gauge Thermoforming
- 9.3. Market Analysis, Insights and Forecast - by End-user Industry
- 9.3.1. Packaging
- 9.3.2. Heathcare
- 9.3.3. Automotive
- 9.3.4. Electricals & Electronics
- 9.3.5. Construction
- 9.3.6. Consumer Goods & Appliances
- 9.3.7. Others
- 9.1. Market Analysis, Insights and Forecast - by Product Type
- 10. Middle East and Africa Thermoforming Industry Analysis, Insights and Forecast, 2019-2031
- 10.1. Market Analysis, Insights and Forecast - by Product Type
- 10.1.1. Polyethylene (PE)
- 10.1.2. Polypropylene (PP)
- 10.1.3. Polystyrene (PS)
- 10.1.4. Polyvinyl Chloride (PVC)
- 10.1.5. Polymethyl Methacrylate (PMMA)
- 10.1.6. Bio-degradable Polymers
- 10.1.7. Others
- 10.2. Market Analysis, Insights and Forecast - by Process
- 10.2.1. Vacuum Snapback
- 10.2.2. Plug Assist Forming
- 10.2.3. Thin Gauge Thermoforming
- 10.2.4. Thick Gauge Thermoforming
- 10.3. Market Analysis, Insights and Forecast - by End-user Industry
- 10.3.1. Packaging
- 10.3.2. Heathcare
- 10.3.3. Automotive
- 10.3.4. Electricals & Electronics
- 10.3.5. Construction
- 10.3.6. Consumer Goods & Appliances
- 10.3.7. Others
- 10.1. Market Analysis, Insights and Forecast - by Product Type
- 11. North America Thermoforming Industry Analysis, Insights and Forecast, 2019-2031
- 11.1. Market Analysis, Insights and Forecast - By Country/Sub-region
- 11.1.1 United States
- 11.1.2 Canada
- 11.1.3 Mexico
- 12. Europe Thermoforming Industry Analysis, Insights and Forecast, 2019-2031
- 12.1. Market Analysis, Insights and Forecast - By Country/Sub-region
- 12.1.1 Germany
- 12.1.2 France
- 12.1.3 Italy
- 12.1.4 United Kingdom
- 12.1.5 Netherlands
- 12.1.6 Rest of Europe
- 13. Asia Pacific Thermoforming Industry Analysis, Insights and Forecast, 2019-2031
- 13.1. Market Analysis, Insights and Forecast - By Country/Sub-region
- 13.1.1 China
- 13.1.2 Japan
- 13.1.3 India
- 13.1.4 South Korea
- 13.1.5 Taiwan
- 13.1.6 Australia
- 13.1.7 Rest of Asia-Pacific
- 14. South America Thermoforming Industry Analysis, Insights and Forecast, 2019-2031
- 14.1. Market Analysis, Insights and Forecast - By Country/Sub-region
- 14.1.1 Brazil
- 14.1.2 Argentina
- 14.1.3 Rest of South America
- 15. MEA Thermoforming Industry Analysis, Insights and Forecast, 2019-2031
- 15.1. Market Analysis, Insights and Forecast - By Country/Sub-region
- 15.1.1 Middle East
- 15.1.2 Africa
- 16. Competitive Analysis
- 16.1. Global Market Share Analysis 2024
- 16.2. Company Profiles
- 16.2.1 Brentwood Industries Inc
- 16.2.1.1. Overview
- 16.2.1.2. Products
- 16.2.1.3. SWOT Analysis
- 16.2.1.4. Recent Developments
- 16.2.1.5. Financials (Based on Availability)
- 16.2.2 Placon
- 16.2.2.1. Overview
- 16.2.2.2. Products
- 16.2.2.3. SWOT Analysis
- 16.2.2.4. Recent Developments
- 16.2.2.5. Financials (Based on Availability)
- 16.2.3 Fabri-Kal
- 16.2.3.1. Overview
- 16.2.3.2. Products
- 16.2.3.3. SWOT Analysis
- 16.2.3.4. Recent Developments
- 16.2.3.5. Financials (Based on Availability)
- 16.2.4 Sonoco Products Company
- 16.2.4.1. Overview
- 16.2.4.2. Products
- 16.2.4.3. SWOT Analysis
- 16.2.4.4. Recent Developments
- 16.2.4.5. Financials (Based on Availability)
- 16.2.5 Greiner Packaging
- 16.2.5.1. Overview
- 16.2.5.2. Products
- 16.2.5.3. SWOT Analysis
- 16.2.5.4. Recent Developments
- 16.2.5.5. Financials (Based on Availability)
- 16.2.6 SILGAN HOLDINGS INC
- 16.2.6.1. Overview
- 16.2.6.2. Products
- 16.2.6.3. SWOT Analysis
- 16.2.6.4. Recent Developments
- 16.2.6.5. Financials (Based on Availability)
- 16.2.7 Silgan Plastics
- 16.2.7.1. Overview
- 16.2.7.2. Products
- 16.2.7.3. SWOT Analysis
- 16.2.7.4. Recent Developments
- 16.2.7.5. Financials (Based on Availability)
- 16.2.8 Amcor plc
- 16.2.8.1. Overview
- 16.2.8.2. Products
- 16.2.8.3. SWOT Analysis
- 16.2.8.4. Recent Developments
- 16.2.8.5. Financials (Based on Availability)
- 16.2.9 D&W Fine Pack
- 16.2.9.1. Overview
- 16.2.9.2. Products
- 16.2.9.3. SWOT Analysis
- 16.2.9.4. Recent Developments
- 16.2.9.5. Financials (Based on Availability)
- 16.2.10 Huhtamaki Global
- 16.2.10.1. Overview
- 16.2.10.2. Products
- 16.2.10.3. SWOT Analysis
- 16.2.10.4. Recent Developments
- 16.2.10.5. Financials (Based on Availability)
- 16.2.11 DISPLAY PACK
- 16.2.11.1. Overview
- 16.2.11.2. Products
- 16.2.11.3. SWOT Analysis
- 16.2.11.4. Recent Developments
- 16.2.11.5. Financials (Based on Availability)
- 16.2.12 Penda
- 16.2.12.1. Overview
- 16.2.12.2. Products
- 16.2.12.3. SWOT Analysis
- 16.2.12.4. Recent Developments
- 16.2.12.5. Financials (Based on Availability)
- 16.2.13 WINPAK LTD
- 16.2.13.1. Overview
- 16.2.13.2. Products
- 16.2.13.3. SWOT Analysis
- 16.2.13.4. Recent Developments
- 16.2.13.5. Financials (Based on Availability)
- 16.2.14 Sabert Corporation
- 16.2.14.1. Overview
- 16.2.14.2. Products
- 16.2.14.3. SWOT Analysis
- 16.2.14.4. Recent Developments
- 16.2.14.5. Financials (Based on Availability)
- 16.2.15 Pactiv LLC
- 16.2.15.1. Overview
- 16.2.15.2. Products
- 16.2.15.3. SWOT Analysis
- 16.2.15.4. Recent Developments
- 16.2.15.5. Financials (Based on Availability)
- 16.2.16 Anchor Packaging Inc
- 16.2.16.1. Overview
- 16.2.16.2. Products
- 16.2.16.3. SWOT Analysis
- 16.2.16.4. Recent Developments
- 16.2.16.5. Financials (Based on Availability)
- 16.2.17 Berry Global Inc
- 16.2.17.1. Overview
- 16.2.17.2. Products
- 16.2.17.3. SWOT Analysis
- 16.2.17.4. Recent Developments
- 16.2.17.5. Financials (Based on Availability)
- 16.2.18 Genpak LLC
- 16.2.18.1. Overview
- 16.2.18.2. Products
- 16.2.18.3. SWOT Analysis
- 16.2.18.4. Recent Developments
- 16.2.18.5. Financials (Based on Availability)
- 16.2.19 Spencer Industries Inc
- 16.2.19.1. Overview
- 16.2.19.2. Products
- 16.2.19.3. SWOT Analysis
- 16.2.19.4. Recent Developments
- 16.2.19.5. Financials (Based on Availability)
- 16.2.20 Dart Container Corporation
- 16.2.20.1. Overview
- 16.2.20.2. Products
- 16.2.20.3. SWOT Analysis
- 16.2.20.4. Recent Developments
- 16.2.20.5. Financials (Based on Availability)
- 16.2.1 Brentwood Industries Inc
List of Figures
- Figure 1: Global Thermoforming Industry Revenue Breakdown (Million, %) by Region 2024 & 2032
- Figure 2: Global Thermoforming Industry Volume Breakdown (K Tons, %) by Region 2024 & 2032
- Figure 3: North America Thermoforming Industry Revenue (Million), by Country 2024 & 2032
- Figure 4: North America Thermoforming Industry Volume (K Tons), by Country 2024 & 2032
- Figure 5: North America Thermoforming Industry Revenue Share (%), by Country 2024 & 2032
- Figure 6: North America Thermoforming Industry Volume Share (%), by Country 2024 & 2032
- Figure 7: Europe Thermoforming Industry Revenue (Million), by Country 2024 & 2032
- Figure 8: Europe Thermoforming Industry Volume (K Tons), by Country 2024 & 2032
- Figure 9: Europe Thermoforming Industry Revenue Share (%), by Country 2024 & 2032
- Figure 10: Europe Thermoforming Industry Volume Share (%), by Country 2024 & 2032
- Figure 11: Asia Pacific Thermoforming Industry Revenue (Million), by Country 2024 & 2032
- Figure 12: Asia Pacific Thermoforming Industry Volume (K Tons), by Country 2024 & 2032
- Figure 13: Asia Pacific Thermoforming Industry Revenue Share (%), by Country 2024 & 2032
- Figure 14: Asia Pacific Thermoforming Industry Volume Share (%), by Country 2024 & 2032
- Figure 15: South America Thermoforming Industry Revenue (Million), by Country 2024 & 2032
- Figure 16: South America Thermoforming Industry Volume (K Tons), by Country 2024 & 2032
- Figure 17: South America Thermoforming Industry Revenue Share (%), by Country 2024 & 2032
- Figure 18: South America Thermoforming Industry Volume Share (%), by Country 2024 & 2032
- Figure 19: MEA Thermoforming Industry Revenue (Million), by Country 2024 & 2032
- Figure 20: MEA Thermoforming Industry Volume (K Tons), by Country 2024 & 2032
- Figure 21: MEA Thermoforming Industry Revenue Share (%), by Country 2024 & 2032
- Figure 22: MEA Thermoforming Industry Volume Share (%), by Country 2024 & 2032
- Figure 23: Asia Pacific Thermoforming Industry Revenue (Million), by Product Type 2024 & 2032
- Figure 24: Asia Pacific Thermoforming Industry Volume (K Tons), by Product Type 2024 & 2032
- Figure 25: Asia Pacific Thermoforming Industry Revenue Share (%), by Product Type 2024 & 2032
- Figure 26: Asia Pacific Thermoforming Industry Volume Share (%), by Product Type 2024 & 2032
- Figure 27: Asia Pacific Thermoforming Industry Revenue (Million), by Process 2024 & 2032
- Figure 28: Asia Pacific Thermoforming Industry Volume (K Tons), by Process 2024 & 2032
- Figure 29: Asia Pacific Thermoforming Industry Revenue Share (%), by Process 2024 & 2032
- Figure 30: Asia Pacific Thermoforming Industry Volume Share (%), by Process 2024 & 2032
- Figure 31: Asia Pacific Thermoforming Industry Revenue (Million), by End-user Industry 2024 & 2032
- Figure 32: Asia Pacific Thermoforming Industry Volume (K Tons), by End-user Industry 2024 & 2032
- Figure 33: Asia Pacific Thermoforming Industry Revenue Share (%), by End-user Industry 2024 & 2032
- Figure 34: Asia Pacific Thermoforming Industry Volume Share (%), by End-user Industry 2024 & 2032
- Figure 35: Asia Pacific Thermoforming Industry Revenue (Million), by Country 2024 & 2032
- Figure 36: Asia Pacific Thermoforming Industry Volume (K Tons), by Country 2024 & 2032
- Figure 37: Asia Pacific Thermoforming Industry Revenue Share (%), by Country 2024 & 2032
- Figure 38: Asia Pacific Thermoforming Industry Volume Share (%), by Country 2024 & 2032
- Figure 39: North America Thermoforming Industry Revenue (Million), by Product Type 2024 & 2032
- Figure 40: North America Thermoforming Industry Volume (K Tons), by Product Type 2024 & 2032
- Figure 41: North America Thermoforming Industry Revenue Share (%), by Product Type 2024 & 2032
- Figure 42: North America Thermoforming Industry Volume Share (%), by Product Type 2024 & 2032
- Figure 43: North America Thermoforming Industry Revenue (Million), by Process 2024 & 2032
- Figure 44: North America Thermoforming Industry Volume (K Tons), by Process 2024 & 2032
- Figure 45: North America Thermoforming Industry Revenue Share (%), by Process 2024 & 2032
- Figure 46: North America Thermoforming Industry Volume Share (%), by Process 2024 & 2032
- Figure 47: North America Thermoforming Industry Revenue (Million), by End-user Industry 2024 & 2032
- Figure 48: North America Thermoforming Industry Volume (K Tons), by End-user Industry 2024 & 2032
- Figure 49: North America Thermoforming Industry Revenue Share (%), by End-user Industry 2024 & 2032
- Figure 50: North America Thermoforming Industry Volume Share (%), by End-user Industry 2024 & 2032
- Figure 51: North America Thermoforming Industry Revenue (Million), by Country 2024 & 2032
- Figure 52: North America Thermoforming Industry Volume (K Tons), by Country 2024 & 2032
- Figure 53: North America Thermoforming Industry Revenue Share (%), by Country 2024 & 2032
- Figure 54: North America Thermoforming Industry Volume Share (%), by Country 2024 & 2032
- Figure 55: Europe Thermoforming Industry Revenue (Million), by Product Type 2024 & 2032
- Figure 56: Europe Thermoforming Industry Volume (K Tons), by Product Type 2024 & 2032
- Figure 57: Europe Thermoforming Industry Revenue Share (%), by Product Type 2024 & 2032
- Figure 58: Europe Thermoforming Industry Volume Share (%), by Product Type 2024 & 2032
- Figure 59: Europe Thermoforming Industry Revenue (Million), by Process 2024 & 2032
- Figure 60: Europe Thermoforming Industry Volume (K Tons), by Process 2024 & 2032
- Figure 61: Europe Thermoforming Industry Revenue Share (%), by Process 2024 & 2032
- Figure 62: Europe Thermoforming Industry Volume Share (%), by Process 2024 & 2032
- Figure 63: Europe Thermoforming Industry Revenue (Million), by End-user Industry 2024 & 2032
- Figure 64: Europe Thermoforming Industry Volume (K Tons), by End-user Industry 2024 & 2032
- Figure 65: Europe Thermoforming Industry Revenue Share (%), by End-user Industry 2024 & 2032
- Figure 66: Europe Thermoforming Industry Volume Share (%), by End-user Industry 2024 & 2032
- Figure 67: Europe Thermoforming Industry Revenue (Million), by Country 2024 & 2032
- Figure 68: Europe Thermoforming Industry Volume (K Tons), by Country 2024 & 2032
- Figure 69: Europe Thermoforming Industry Revenue Share (%), by Country 2024 & 2032
- Figure 70: Europe Thermoforming Industry Volume Share (%), by Country 2024 & 2032
- Figure 71: South America Thermoforming Industry Revenue (Million), by Product Type 2024 & 2032
- Figure 72: South America Thermoforming Industry Volume (K Tons), by Product Type 2024 & 2032
- Figure 73: South America Thermoforming Industry Revenue Share (%), by Product Type 2024 & 2032
- Figure 74: South America Thermoforming Industry Volume Share (%), by Product Type 2024 & 2032
- Figure 75: South America Thermoforming Industry Revenue (Million), by Process 2024 & 2032
- Figure 76: South America Thermoforming Industry Volume (K Tons), by Process 2024 & 2032
- Figure 77: South America Thermoforming Industry Revenue Share (%), by Process 2024 & 2032
- Figure 78: South America Thermoforming Industry Volume Share (%), by Process 2024 & 2032
- Figure 79: South America Thermoforming Industry Revenue (Million), by End-user Industry 2024 & 2032
- Figure 80: South America Thermoforming Industry Volume (K Tons), by End-user Industry 2024 & 2032
- Figure 81: South America Thermoforming Industry Revenue Share (%), by End-user Industry 2024 & 2032
- Figure 82: South America Thermoforming Industry Volume Share (%), by End-user Industry 2024 & 2032
- Figure 83: South America Thermoforming Industry Revenue (Million), by Country 2024 & 2032
- Figure 84: South America Thermoforming Industry Volume (K Tons), by Country 2024 & 2032
- Figure 85: South America Thermoforming Industry Revenue Share (%), by Country 2024 & 2032
- Figure 86: South America Thermoforming Industry Volume Share (%), by Country 2024 & 2032
- Figure 87: Middle East and Africa Thermoforming Industry Revenue (Million), by Product Type 2024 & 2032
- Figure 88: Middle East and Africa Thermoforming Industry Volume (K Tons), by Product Type 2024 & 2032
- Figure 89: Middle East and Africa Thermoforming Industry Revenue Share (%), by Product Type 2024 & 2032
- Figure 90: Middle East and Africa Thermoforming Industry Volume Share (%), by Product Type 2024 & 2032
- Figure 91: Middle East and Africa Thermoforming Industry Revenue (Million), by Process 2024 & 2032
- Figure 92: Middle East and Africa Thermoforming Industry Volume (K Tons), by Process 2024 & 2032
- Figure 93: Middle East and Africa Thermoforming Industry Revenue Share (%), by Process 2024 & 2032
- Figure 94: Middle East and Africa Thermoforming Industry Volume Share (%), by Process 2024 & 2032
- Figure 95: Middle East and Africa Thermoforming Industry Revenue (Million), by End-user Industry 2024 & 2032
- Figure 96: Middle East and Africa Thermoforming Industry Volume (K Tons), by End-user Industry 2024 & 2032
- Figure 97: Middle East and Africa Thermoforming Industry Revenue Share (%), by End-user Industry 2024 & 2032
- Figure 98: Middle East and Africa Thermoforming Industry Volume Share (%), by End-user Industry 2024 & 2032
- Figure 99: Middle East and Africa Thermoforming Industry Revenue (Million), by Country 2024 & 2032
- Figure 100: Middle East and Africa Thermoforming Industry Volume (K Tons), by Country 2024 & 2032
- Figure 101: Middle East and Africa Thermoforming Industry Revenue Share (%), by Country 2024 & 2032
- Figure 102: Middle East and Africa Thermoforming Industry Volume Share (%), by Country 2024 & 2032
List of Tables
- Table 1: Global Thermoforming Industry Revenue Million Forecast, by Region 2019 & 2032
- Table 2: Global Thermoforming Industry Volume K Tons Forecast, by Region 2019 & 2032
- Table 3: Global Thermoforming Industry Revenue Million Forecast, by Product Type 2019 & 2032
- Table 4: Global Thermoforming Industry Volume K Tons Forecast, by Product Type 2019 & 2032
- Table 5: Global Thermoforming Industry Revenue Million Forecast, by Process 2019 & 2032
- Table 6: Global Thermoforming Industry Volume K Tons Forecast, by Process 2019 & 2032
- Table 7: Global Thermoforming Industry Revenue Million Forecast, by End-user Industry 2019 & 2032
- Table 8: Global Thermoforming Industry Volume K Tons Forecast, by End-user Industry 2019 & 2032
- Table 9: Global Thermoforming Industry Revenue Million Forecast, by Region 2019 & 2032
- Table 10: Global Thermoforming Industry Volume K Tons Forecast, by Region 2019 & 2032
- Table 11: Global Thermoforming Industry Revenue Million Forecast, by Country 2019 & 2032
- Table 12: Global Thermoforming Industry Volume K Tons Forecast, by Country 2019 & 2032
- Table 13: United States Thermoforming Industry Revenue (Million) Forecast, by Application 2019 & 2032
- Table 14: United States Thermoforming Industry Volume (K Tons) Forecast, by Application 2019 & 2032
- Table 15: Canada Thermoforming Industry Revenue (Million) Forecast, by Application 2019 & 2032
- Table 16: Canada Thermoforming Industry Volume (K Tons) Forecast, by Application 2019 & 2032
- Table 17: Mexico Thermoforming Industry Revenue (Million) Forecast, by Application 2019 & 2032
- Table 18: Mexico Thermoforming Industry Volume (K Tons) Forecast, by Application 2019 & 2032
- Table 19: Global Thermoforming Industry Revenue Million Forecast, by Country 2019 & 2032
- Table 20: Global Thermoforming Industry Volume K Tons Forecast, by Country 2019 & 2032
- Table 21: Germany Thermoforming Industry Revenue (Million) Forecast, by Application 2019 & 2032
- Table 22: Germany Thermoforming Industry Volume (K Tons) Forecast, by Application 2019 & 2032
- Table 23: France Thermoforming Industry Revenue (Million) Forecast, by Application 2019 & 2032
- Table 24: France Thermoforming Industry Volume (K Tons) Forecast, by Application 2019 & 2032
- Table 25: Italy Thermoforming Industry Revenue (Million) Forecast, by Application 2019 & 2032
- Table 26: Italy Thermoforming Industry Volume (K Tons) Forecast, by Application 2019 & 2032
- Table 27: United Kingdom Thermoforming Industry Revenue (Million) Forecast, by Application 2019 & 2032
- Table 28: United Kingdom Thermoforming Industry Volume (K Tons) Forecast, by Application 2019 & 2032
- Table 29: Netherlands Thermoforming Industry Revenue (Million) Forecast, by Application 2019 & 2032
- Table 30: Netherlands Thermoforming Industry Volume (K Tons) Forecast, by Application 2019 & 2032
- Table 31: Rest of Europe Thermoforming Industry Revenue (Million) Forecast, by Application 2019 & 2032
- Table 32: Rest of Europe Thermoforming Industry Volume (K Tons) Forecast, by Application 2019 & 2032
- Table 33: Global Thermoforming Industry Revenue Million Forecast, by Country 2019 & 2032
- Table 34: Global Thermoforming Industry Volume K Tons Forecast, by Country 2019 & 2032
- Table 35: China Thermoforming Industry Revenue (Million) Forecast, by Application 2019 & 2032
- Table 36: China Thermoforming Industry Volume (K Tons) Forecast, by Application 2019 & 2032
- Table 37: Japan Thermoforming Industry Revenue (Million) Forecast, by Application 2019 & 2032
- Table 38: Japan Thermoforming Industry Volume (K Tons) Forecast, by Application 2019 & 2032
- Table 39: India Thermoforming Industry Revenue (Million) Forecast, by Application 2019 & 2032
- Table 40: India Thermoforming Industry Volume (K Tons) Forecast, by Application 2019 & 2032
- Table 41: South Korea Thermoforming Industry Revenue (Million) Forecast, by Application 2019 & 2032
- Table 42: South Korea Thermoforming Industry Volume (K Tons) Forecast, by Application 2019 & 2032
- Table 43: Taiwan Thermoforming Industry Revenue (Million) Forecast, by Application 2019 & 2032
- Table 44: Taiwan Thermoforming Industry Volume (K Tons) Forecast, by Application 2019 & 2032
- Table 45: Australia Thermoforming Industry Revenue (Million) Forecast, by Application 2019 & 2032
- Table 46: Australia Thermoforming Industry Volume (K Tons) Forecast, by Application 2019 & 2032
- Table 47: Rest of Asia-Pacific Thermoforming Industry Revenue (Million) Forecast, by Application 2019 & 2032
- Table 48: Rest of Asia-Pacific Thermoforming Industry Volume (K Tons) Forecast, by Application 2019 & 2032
- Table 49: Global Thermoforming Industry Revenue Million Forecast, by Country 2019 & 2032
- Table 50: Global Thermoforming Industry Volume K Tons Forecast, by Country 2019 & 2032
- Table 51: Brazil Thermoforming Industry Revenue (Million) Forecast, by Application 2019 & 2032
- Table 52: Brazil Thermoforming Industry Volume (K Tons) Forecast, by Application 2019 & 2032
- Table 53: Argentina Thermoforming Industry Revenue (Million) Forecast, by Application 2019 & 2032
- Table 54: Argentina Thermoforming Industry Volume (K Tons) Forecast, by Application 2019 & 2032
- Table 55: Rest of South America Thermoforming Industry Revenue (Million) Forecast, by Application 2019 & 2032
- Table 56: Rest of South America Thermoforming Industry Volume (K Tons) Forecast, by Application 2019 & 2032
- Table 57: Global Thermoforming Industry Revenue Million Forecast, by Country 2019 & 2032
- Table 58: Global Thermoforming Industry Volume K Tons Forecast, by Country 2019 & 2032
- Table 59: Middle East Thermoforming Industry Revenue (Million) Forecast, by Application 2019 & 2032
- Table 60: Middle East Thermoforming Industry Volume (K Tons) Forecast, by Application 2019 & 2032
- Table 61: Africa Thermoforming Industry Revenue (Million) Forecast, by Application 2019 & 2032
- Table 62: Africa Thermoforming Industry Volume (K Tons) Forecast, by Application 2019 & 2032
- Table 63: Global Thermoforming Industry Revenue Million Forecast, by Product Type 2019 & 2032
- Table 64: Global Thermoforming Industry Volume K Tons Forecast, by Product Type 2019 & 2032
- Table 65: Global Thermoforming Industry Revenue Million Forecast, by Process 2019 & 2032
- Table 66: Global Thermoforming Industry Volume K Tons Forecast, by Process 2019 & 2032
- Table 67: Global Thermoforming Industry Revenue Million Forecast, by End-user Industry 2019 & 2032
- Table 68: Global Thermoforming Industry Volume K Tons Forecast, by End-user Industry 2019 & 2032
- Table 69: Global Thermoforming Industry Revenue Million Forecast, by Country 2019 & 2032
- Table 70: Global Thermoforming Industry Volume K Tons Forecast, by Country 2019 & 2032
- Table 71: China Thermoforming Industry Revenue (Million) Forecast, by Application 2019 & 2032
- Table 72: China Thermoforming Industry Volume (K Tons) Forecast, by Application 2019 & 2032
- Table 73: India Thermoforming Industry Revenue (Million) Forecast, by Application 2019 & 2032
- Table 74: India Thermoforming Industry Volume (K Tons) Forecast, by Application 2019 & 2032
- Table 75: Japan Thermoforming Industry Revenue (Million) Forecast, by Application 2019 & 2032
- Table 76: Japan Thermoforming Industry Volume (K Tons) Forecast, by Application 2019 & 2032
- Table 77: South Korea Thermoforming Industry Revenue (Million) Forecast, by Application 2019 & 2032
- Table 78: South Korea Thermoforming Industry Volume (K Tons) Forecast, by Application 2019 & 2032
- Table 79: Rest of Asia Pacific Thermoforming Industry Revenue (Million) Forecast, by Application 2019 & 2032
- Table 80: Rest of Asia Pacific Thermoforming Industry Volume (K Tons) Forecast, by Application 2019 & 2032
- Table 81: Global Thermoforming Industry Revenue Million Forecast, by Product Type 2019 & 2032
- Table 82: Global Thermoforming Industry Volume K Tons Forecast, by Product Type 2019 & 2032
- Table 83: Global Thermoforming Industry Revenue Million Forecast, by Process 2019 & 2032
- Table 84: Global Thermoforming Industry Volume K Tons Forecast, by Process 2019 & 2032
- Table 85: Global Thermoforming Industry Revenue Million Forecast, by End-user Industry 2019 & 2032
- Table 86: Global Thermoforming Industry Volume K Tons Forecast, by End-user Industry 2019 & 2032
- Table 87: Global Thermoforming Industry Revenue Million Forecast, by Country 2019 & 2032
- Table 88: Global Thermoforming Industry Volume K Tons Forecast, by Country 2019 & 2032
- Table 89: United States Thermoforming Industry Revenue (Million) Forecast, by Application 2019 & 2032
- Table 90: United States Thermoforming Industry Volume (K Tons) Forecast, by Application 2019 & 2032
- Table 91: Canada Thermoforming Industry Revenue (Million) Forecast, by Application 2019 & 2032
- Table 92: Canada Thermoforming Industry Volume (K Tons) Forecast, by Application 2019 & 2032
- Table 93: Mexico Thermoforming Industry Revenue (Million) Forecast, by Application 2019 & 2032
- Table 94: Mexico Thermoforming Industry Volume (K Tons) Forecast, by Application 2019 & 2032
- Table 95: Global Thermoforming Industry Revenue Million Forecast, by Product Type 2019 & 2032
- Table 96: Global Thermoforming Industry Volume K Tons Forecast, by Product Type 2019 & 2032
- Table 97: Global Thermoforming Industry Revenue Million Forecast, by Process 2019 & 2032
- Table 98: Global Thermoforming Industry Volume K Tons Forecast, by Process 2019 & 2032
- Table 99: Global Thermoforming Industry Revenue Million Forecast, by End-user Industry 2019 & 2032
- Table 100: Global Thermoforming Industry Volume K Tons Forecast, by End-user Industry 2019 & 2032
- Table 101: Global Thermoforming Industry Revenue Million Forecast, by Country 2019 & 2032
- Table 102: Global Thermoforming Industry Volume K Tons Forecast, by Country 2019 & 2032
- Table 103: Germany Thermoforming Industry Revenue (Million) Forecast, by Application 2019 & 2032
- Table 104: Germany Thermoforming Industry Volume (K Tons) Forecast, by Application 2019 & 2032
- Table 105: United Kingdom Thermoforming Industry Revenue (Million) Forecast, by Application 2019 & 2032
- Table 106: United Kingdom Thermoforming Industry Volume (K Tons) Forecast, by Application 2019 & 2032
- Table 107: Italy Thermoforming Industry Revenue (Million) Forecast, by Application 2019 & 2032
- Table 108: Italy Thermoforming Industry Volume (K Tons) Forecast, by Application 2019 & 2032
- Table 109: France Thermoforming Industry Revenue (Million) Forecast, by Application 2019 & 2032
- Table 110: France Thermoforming Industry Volume (K Tons) Forecast, by Application 2019 & 2032
- Table 111: Rest of Europe Thermoforming Industry Revenue (Million) Forecast, by Application 2019 & 2032
- Table 112: Rest of Europe Thermoforming Industry Volume (K Tons) Forecast, by Application 2019 & 2032
- Table 113: Global Thermoforming Industry Revenue Million Forecast, by Product Type 2019 & 2032
- Table 114: Global Thermoforming Industry Volume K Tons Forecast, by Product Type 2019 & 2032
- Table 115: Global Thermoforming Industry Revenue Million Forecast, by Process 2019 & 2032
- Table 116: Global Thermoforming Industry Volume K Tons Forecast, by Process 2019 & 2032
- Table 117: Global Thermoforming Industry Revenue Million Forecast, by End-user Industry 2019 & 2032
- Table 118: Global Thermoforming Industry Volume K Tons Forecast, by End-user Industry 2019 & 2032
- Table 119: Global Thermoforming Industry Revenue Million Forecast, by Country 2019 & 2032
- Table 120: Global Thermoforming Industry Volume K Tons Forecast, by Country 2019 & 2032
- Table 121: Brazil Thermoforming Industry Revenue (Million) Forecast, by Application 2019 & 2032
- Table 122: Brazil Thermoforming Industry Volume (K Tons) Forecast, by Application 2019 & 2032
- Table 123: Argentina Thermoforming Industry Revenue (Million) Forecast, by Application 2019 & 2032
- Table 124: Argentina Thermoforming Industry Volume (K Tons) Forecast, by Application 2019 & 2032
- Table 125: Rest of South America Thermoforming Industry Revenue (Million) Forecast, by Application 2019 & 2032
- Table 126: Rest of South America Thermoforming Industry Volume (K Tons) Forecast, by Application 2019 & 2032
- Table 127: Global Thermoforming Industry Revenue Million Forecast, by Product Type 2019 & 2032
- Table 128: Global Thermoforming Industry Volume K Tons Forecast, by Product Type 2019 & 2032
- Table 129: Global Thermoforming Industry Revenue Million Forecast, by Process 2019 & 2032
- Table 130: Global Thermoforming Industry Volume K Tons Forecast, by Process 2019 & 2032
- Table 131: Global Thermoforming Industry Revenue Million Forecast, by End-user Industry 2019 & 2032
- Table 132: Global Thermoforming Industry Volume K Tons Forecast, by End-user Industry 2019 & 2032
- Table 133: Global Thermoforming Industry Revenue Million Forecast, by Country 2019 & 2032
- Table 134: Global Thermoforming Industry Volume K Tons Forecast, by Country 2019 & 2032
- Table 135: Saudi Arabia Thermoforming Industry Revenue (Million) Forecast, by Application 2019 & 2032
- Table 136: Saudi Arabia Thermoforming Industry Volume (K Tons) Forecast, by Application 2019 & 2032
- Table 137: South Africa Thermoforming Industry Revenue (Million) Forecast, by Application 2019 & 2032
- Table 138: South Africa Thermoforming Industry Volume (K Tons) Forecast, by Application 2019 & 2032
- Table 139: Rest of Middle East and Africa Thermoforming Industry Revenue (Million) Forecast, by Application 2019 & 2032
- Table 140: Rest of Middle East and Africa Thermoforming Industry Volume (K Tons) Forecast, by Application 2019 & 2032
Frequently Asked Questions
1. What is the projected Compound Annual Growth Rate (CAGR) of the Thermoforming Industry?
The projected CAGR is approximately > 5.00%.
2. Which companies are prominent players in the Thermoforming Industry?
Key companies in the market include Brentwood Industries Inc, Placon, Fabri-Kal, Sonoco Products Company, Greiner Packaging, SILGAN HOLDINGS INC, Silgan Plastics, Amcor plc, D&W Fine Pack, Huhtamaki Global, DISPLAY PACK, Penda, WINPAK LTD , Sabert Corporation, Pactiv LLC, Anchor Packaging Inc, Berry Global Inc, Genpak LLC, Spencer Industries Inc, Dart Container Corporation.
3. What are the main segments of the Thermoforming Industry?
The market segments include Product Type, Process, End-user Industry.
4. Can you provide details about the market size?
The market size is estimated to be USD XX Million as of 2022.
5. What are some drivers contributing to market growth?
; Increasing Demand from Food Packaging Industry; Rising Demand from Healthcare Industry.
6. What are the notable trends driving market growth?
Increasing Demand from Packaging Industry.
7. Are there any restraints impacting market growth?
; Stringent Rules and Regulations Imposed on the Usage of Plastic Products; Unfavourable Conditions Arising Due to COVID-19 Outbreak.
8. Can you provide examples of recent developments in the market?
N/A
9. What pricing options are available for accessing the report?
Pricing options include single-user, multi-user, and enterprise licenses priced at USD 4750, USD 5250, and USD 8750 respectively.
10. Is the market size provided in terms of value or volume?
The market size is provided in terms of value, measured in Million and volume, measured in K Tons.
11. Are there any specific market keywords associated with the report?
Yes, the market keyword associated with the report is "Thermoforming Industry," which aids in identifying and referencing the specific market segment covered.
12. How do I determine which pricing option suits my needs best?
The pricing options vary based on user requirements and access needs. Individual users may opt for single-user licenses, while businesses requiring broader access may choose multi-user or enterprise licenses for cost-effective access to the report.
13. Are there any additional resources or data provided in the Thermoforming Industry report?
While the report offers comprehensive insights, it's advisable to review the specific contents or supplementary materials provided to ascertain if additional resources or data are available.
14. How can I stay updated on further developments or reports in the Thermoforming Industry?
To stay informed about further developments, trends, and reports in the Thermoforming Industry, consider subscribing to industry newsletters, following relevant companies and organizations, or regularly checking reputable industry news sources and publications.
Methodology
Step 1 - Identification of Relevant Samples Size from Population Database


Step 2 - Approaches for Defining Global Market Size (Value, Volume* & Price*)

Note*: In applicable scenarios
Step 3 - Data Sources
Primary Research
- Web Analytics
- Survey Reports
- Research Institute
- Latest Research Reports
- Opinion Leaders
Secondary Research
- Annual Reports
- White Paper
- Latest Press Release
- Industry Association
- Paid Database
- Investor Presentations

Step 4 - Data Triangulation
Involves using different sources of information in order to increase the validity of a study
These sources are likely to be stakeholders in a program - participants, other researchers, program staff, other community members, and so on.
Then we put all data in single framework & apply various statistical tools to find out the dynamic on the market.
During the analysis stage, feedback from the stakeholder groups would be compared to determine areas of agreement as well as areas of divergence


