
Key Insights
The Asia-Pacific (APAC) mobile payments market is experiencing explosive growth, driven by factors such as rising smartphone penetration, increasing internet and mobile data usage, a burgeoning e-commerce sector, and the expanding adoption of digital financial services, particularly in emerging economies like India and China. The region's diverse demographics and technological advancements are further fueling this expansion. A significant driver is the preference for cashless transactions, fueled by government initiatives promoting digitalization and the inherent convenience and security offered by mobile payment platforms. Key players like Alipay, WeChat Pay, and Paytm dominate the landscape, leveraging their extensive user bases and integrated ecosystems to maintain market leadership. However, competition is intensifying with the entry of global players like Visa, Mastercard, and PayPal, leading to innovation in payment technologies and service offerings. The market's segmentation, encompassing various payment types (proximity and remote) and end-user industries (BFSI, retail, healthcare, etc.), showcases its diverse applications and potential for future expansion. While regulatory hurdles and cybersecurity concerns pose challenges, the overall growth trajectory remains remarkably positive.
The forecast period (2025-2033) anticipates sustained growth, fueled by continued infrastructure development, expanding financial inclusion initiatives, and the emergence of innovative payment solutions like mobile wallets and Buy Now Pay Later (BNPL) services. The rising adoption of 5G technology will further accelerate the market's expansion by enabling faster and more secure transactions. Specific countries like India and China are expected to contribute significantly to this growth, while other APAC nations will follow suit as digital literacy improves and mobile payment infrastructure matures. The competitive landscape will likely see mergers and acquisitions, strategic partnerships, and further innovation in areas like biometric authentication and artificial intelligence to enhance security and user experience. While the market faces challenges related to data privacy and regulatory compliance, the overall outlook remains exceptionally promising, positioning APAC as a global leader in the mobile payments revolution.

APAC Mobile Payments Industry Report: 2019-2033
This comprehensive report provides an in-depth analysis of the Asia-Pacific (APAC) mobile payments industry, offering valuable insights for industry professionals, investors, and strategists. Covering the period from 2019 to 2033, with a base year of 2025 and a forecast period of 2025-2033, this report offers a detailed understanding of market dynamics, growth drivers, challenges, and future opportunities. The market size is projected to reach xx Million by 2033, showcasing significant growth potential. Key players like Visa Inc, Paypal Inc, and Alipay are analyzed, along with emerging trends shaping the industry landscape.
APAC Mobile Payments Industry Market Structure & Innovation Trends
The APAC mobile payments market exhibits a dynamic structure characterized by a mix of established players and agile fintech startups. Market concentration is moderate, with a few dominant players commanding significant market share, while numerous smaller players compete in niche segments. Visa Inc and Mastercard Inc hold substantial shares, while regional players like Alipay and WeChat Pay dominate specific markets. The estimated market share for Visa in 2025 is xx%, Mastercard xx%, Alipay xx%, and WeChat Pay xx%. Innovation is driven by technological advancements like Near Field Communication (NFC), biometric authentication, and advancements in mobile wallets. Regulatory frameworks vary across countries, impacting market growth and adoption rates. The increasing preference for contactless payments and the growing adoption of smartphones are key factors driving innovation. M&A activities are frequent, with deal values exceeding xx Million in recent years, primarily focused on enhancing technological capabilities and expanding market reach.
- Market Concentration: Moderate, with a few dominant players.
- Innovation Drivers: Technological advancements (NFC, biometrics), consumer preferences, regulatory changes.
- Regulatory Frameworks: Vary across APAC countries, impacting market growth.
- M&A Activity: High, with deals exceeding xx Million annually.

APAC Mobile Payments Industry Market Dynamics & Trends
The APAC mobile payments market is experiencing explosive growth, driven by a confluence of factors including the surging adoption of smartphones, escalating internet and mobile data usage, and the burgeoning digital economy across the region. This robust expansion is projected to maintain a significant Compound Annual Growth Rate (CAGR) of [Insert Updated CAGR Percentage]% during the forecast period (2025-2033). While market penetration is already high in major urban centers, a rapid expansion into previously underserved rural areas is significantly contributing to overall growth. The landscape is being dynamically reshaped by technological disruptions, particularly the rise of "super apps" offering integrated financial services, creating both opportunities and challenges for existing players. Consumer demand is clearly shifting towards frictionless, secure, and highly convenient payment solutions, fueling the need for innovative mobile payment technologies. The competitive dynamics remain intensely competitive, with established industry giants and agile new entrants vying for market share through strategic alliances, cutting-edge product innovation, and aggressive marketing strategies. The market penetration rate in 2025 is estimated at [Insert Updated Penetration Percentage]%.
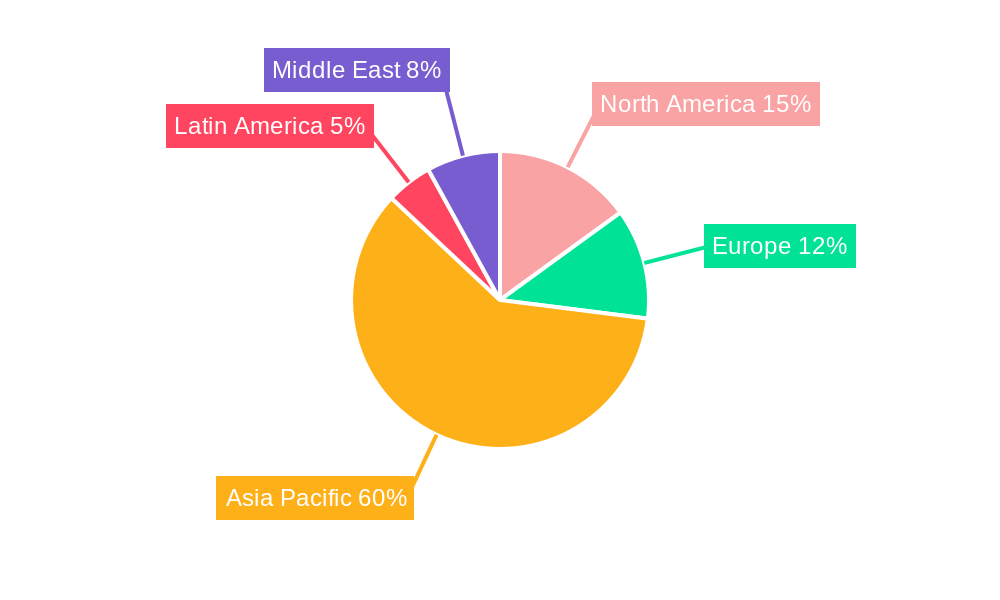
Dominant Regions & Segments in APAC Mobile Payments Industry
China and India are the dominant markets in the APAC mobile payments industry, exhibiting exceptionally high growth rates. China leads in terms of transaction volume, driven by the widespread adoption of Alipay and WeChat Pay. India's market is characterized by a high growth potential, fueled by the rapid expansion of UPI (Unified Payments Interface).
- By Type: Remote payments are projected to dominate over proximity payments, reflecting the convenience of online transactions.
- By End-User Industry: BFSI and Retail are the leading segments, followed by IT and Telecommunication.
- By Country:
- China: High market penetration due to dominant players like Alipay and WeChat Pay.
- India: Rapid growth driven by UPI and increasing smartphone adoption.
- Japan: Steady growth, with a focus on contactless payments and digital wallets.
- South Korea: High adoption rates of mobile wallets.
- Rest of APAC: Significant growth potential, with varying adoption rates across countries.
Key Drivers:
- China: Robust digital infrastructure, supportive government policies, high smartphone penetration.
- India: Rapid growth of UPI, government's digital India initiative, large young population.
- Japan: Strong consumer confidence in digital payments, well-developed financial infrastructure.
- South Korea: High technological adoption, advanced mobile network infrastructure.
- Rest of APAC: Growing smartphone penetration, increasing internet access, expanding e-commerce sector.
APAP Mobile Payments Industry Product Innovations
The APAC mobile payments industry is witnessing continuous product innovation, focusing on enhancing security, convenience, and user experience. New features like biometric authentication, tokenization, and AI-powered fraud detection are becoming increasingly prevalent. The integration of mobile payment solutions with other financial services, creating "super apps," is a major trend. These innovations are enhancing market fit by addressing consumer demands for seamless, secure, and versatile payment options.
Report Scope & Segmentation Analysis
This report provides a granular segmentation of the APAC mobile payments market, categorized by payment type (Proximity Payment, Remote Payment), end-user industry (BFSI, IT & Telecommunication, Retail, Healthcare, Government, Media & Entertainment, Transportation & Logistics, Other End-User), and specific countries (China, India, Japan, South Korea, and the Rest of APAC). A detailed analysis of each segment's growth trajectory, precise market sizing, and competitive landscape is presented, offering a holistic market overview and valuable insights for strategic decision-making.
Key Drivers of APAC Mobile Payments Industry Growth
Several factors are driving the growth of the APAC mobile payments industry:
- Technological advancements: NFC technology, biometric authentication, improved mobile security.
- Government initiatives: Promotion of digital payments, reduction of cash dependency.
- Economic growth: Rising disposable incomes, increased online shopping, and expansion of e-commerce.
Challenges in the APAC Mobile Payments Industry Sector
Despite its impressive growth, the APAC mobile payments industry faces several key challenges that must be addressed for continued sustainable expansion:
- Regulatory Fragmentation: Inconsistencies and variations in regulations across different APAC countries create significant hurdles for seamless cross-border transactions and hinder the development of a truly unified regional market.
- Heightened Security Concerns: The increasing reliance on mobile payments necessitates robust security measures to mitigate the risks of data breaches, fraud, and other cyber threats. Consumer trust is paramount and requires continuous improvement in security protocols.
- Infrastructure Gaps: Uneven internet penetration and the lack of robust digital infrastructure in certain regions, particularly rural areas, pose a significant barrier to widespread adoption of mobile payment solutions. Addressing this digital divide is crucial for inclusive growth.
- Consumer Education and Trust: Building trust and educating users about the security and benefits of mobile payment systems remains a crucial factor in driving broader adoption, especially among older demographics or those less familiar with digital technologies.
Emerging Opportunities in APAC Mobile Payments Industry
Several opportunities exist within the APAC mobile payments industry:
- Expansion into rural markets: Significant untapped potential in less developed areas.
- Development of innovative payment solutions: Focus on solutions tailored to specific needs.
- Growth of cross-border payments: Facilitate seamless transactions across borders.
Leading Players in the APAC Mobile Payments Industry Market
- Visa Inc
- Paypal Inc
- Samsung Group
- WeChat (Tencent Holdings Limited)
- Google LLC
- Comviva Technologies Limited (A Tech Mahindra Company)
- Amazon com Inc
- Alipay com Co Ltd
- Mastercard Inc
- Paytm (One97 Communications Limited)
- American Express Co
Key Developments in APAC Mobile Payments Industry Industry
- June 2022: ComfortDelGro Taxi and Alipay+ partnership enables Touch 'n Go eWallet and Kakao Pay for taxi payments in Singapore.
- March 2022: HDFC Bank launches PayZapp 2.0, a comprehensive payments app with UPI enabled.
Future Outlook for APAC Mobile Payments Industry Market
The future of the APAC mobile payments market remains exceptionally bright, with sustained high growth anticipated, driven by continuous technological advancements, the ongoing proliferation of smartphones, and supportive government policies promoting digital financial inclusion. Strategic partnerships, expansion into new and underserved markets, and the development of innovative and user-friendly payment solutions will be instrumental in shaping the industry's trajectory. The market's growth will be further fueled by the accelerating pace of digitalization across the region and the ever-increasing adoption of mobile payment solutions across all sectors of society.
APAC Mobile Payments Industry Segmentation
-
1. Type
- 1.1. Proximity Payment
- 1.2. Remote Payment
-
2. End-User Industry
- 2.1. BFSI
- 2.2. IT and Telecommunication
- 2.3. Retail
- 2.4. Healthcare
- 2.5. Government
- 2.6. Media and Entertainment
- 2.7. Transportation and Logistics
- 2.8. Other End User
APAC Mobile Payments Industry Segmentation By Geography
-
1. North America
- 1.1. United States
- 1.2. Canada
- 1.3. Mexico
-
2. South America
- 2.1. Brazil
- 2.2. Argentina
- 2.3. Rest of South America
-
3. Europe
- 3.1. United Kingdom
- 3.2. Germany
- 3.3. France
- 3.4. Italy
- 3.5. Spain
- 3.6. Russia
- 3.7. Benelux
- 3.8. Nordics
- 3.9. Rest of Europe
-
4. Middle East & Africa
- 4.1. Turkey
- 4.2. Israel
- 4.3. GCC
- 4.4. North Africa
- 4.5. South Africa
- 4.6. Rest of Middle East & Africa
-
5. Asia Pacific
- 5.1. China
- 5.2. India
- 5.3. Japan
- 5.4. South Korea
- 5.5. ASEAN
- 5.6. Oceania
- 5.7. Rest of Asia Pacific
APAC Mobile Payments Industry REPORT HIGHLIGHTS
| Aspects | Details |
|---|---|
| Study Period | 2019-2033 |
| Base Year | 2024 |
| Estimated Year | 2025 |
| Forecast Period | 2025-2033 |
| Historical Period | 2019-2024 |
| Growth Rate | CAGR of 23.91% from 2019-2033 |
| Segmentation |
|
Table of Contents
- 1. Introduction
- 1.1. Research Scope
- 1.2. Market Segmentation
- 1.3. Research Methodology
- 1.4. Definitions and Assumptions
- 2. Executive Summary
- 2.1. Introduction
- 3. Market Dynamics
- 3.1. Introduction
- 3.2. Market Drivers
- 3.2.1. Increasing Internet Penetration and Growing M-commerce Market
- 3.3. Market Restrains
- 3.3.1. Security Issues Associated with Mobile Payments
- 3.4. Market Trends
- 3.4.1. Retail Industry is one of the Factor Driving the Market
- 4. Market Factor Analysis
- 4.1. Porters Five Forces
- 4.2. Supply/Value Chain
- 4.3. PESTEL analysis
- 4.4. Market Entropy
- 4.5. Patent/Trademark Analysis
- 5. Global APAC Mobile Payments Industry Analysis, Insights and Forecast, 2019-2031
- 5.1. Market Analysis, Insights and Forecast - by Type
- 5.1.1. Proximity Payment
- 5.1.2. Remote Payment
- 5.2. Market Analysis, Insights and Forecast - by End-User Industry
- 5.2.1. BFSI
- 5.2.2. IT and Telecommunication
- 5.2.3. Retail
- 5.2.4. Healthcare
- 5.2.5. Government
- 5.2.6. Media and Entertainment
- 5.2.7. Transportation and Logistics
- 5.2.8. Other End User
- 5.3. Market Analysis, Insights and Forecast - by Region
- 5.3.1. North America
- 5.3.2. South America
- 5.3.3. Europe
- 5.3.4. Middle East & Africa
- 5.3.5. Asia Pacific
- 5.1. Market Analysis, Insights and Forecast - by Type
- 6. North America APAC Mobile Payments Industry Analysis, Insights and Forecast, 2019-2031
- 6.1. Market Analysis, Insights and Forecast - by Type
- 6.1.1. Proximity Payment
- 6.1.2. Remote Payment
- 6.2. Market Analysis, Insights and Forecast - by End-User Industry
- 6.2.1. BFSI
- 6.2.2. IT and Telecommunication
- 6.2.3. Retail
- 6.2.4. Healthcare
- 6.2.5. Government
- 6.2.6. Media and Entertainment
- 6.2.7. Transportation and Logistics
- 6.2.8. Other End User
- 6.1. Market Analysis, Insights and Forecast - by Type
- 7. South America APAC Mobile Payments Industry Analysis, Insights and Forecast, 2019-2031
- 7.1. Market Analysis, Insights and Forecast - by Type
- 7.1.1. Proximity Payment
- 7.1.2. Remote Payment
- 7.2. Market Analysis, Insights and Forecast - by End-User Industry
- 7.2.1. BFSI
- 7.2.2. IT and Telecommunication
- 7.2.3. Retail
- 7.2.4. Healthcare
- 7.2.5. Government
- 7.2.6. Media and Entertainment
- 7.2.7. Transportation and Logistics
- 7.2.8. Other End User
- 7.1. Market Analysis, Insights and Forecast - by Type
- 8. Europe APAC Mobile Payments Industry Analysis, Insights and Forecast, 2019-2031
- 8.1. Market Analysis, Insights and Forecast - by Type
- 8.1.1. Proximity Payment
- 8.1.2. Remote Payment
- 8.2. Market Analysis, Insights and Forecast - by End-User Industry
- 8.2.1. BFSI
- 8.2.2. IT and Telecommunication
- 8.2.3. Retail
- 8.2.4. Healthcare
- 8.2.5. Government
- 8.2.6. Media and Entertainment
- 8.2.7. Transportation and Logistics
- 8.2.8. Other End User
- 8.1. Market Analysis, Insights and Forecast - by Type
- 9. Middle East & Africa APAC Mobile Payments Industry Analysis, Insights and Forecast, 2019-2031
- 9.1. Market Analysis, Insights and Forecast - by Type
- 9.1.1. Proximity Payment
- 9.1.2. Remote Payment
- 9.2. Market Analysis, Insights and Forecast - by End-User Industry
- 9.2.1. BFSI
- 9.2.2. IT and Telecommunication
- 9.2.3. Retail
- 9.2.4. Healthcare
- 9.2.5. Government
- 9.2.6. Media and Entertainment
- 9.2.7. Transportation and Logistics
- 9.2.8. Other End User
- 9.1. Market Analysis, Insights and Forecast - by Type
- 10. Asia Pacific APAC Mobile Payments Industry Analysis, Insights and Forecast, 2019-2031
- 10.1. Market Analysis, Insights and Forecast - by Type
- 10.1.1. Proximity Payment
- 10.1.2. Remote Payment
- 10.2. Market Analysis, Insights and Forecast - by End-User Industry
- 10.2.1. BFSI
- 10.2.2. IT and Telecommunication
- 10.2.3. Retail
- 10.2.4. Healthcare
- 10.2.5. Government
- 10.2.6. Media and Entertainment
- 10.2.7. Transportation and Logistics
- 10.2.8. Other End User
- 10.1. Market Analysis, Insights and Forecast - by Type
- 11. North America APAC Mobile Payments Industry Analysis, Insights and Forecast, 2019-2031
- 11.1. Market Analysis, Insights and Forecast - By Country/Sub-region
- 11.1.1.
- 12. Europe APAC Mobile Payments Industry Analysis, Insights and Forecast, 2019-2031
- 12.1. Market Analysis, Insights and Forecast - By Country/Sub-region
- 12.1.1.
- 13. Asia Pacific APAC Mobile Payments Industry Analysis, Insights and Forecast, 2019-2031
- 13.1. Market Analysis, Insights and Forecast - By Country/Sub-region
- 13.1.1.
- 14. Latin America APAC Mobile Payments Industry Analysis, Insights and Forecast, 2019-2031
- 14.1. Market Analysis, Insights and Forecast - By Country/Sub-region
- 14.1.1.
- 15. Middle East APAC Mobile Payments Industry Analysis, Insights and Forecast, 2019-2031
- 15.1. Market Analysis, Insights and Forecast - By Country/Sub-region
- 15.1.1.
- 16. Competitive Analysis
- 16.1. Global Market Share Analysis 2024
- 16.2. Company Profiles
- 16.2.1 Visa Inc
- 16.2.1.1. Overview
- 16.2.1.2. Products
- 16.2.1.3. SWOT Analysis
- 16.2.1.4. Recent Developments
- 16.2.1.5. Financials (Based on Availability)
- 16.2.2 Paypal Inc
- 16.2.2.1. Overview
- 16.2.2.2. Products
- 16.2.2.3. SWOT Analysis
- 16.2.2.4. Recent Developments
- 16.2.2.5. Financials (Based on Availability)
- 16.2.3 Samsung Group
- 16.2.3.1. Overview
- 16.2.3.2. Products
- 16.2.3.3. SWOT Analysis
- 16.2.3.4. Recent Developments
- 16.2.3.5. Financials (Based on Availability)
- 16.2.4 WeChat (Tencent Holdings Limited)
- 16.2.4.1. Overview
- 16.2.4.2. Products
- 16.2.4.3. SWOT Analysis
- 16.2.4.4. Recent Developments
- 16.2.4.5. Financials (Based on Availability)
- 16.2.5 Google LLC
- 16.2.5.1. Overview
- 16.2.5.2. Products
- 16.2.5.3. SWOT Analysis
- 16.2.5.4. Recent Developments
- 16.2.5.5. Financials (Based on Availability)
- 16.2.6 Comviva Technologies Limited (A Tech Mahindra Company)
- 16.2.6.1. Overview
- 16.2.6.2. Products
- 16.2.6.3. SWOT Analysis
- 16.2.6.4. Recent Developments
- 16.2.6.5. Financials (Based on Availability)
- 16.2.7 Amazon com Inc
- 16.2.7.1. Overview
- 16.2.7.2. Products
- 16.2.7.3. SWOT Analysis
- 16.2.7.4. Recent Developments
- 16.2.7.5. Financials (Based on Availability)
- 16.2.8 Alipay com Co Ltd
- 16.2.8.1. Overview
- 16.2.8.2. Products
- 16.2.8.3. SWOT Analysis
- 16.2.8.4. Recent Developments
- 16.2.8.5. Financials (Based on Availability)
- 16.2.9 Mastercard Inc
- 16.2.9.1. Overview
- 16.2.9.2. Products
- 16.2.9.3. SWOT Analysis
- 16.2.9.4. Recent Developments
- 16.2.9.5. Financials (Based on Availability)
- 16.2.10 Paytm (One97 Communications Limited)
- 16.2.10.1. Overview
- 16.2.10.2. Products
- 16.2.10.3. SWOT Analysis
- 16.2.10.4. Recent Developments
- 16.2.10.5. Financials (Based on Availability)
- 16.2.11 American Express Co
- 16.2.11.1. Overview
- 16.2.11.2. Products
- 16.2.11.3. SWOT Analysis
- 16.2.11.4. Recent Developments
- 16.2.11.5. Financials (Based on Availability)
- 16.2.1 Visa Inc
List of Figures
- Figure 1: Global APAC Mobile Payments Industry Revenue Breakdown (Million, %) by Region 2024 & 2032
- Figure 2: Global APAC Mobile Payments Industry Volume Breakdown (K Unit, %) by Region 2024 & 2032
- Figure 3: North America APAC Mobile Payments Industry Revenue (Million), by Country 2024 & 2032
- Figure 4: North America APAC Mobile Payments Industry Volume (K Unit), by Country 2024 & 2032
- Figure 5: North America APAC Mobile Payments Industry Revenue Share (%), by Country 2024 & 2032
- Figure 6: North America APAC Mobile Payments Industry Volume Share (%), by Country 2024 & 2032
- Figure 7: Europe APAC Mobile Payments Industry Revenue (Million), by Country 2024 & 2032
- Figure 8: Europe APAC Mobile Payments Industry Volume (K Unit), by Country 2024 & 2032
- Figure 9: Europe APAC Mobile Payments Industry Revenue Share (%), by Country 2024 & 2032
- Figure 10: Europe APAC Mobile Payments Industry Volume Share (%), by Country 2024 & 2032
- Figure 11: Asia Pacific APAC Mobile Payments Industry Revenue (Million), by Country 2024 & 2032
- Figure 12: Asia Pacific APAC Mobile Payments Industry Volume (K Unit), by Country 2024 & 2032
- Figure 13: Asia Pacific APAC Mobile Payments Industry Revenue Share (%), by Country 2024 & 2032
- Figure 14: Asia Pacific APAC Mobile Payments Industry Volume Share (%), by Country 2024 & 2032
- Figure 15: Latin America APAC Mobile Payments Industry Revenue (Million), by Country 2024 & 2032
- Figure 16: Latin America APAC Mobile Payments Industry Volume (K Unit), by Country 2024 & 2032
- Figure 17: Latin America APAC Mobile Payments Industry Revenue Share (%), by Country 2024 & 2032
- Figure 18: Latin America APAC Mobile Payments Industry Volume Share (%), by Country 2024 & 2032
- Figure 19: Middle East APAC Mobile Payments Industry Revenue (Million), by Country 2024 & 2032
- Figure 20: Middle East APAC Mobile Payments Industry Volume (K Unit), by Country 2024 & 2032
- Figure 21: Middle East APAC Mobile Payments Industry Revenue Share (%), by Country 2024 & 2032
- Figure 22: Middle East APAC Mobile Payments Industry Volume Share (%), by Country 2024 & 2032
- Figure 23: North America APAC Mobile Payments Industry Revenue (Million), by Type 2024 & 2032
- Figure 24: North America APAC Mobile Payments Industry Volume (K Unit), by Type 2024 & 2032
- Figure 25: North America APAC Mobile Payments Industry Revenue Share (%), by Type 2024 & 2032
- Figure 26: North America APAC Mobile Payments Industry Volume Share (%), by Type 2024 & 2032
- Figure 27: North America APAC Mobile Payments Industry Revenue (Million), by End-User Industry 2024 & 2032
- Figure 28: North America APAC Mobile Payments Industry Volume (K Unit), by End-User Industry 2024 & 2032
- Figure 29: North America APAC Mobile Payments Industry Revenue Share (%), by End-User Industry 2024 & 2032
- Figure 30: North America APAC Mobile Payments Industry Volume Share (%), by End-User Industry 2024 & 2032
- Figure 31: North America APAC Mobile Payments Industry Revenue (Million), by Country 2024 & 2032
- Figure 32: North America APAC Mobile Payments Industry Volume (K Unit), by Country 2024 & 2032
- Figure 33: North America APAC Mobile Payments Industry Revenue Share (%), by Country 2024 & 2032
- Figure 34: North America APAC Mobile Payments Industry Volume Share (%), by Country 2024 & 2032
- Figure 35: South America APAC Mobile Payments Industry Revenue (Million), by Type 2024 & 2032
- Figure 36: South America APAC Mobile Payments Industry Volume (K Unit), by Type 2024 & 2032
- Figure 37: South America APAC Mobile Payments Industry Revenue Share (%), by Type 2024 & 2032
- Figure 38: South America APAC Mobile Payments Industry Volume Share (%), by Type 2024 & 2032
- Figure 39: South America APAC Mobile Payments Industry Revenue (Million), by End-User Industry 2024 & 2032
- Figure 40: South America APAC Mobile Payments Industry Volume (K Unit), by End-User Industry 2024 & 2032
- Figure 41: South America APAC Mobile Payments Industry Revenue Share (%), by End-User Industry 2024 & 2032
- Figure 42: South America APAC Mobile Payments Industry Volume Share (%), by End-User Industry 2024 & 2032
- Figure 43: South America APAC Mobile Payments Industry Revenue (Million), by Country 2024 & 2032
- Figure 44: South America APAC Mobile Payments Industry Volume (K Unit), by Country 2024 & 2032
- Figure 45: South America APAC Mobile Payments Industry Revenue Share (%), by Country 2024 & 2032
- Figure 46: South America APAC Mobile Payments Industry Volume Share (%), by Country 2024 & 2032
- Figure 47: Europe APAC Mobile Payments Industry Revenue (Million), by Type 2024 & 2032
- Figure 48: Europe APAC Mobile Payments Industry Volume (K Unit), by Type 2024 & 2032
- Figure 49: Europe APAC Mobile Payments Industry Revenue Share (%), by Type 2024 & 2032
- Figure 50: Europe APAC Mobile Payments Industry Volume Share (%), by Type 2024 & 2032
- Figure 51: Europe APAC Mobile Payments Industry Revenue (Million), by End-User Industry 2024 & 2032
- Figure 52: Europe APAC Mobile Payments Industry Volume (K Unit), by End-User Industry 2024 & 2032
- Figure 53: Europe APAC Mobile Payments Industry Revenue Share (%), by End-User Industry 2024 & 2032
- Figure 54: Europe APAC Mobile Payments Industry Volume Share (%), by End-User Industry 2024 & 2032
- Figure 55: Europe APAC Mobile Payments Industry Revenue (Million), by Country 2024 & 2032
- Figure 56: Europe APAC Mobile Payments Industry Volume (K Unit), by Country 2024 & 2032
- Figure 57: Europe APAC Mobile Payments Industry Revenue Share (%), by Country 2024 & 2032
- Figure 58: Europe APAC Mobile Payments Industry Volume Share (%), by Country 2024 & 2032
- Figure 59: Middle East & Africa APAC Mobile Payments Industry Revenue (Million), by Type 2024 & 2032
- Figure 60: Middle East & Africa APAC Mobile Payments Industry Volume (K Unit), by Type 2024 & 2032
- Figure 61: Middle East & Africa APAC Mobile Payments Industry Revenue Share (%), by Type 2024 & 2032
- Figure 62: Middle East & Africa APAC Mobile Payments Industry Volume Share (%), by Type 2024 & 2032
- Figure 63: Middle East & Africa APAC Mobile Payments Industry Revenue (Million), by End-User Industry 2024 & 2032
- Figure 64: Middle East & Africa APAC Mobile Payments Industry Volume (K Unit), by End-User Industry 2024 & 2032
- Figure 65: Middle East & Africa APAC Mobile Payments Industry Revenue Share (%), by End-User Industry 2024 & 2032
- Figure 66: Middle East & Africa APAC Mobile Payments Industry Volume Share (%), by End-User Industry 2024 & 2032
- Figure 67: Middle East & Africa APAC Mobile Payments Industry Revenue (Million), by Country 2024 & 2032
- Figure 68: Middle East & Africa APAC Mobile Payments Industry Volume (K Unit), by Country 2024 & 2032
- Figure 69: Middle East & Africa APAC Mobile Payments Industry Revenue Share (%), by Country 2024 & 2032
- Figure 70: Middle East & Africa APAC Mobile Payments Industry Volume Share (%), by Country 2024 & 2032
- Figure 71: Asia Pacific APAC Mobile Payments Industry Revenue (Million), by Type 2024 & 2032
- Figure 72: Asia Pacific APAC Mobile Payments Industry Volume (K Unit), by Type 2024 & 2032
- Figure 73: Asia Pacific APAC Mobile Payments Industry Revenue Share (%), by Type 2024 & 2032
- Figure 74: Asia Pacific APAC Mobile Payments Industry Volume Share (%), by Type 2024 & 2032
- Figure 75: Asia Pacific APAC Mobile Payments Industry Revenue (Million), by End-User Industry 2024 & 2032
- Figure 76: Asia Pacific APAC Mobile Payments Industry Volume (K Unit), by End-User Industry 2024 & 2032
- Figure 77: Asia Pacific APAC Mobile Payments Industry Revenue Share (%), by End-User Industry 2024 & 2032
- Figure 78: Asia Pacific APAC Mobile Payments Industry Volume Share (%), by End-User Industry 2024 & 2032
- Figure 79: Asia Pacific APAC Mobile Payments Industry Revenue (Million), by Country 2024 & 2032
- Figure 80: Asia Pacific APAC Mobile Payments Industry Volume (K Unit), by Country 2024 & 2032
- Figure 81: Asia Pacific APAC Mobile Payments Industry Revenue Share (%), by Country 2024 & 2032
- Figure 82: Asia Pacific APAC Mobile Payments Industry Volume Share (%), by Country 2024 & 2032
List of Tables
- Table 1: Global APAC Mobile Payments Industry Revenue Million Forecast, by Region 2019 & 2032
- Table 2: Global APAC Mobile Payments Industry Volume K Unit Forecast, by Region 2019 & 2032
- Table 3: Global APAC Mobile Payments Industry Revenue Million Forecast, by Type 2019 & 2032
- Table 4: Global APAC Mobile Payments Industry Volume K Unit Forecast, by Type 2019 & 2032
- Table 5: Global APAC Mobile Payments Industry Revenue Million Forecast, by End-User Industry 2019 & 2032
- Table 6: Global APAC Mobile Payments Industry Volume K Unit Forecast, by End-User Industry 2019 & 2032
- Table 7: Global APAC Mobile Payments Industry Revenue Million Forecast, by Region 2019 & 2032
- Table 8: Global APAC Mobile Payments Industry Volume K Unit Forecast, by Region 2019 & 2032
- Table 9: Global APAC Mobile Payments Industry Revenue Million Forecast, by Country 2019 & 2032
- Table 10: Global APAC Mobile Payments Industry Volume K Unit Forecast, by Country 2019 & 2032
- Table 11: APAC Mobile Payments Industry Revenue (Million) Forecast, by Application 2019 & 2032
- Table 12: APAC Mobile Payments Industry Volume (K Unit) Forecast, by Application 2019 & 2032
- Table 13: Global APAC Mobile Payments Industry Revenue Million Forecast, by Country 2019 & 2032
- Table 14: Global APAC Mobile Payments Industry Volume K Unit Forecast, by Country 2019 & 2032
- Table 15: APAC Mobile Payments Industry Revenue (Million) Forecast, by Application 2019 & 2032
- Table 16: APAC Mobile Payments Industry Volume (K Unit) Forecast, by Application 2019 & 2032
- Table 17: Global APAC Mobile Payments Industry Revenue Million Forecast, by Country 2019 & 2032
- Table 18: Global APAC Mobile Payments Industry Volume K Unit Forecast, by Country 2019 & 2032
- Table 19: APAC Mobile Payments Industry Revenue (Million) Forecast, by Application 2019 & 2032
- Table 20: APAC Mobile Payments Industry Volume (K Unit) Forecast, by Application 2019 & 2032
- Table 21: Global APAC Mobile Payments Industry Revenue Million Forecast, by Country 2019 & 2032
- Table 22: Global APAC Mobile Payments Industry Volume K Unit Forecast, by Country 2019 & 2032
- Table 23: APAC Mobile Payments Industry Revenue (Million) Forecast, by Application 2019 & 2032
- Table 24: APAC Mobile Payments Industry Volume (K Unit) Forecast, by Application 2019 & 2032
- Table 25: Global APAC Mobile Payments Industry Revenue Million Forecast, by Country 2019 & 2032
- Table 26: Global APAC Mobile Payments Industry Volume K Unit Forecast, by Country 2019 & 2032
- Table 27: APAC Mobile Payments Industry Revenue (Million) Forecast, by Application 2019 & 2032
- Table 28: APAC Mobile Payments Industry Volume (K Unit) Forecast, by Application 2019 & 2032
- Table 29: Global APAC Mobile Payments Industry Revenue Million Forecast, by Type 2019 & 2032
- Table 30: Global APAC Mobile Payments Industry Volume K Unit Forecast, by Type 2019 & 2032
- Table 31: Global APAC Mobile Payments Industry Revenue Million Forecast, by End-User Industry 2019 & 2032
- Table 32: Global APAC Mobile Payments Industry Volume K Unit Forecast, by End-User Industry 2019 & 2032
- Table 33: Global APAC Mobile Payments Industry Revenue Million Forecast, by Country 2019 & 2032
- Table 34: Global APAC Mobile Payments Industry Volume K Unit Forecast, by Country 2019 & 2032
- Table 35: United States APAC Mobile Payments Industry Revenue (Million) Forecast, by Application 2019 & 2032
- Table 36: United States APAC Mobile Payments Industry Volume (K Unit) Forecast, by Application 2019 & 2032
- Table 37: Canada APAC Mobile Payments Industry Revenue (Million) Forecast, by Application 2019 & 2032
- Table 38: Canada APAC Mobile Payments Industry Volume (K Unit) Forecast, by Application 2019 & 2032
- Table 39: Mexico APAC Mobile Payments Industry Revenue (Million) Forecast, by Application 2019 & 2032
- Table 40: Mexico APAC Mobile Payments Industry Volume (K Unit) Forecast, by Application 2019 & 2032
- Table 41: Global APAC Mobile Payments Industry Revenue Million Forecast, by Type 2019 & 2032
- Table 42: Global APAC Mobile Payments Industry Volume K Unit Forecast, by Type 2019 & 2032
- Table 43: Global APAC Mobile Payments Industry Revenue Million Forecast, by End-User Industry 2019 & 2032
- Table 44: Global APAC Mobile Payments Industry Volume K Unit Forecast, by End-User Industry 2019 & 2032
- Table 45: Global APAC Mobile Payments Industry Revenue Million Forecast, by Country 2019 & 2032
- Table 46: Global APAC Mobile Payments Industry Volume K Unit Forecast, by Country 2019 & 2032
- Table 47: Brazil APAC Mobile Payments Industry Revenue (Million) Forecast, by Application 2019 & 2032
- Table 48: Brazil APAC Mobile Payments Industry Volume (K Unit) Forecast, by Application 2019 & 2032
- Table 49: Argentina APAC Mobile Payments Industry Revenue (Million) Forecast, by Application 2019 & 2032
- Table 50: Argentina APAC Mobile Payments Industry Volume (K Unit) Forecast, by Application 2019 & 2032
- Table 51: Rest of South America APAC Mobile Payments Industry Revenue (Million) Forecast, by Application 2019 & 2032
- Table 52: Rest of South America APAC Mobile Payments Industry Volume (K Unit) Forecast, by Application 2019 & 2032
- Table 53: Global APAC Mobile Payments Industry Revenue Million Forecast, by Type 2019 & 2032
- Table 54: Global APAC Mobile Payments Industry Volume K Unit Forecast, by Type 2019 & 2032
- Table 55: Global APAC Mobile Payments Industry Revenue Million Forecast, by End-User Industry 2019 & 2032
- Table 56: Global APAC Mobile Payments Industry Volume K Unit Forecast, by End-User Industry 2019 & 2032
- Table 57: Global APAC Mobile Payments Industry Revenue Million Forecast, by Country 2019 & 2032
- Table 58: Global APAC Mobile Payments Industry Volume K Unit Forecast, by Country 2019 & 2032
- Table 59: United Kingdom APAC Mobile Payments Industry Revenue (Million) Forecast, by Application 2019 & 2032
- Table 60: United Kingdom APAC Mobile Payments Industry Volume (K Unit) Forecast, by Application 2019 & 2032
- Table 61: Germany APAC Mobile Payments Industry Revenue (Million) Forecast, by Application 2019 & 2032
- Table 62: Germany APAC Mobile Payments Industry Volume (K Unit) Forecast, by Application 2019 & 2032
- Table 63: France APAC Mobile Payments Industry Revenue (Million) Forecast, by Application 2019 & 2032
- Table 64: France APAC Mobile Payments Industry Volume (K Unit) Forecast, by Application 2019 & 2032
- Table 65: Italy APAC Mobile Payments Industry Revenue (Million) Forecast, by Application 2019 & 2032
- Table 66: Italy APAC Mobile Payments Industry Volume (K Unit) Forecast, by Application 2019 & 2032
- Table 67: Spain APAC Mobile Payments Industry Revenue (Million) Forecast, by Application 2019 & 2032
- Table 68: Spain APAC Mobile Payments Industry Volume (K Unit) Forecast, by Application 2019 & 2032
- Table 69: Russia APAC Mobile Payments Industry Revenue (Million) Forecast, by Application 2019 & 2032
- Table 70: Russia APAC Mobile Payments Industry Volume (K Unit) Forecast, by Application 2019 & 2032
- Table 71: Benelux APAC Mobile Payments Industry Revenue (Million) Forecast, by Application 2019 & 2032
- Table 72: Benelux APAC Mobile Payments Industry Volume (K Unit) Forecast, by Application 2019 & 2032
- Table 73: Nordics APAC Mobile Payments Industry Revenue (Million) Forecast, by Application 2019 & 2032
- Table 74: Nordics APAC Mobile Payments Industry Volume (K Unit) Forecast, by Application 2019 & 2032
- Table 75: Rest of Europe APAC Mobile Payments Industry Revenue (Million) Forecast, by Application 2019 & 2032
- Table 76: Rest of Europe APAC Mobile Payments Industry Volume (K Unit) Forecast, by Application 2019 & 2032
- Table 77: Global APAC Mobile Payments Industry Revenue Million Forecast, by Type 2019 & 2032
- Table 78: Global APAC Mobile Payments Industry Volume K Unit Forecast, by Type 2019 & 2032
- Table 79: Global APAC Mobile Payments Industry Revenue Million Forecast, by End-User Industry 2019 & 2032
- Table 80: Global APAC Mobile Payments Industry Volume K Unit Forecast, by End-User Industry 2019 & 2032
- Table 81: Global APAC Mobile Payments Industry Revenue Million Forecast, by Country 2019 & 2032
- Table 82: Global APAC Mobile Payments Industry Volume K Unit Forecast, by Country 2019 & 2032
- Table 83: Turkey APAC Mobile Payments Industry Revenue (Million) Forecast, by Application 2019 & 2032
- Table 84: Turkey APAC Mobile Payments Industry Volume (K Unit) Forecast, by Application 2019 & 2032
- Table 85: Israel APAC Mobile Payments Industry Revenue (Million) Forecast, by Application 2019 & 2032
- Table 86: Israel APAC Mobile Payments Industry Volume (K Unit) Forecast, by Application 2019 & 2032
- Table 87: GCC APAC Mobile Payments Industry Revenue (Million) Forecast, by Application 2019 & 2032
- Table 88: GCC APAC Mobile Payments Industry Volume (K Unit) Forecast, by Application 2019 & 2032
- Table 89: North Africa APAC Mobile Payments Industry Revenue (Million) Forecast, by Application 2019 & 2032
- Table 90: North Africa APAC Mobile Payments Industry Volume (K Unit) Forecast, by Application 2019 & 2032
- Table 91: South Africa APAC Mobile Payments Industry Revenue (Million) Forecast, by Application 2019 & 2032
- Table 92: South Africa APAC Mobile Payments Industry Volume (K Unit) Forecast, by Application 2019 & 2032
- Table 93: Rest of Middle East & Africa APAC Mobile Payments Industry Revenue (Million) Forecast, by Application 2019 & 2032
- Table 94: Rest of Middle East & Africa APAC Mobile Payments Industry Volume (K Unit) Forecast, by Application 2019 & 2032
- Table 95: Global APAC Mobile Payments Industry Revenue Million Forecast, by Type 2019 & 2032
- Table 96: Global APAC Mobile Payments Industry Volume K Unit Forecast, by Type 2019 & 2032
- Table 97: Global APAC Mobile Payments Industry Revenue Million Forecast, by End-User Industry 2019 & 2032
- Table 98: Global APAC Mobile Payments Industry Volume K Unit Forecast, by End-User Industry 2019 & 2032
- Table 99: Global APAC Mobile Payments Industry Revenue Million Forecast, by Country 2019 & 2032
- Table 100: Global APAC Mobile Payments Industry Volume K Unit Forecast, by Country 2019 & 2032
- Table 101: China APAC Mobile Payments Industry Revenue (Million) Forecast, by Application 2019 & 2032
- Table 102: China APAC Mobile Payments Industry Volume (K Unit) Forecast, by Application 2019 & 2032
- Table 103: India APAC Mobile Payments Industry Revenue (Million) Forecast, by Application 2019 & 2032
- Table 104: India APAC Mobile Payments Industry Volume (K Unit) Forecast, by Application 2019 & 2032
- Table 105: Japan APAC Mobile Payments Industry Revenue (Million) Forecast, by Application 2019 & 2032
- Table 106: Japan APAC Mobile Payments Industry Volume (K Unit) Forecast, by Application 2019 & 2032
- Table 107: South Korea APAC Mobile Payments Industry Revenue (Million) Forecast, by Application 2019 & 2032
- Table 108: South Korea APAC Mobile Payments Industry Volume (K Unit) Forecast, by Application 2019 & 2032
- Table 109: ASEAN APAC Mobile Payments Industry Revenue (Million) Forecast, by Application 2019 & 2032
- Table 110: ASEAN APAC Mobile Payments Industry Volume (K Unit) Forecast, by Application 2019 & 2032
- Table 111: Oceania APAC Mobile Payments Industry Revenue (Million) Forecast, by Application 2019 & 2032
- Table 112: Oceania APAC Mobile Payments Industry Volume (K Unit) Forecast, by Application 2019 & 2032
- Table 113: Rest of Asia Pacific APAC Mobile Payments Industry Revenue (Million) Forecast, by Application 2019 & 2032
- Table 114: Rest of Asia Pacific APAC Mobile Payments Industry Volume (K Unit) Forecast, by Application 2019 & 2032
Frequently Asked Questions
1. What is the projected Compound Annual Growth Rate (CAGR) of the APAC Mobile Payments Industry?
The projected CAGR is approximately 23.91%.
2. Which companies are prominent players in the APAC Mobile Payments Industry?
Key companies in the market include Visa Inc, Paypal Inc, Samsung Group, WeChat (Tencent Holdings Limited), Google LLC, Comviva Technologies Limited (A Tech Mahindra Company), Amazon com Inc, Alipay com Co Ltd, Mastercard Inc, Paytm (One97 Communications Limited), American Express Co.
3. What are the main segments of the APAC Mobile Payments Industry?
The market segments include Type, End-User Industry.
4. Can you provide details about the market size?
The market size is estimated to be USD XX Million as of 2022.
5. What are some drivers contributing to market growth?
Increasing Internet Penetration and Growing M-commerce Market.
6. What are the notable trends driving market growth?
Retail Industry is one of the Factor Driving the Market.
7. Are there any restraints impacting market growth?
Security Issues Associated with Mobile Payments.
8. Can you provide examples of recent developments in the market?
June 2022 - ComfortDelGro Taxi and Alipay+ announced a partnership that enables mobile payments from Malaysia and South Korea, namely the Touch 'n Go eWallet and Kakao Pay, to be accepted as cashless payment options in all its Comfort and CityCab taxis. Users of these mobile wallets can pay for the cab fare simply through the wallet apps without needing to exchange currency.
9. What pricing options are available for accessing the report?
Pricing options include single-user, multi-user, and enterprise licenses priced at USD 4750, USD 4950, and USD 6800 respectively.
10. Is the market size provided in terms of value or volume?
The market size is provided in terms of value, measured in Million and volume, measured in K Unit.
11. Are there any specific market keywords associated with the report?
Yes, the market keyword associated with the report is "APAC Mobile Payments Industry," which aids in identifying and referencing the specific market segment covered.
12. How do I determine which pricing option suits my needs best?
The pricing options vary based on user requirements and access needs. Individual users may opt for single-user licenses, while businesses requiring broader access may choose multi-user or enterprise licenses for cost-effective access to the report.
13. Are there any additional resources or data provided in the APAC Mobile Payments Industry report?
While the report offers comprehensive insights, it's advisable to review the specific contents or supplementary materials provided to ascertain if additional resources or data are available.
14. How can I stay updated on further developments or reports in the APAC Mobile Payments Industry?
To stay informed about further developments, trends, and reports in the APAC Mobile Payments Industry, consider subscribing to industry newsletters, following relevant companies and organizations, or regularly checking reputable industry news sources and publications.
Methodology
Step 1 - Identification of Relevant Samples Size from Population Database


Step 2 - Approaches for Defining Global Market Size (Value, Volume* & Price*)

Note*: In applicable scenarios
Step 3 - Data Sources
Primary Research
- Web Analytics
- Survey Reports
- Research Institute
- Latest Research Reports
- Opinion Leaders
Secondary Research
- Annual Reports
- White Paper
- Latest Press Release
- Industry Association
- Paid Database
- Investor Presentations

Step 4 - Data Triangulation
Involves using different sources of information in order to increase the validity of a study
These sources are likely to be stakeholders in a program - participants, other researchers, program staff, other community members, and so on.
Then we put all data in single framework & apply various statistical tools to find out the dynamic on the market.
During the analysis stage, feedback from the stakeholder groups would be compared to determine areas of agreement as well as areas of divergence


