
Key Insights
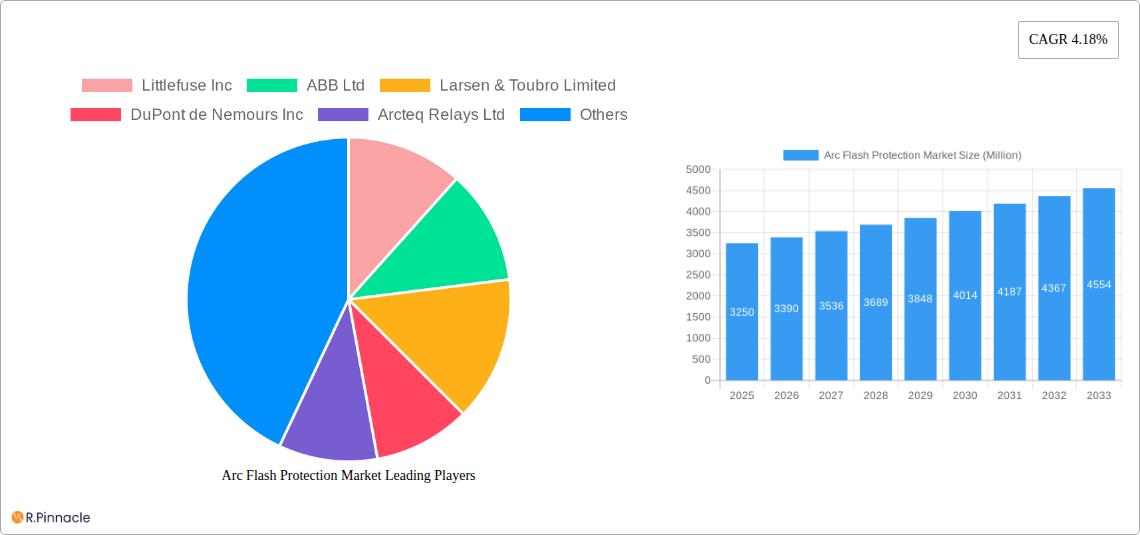
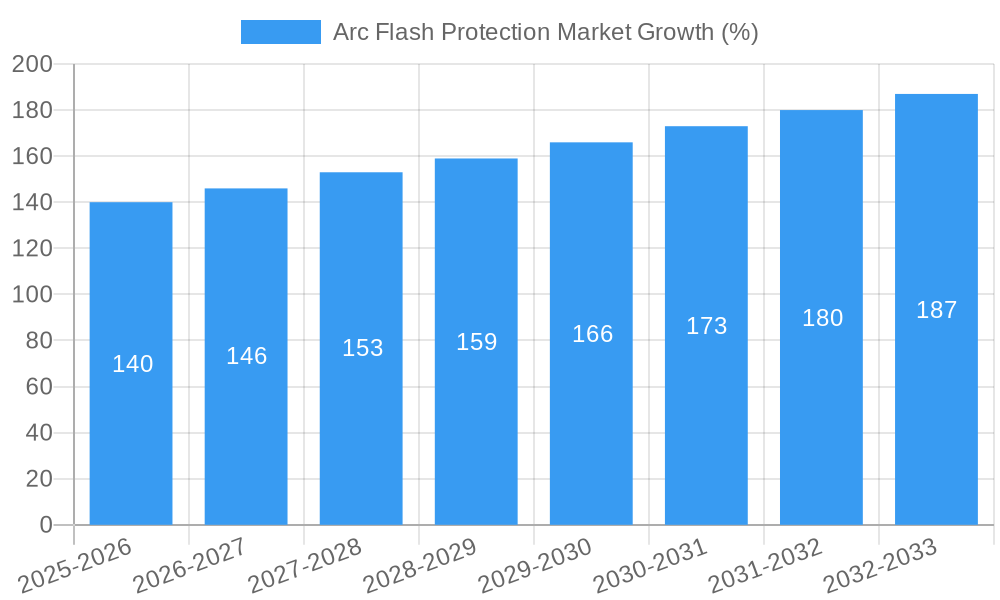
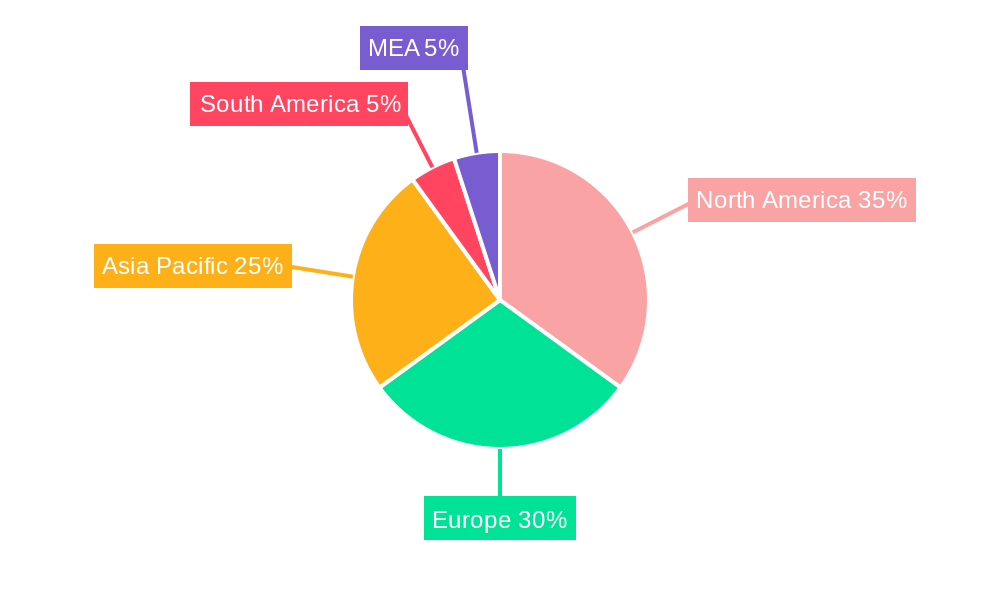
The global Arc Flash Protection market, valued at $3.25 billion in 2025, is projected to experience robust growth, driven by increasing industrial automation, stringent safety regulations, and rising awareness of arc flash hazards across various sectors. The market's Compound Annual Growth Rate (CAGR) of 4.18% from 2025 to 2033 indicates a steady expansion, fueled by significant investments in upgrading electrical infrastructure and implementing comprehensive safety protocols. Key growth drivers include the burgeoning demand for advanced arc flash detection and control systems, coupled with a growing preference for high-quality personal protective equipment (PPE) among industrial workers. The utilities, manufacturing & processing, and oil & gas sectors are major end-users, contributing significantly to market revenue. Geographic expansion is also expected, with North America and Europe currently dominating the market, while Asia-Pacific is poised for significant growth due to rapid industrialization and infrastructure development in countries like China and India. Competitive dynamics are shaped by the presence of established players like ABB, Siemens, and Eaton, alongside specialized companies focusing on niche technologies.
Continued market expansion will depend on technological advancements, particularly in the development of smarter, more integrated arc flash protection systems capable of real-time hazard detection and mitigation. Furthermore, government initiatives promoting workplace safety and stricter enforcement of safety standards will further accelerate market growth. However, the market might face challenges related to high initial investment costs for advanced systems, especially for smaller companies. Furthermore, economic fluctuations and potential supply chain disruptions could influence overall market growth. Despite these challenges, the long-term outlook for the arc flash protection market remains positive, underpinned by a growing emphasis on workplace safety and the inherent risks associated with electrical hazards in various industrial settings. The market is anticipated to see increased adoption of IoT-enabled solutions for remote monitoring and predictive maintenance, enhancing safety and operational efficiency.
Arc Flash Protection Market Report: 2019-2033 Forecast
This comprehensive report provides a detailed analysis of the Arc Flash Protection market, offering actionable insights for industry professionals and investors. Covering the period 2019-2033, with a focus on 2025, this report analyzes market structure, dynamics, key players, and future growth potential. The report's detailed segmentation allows for a granular understanding of market trends across various equipment types and end-user industries. The estimated market size in 2025 is valued at xx Million, with a projected CAGR of xx% during the forecast period (2025-2033).
Arc Flash Protection Market Market Structure & Innovation Trends
The Arc Flash Protection market exhibits a moderately consolidated structure, with key players such as Littlefuse Inc, ABB Ltd, Larsen & Toubro Limited, DuPont de Nemours Inc, Arcteq Relays Ltd, Siemens AG, Schneider Electric SE, NR Electric Co Ltd, Eaton Corporation Plc, and General Electric Company holding significant market share. The combined market share of the top five players is estimated at xx%. Innovation is driven by stringent safety regulations, increasing awareness of arc flash hazards, and advancements in sensor technology and protective equipment design. Regulatory frameworks like OSHA standards in the US and equivalent regulations globally significantly influence market growth. Product substitutes are limited, primarily focusing on alternative safety procedures, but the effectiveness and cost-efficiency of dedicated arc flash protection solutions often make them the preferred choice. M&A activity has been moderate in recent years, with deal values averaging xx Million per transaction. End-user demographics are largely industrial, concentrated in sectors like utilities, manufacturing, and oil & gas.
- Market Concentration: Moderately Consolidated (Top 5 players hold xx% market share)
- Innovation Drivers: Stringent safety regulations, technological advancements, increasing awareness of arc flash hazards.
- Regulatory Frameworks: OSHA standards (US) and equivalent global regulations.
- Product Substitutes: Limited, primarily alternative safety procedures.
- M&A Activity: Moderate, with average deal values of xx Million.
- End-User Demographics: Primarily industrial sectors (Utilities, Manufacturing, Oil & Gas).
Arc Flash Protection Market Market Dynamics & Trends
The Arc Flash Protection market is experiencing robust growth, driven by factors such as rising industrialization, increasing electricity demand, and stricter safety regulations worldwide. Technological disruptions, including the integration of smart sensors and IoT capabilities into arc flash detection systems, are enhancing the efficiency and effectiveness of protection solutions. Consumer preferences are shifting towards more advanced, user-friendly, and comfortable Personal Protective Equipment (PPE). Competitive dynamics are characterized by both intense competition among established players and the emergence of niche players offering specialized solutions. The market is anticipated to grow at a CAGR of xx% from 2025 to 2033, driven primarily by increasing adoption in developing economies and the continuous need for enhanced workplace safety measures. Market penetration is currently estimated at xx% in developed countries and xx% in developing countries, with significant potential for growth.
Dominant Regions & Segments in Arc Flash Protection Market
North America currently dominates the Arc Flash Protection market, driven by stringent safety regulations, a robust industrial base, and high awareness of arc flash hazards. Within this region, the United States holds the largest market share. The Utilities sector is the dominant end-user segment, followed by the Manufacturing & Processing sector. Within equipment, Arc Flash Detection & Control Systems hold a larger market share compared to Personal Protection Equipment, primarily due to the increasing demand for comprehensive safety solutions.
- Key Drivers in North America: Stringent safety regulations, robust industrial base, high awareness of arc flash hazards.
- Key Drivers in Utilities Sector: Increasing electricity demand, stringent safety requirements for power grid operations.
- Key Drivers in Manufacturing & Processing Sector: High risk of arc flash incidents in industrial processes, stringent worker safety regulations.
Arc Flash Protection Market Product Innovations
Recent innovations include the integration of smart sensors and IoT capabilities in arc flash detection and control systems, offering real-time monitoring and improved response times. New PPE designs prioritize comfort, fit, and agility, while maintaining high levels of protection. These advancements enhance worker safety and increase the overall effectiveness of arc flash protection solutions. The market is seeing a trend towards more integrated and holistic solutions, combining detection, control, and PPE to provide comprehensive protection.
Report Scope & Segmentation Analysis
The report segments the Arc Flash Protection market based on Equipment (Arc Flash Detection & Control Systems, Personal Protection Equipment) and End-User (Utilities, Manufacturing & Processing, Oil & Gas, Other End-Users). Each segment is analyzed in detail, providing insights into growth projections, market size, and competitive dynamics. The Arc Flash Detection & Control Systems segment is projected to witness significant growth, driven by technological advancements and increasing demand for integrated safety solutions. The Personal Protection Equipment segment is expected to grow steadily, with a focus on improved comfort and enhanced protection features. The Utilities end-user segment holds the largest market share, followed by Manufacturing & Processing.
Key Drivers of Arc Flash Protection Market Growth
The Arc Flash Protection market is driven by stringent safety regulations across various industries, the increasing awareness of arc flash hazards, and technological advancements in detection and protection systems. Economic factors, such as rising industrialization and increasing electricity demand, also contribute to market growth. The development and adoption of new technologies like smart sensors and improved PPE are further accelerating market expansion.
Challenges in the Arc Flash Protection Market Sector
Challenges include the high initial investment costs associated with implementing arc flash protection systems, potential supply chain disruptions impacting the availability of components, and intense competition among established players. Regulatory compliance complexities and the need for specialized expertise in installation and maintenance can also hinder market penetration.
Emerging Opportunities in Arc Flash Protection Market
Emerging opportunities lie in the development of more advanced, integrated systems incorporating IoT and AI capabilities for predictive maintenance and enhanced safety. Expanding into new markets in developing economies presents significant growth potential. The demand for personalized PPE tailored to specific worker needs and ergonomic improvements represents a key area for innovation.
Leading Players in the Arc Flash Protection Market Market
- Littlefuse Inc
- ABB Ltd
- Larsen & Toubro Limited
- DuPont de Nemours Inc
- Arcteq Relays Ltd
- Siemens AG
- Schneider Electric SE
- NR Electric Co Ltd
- Eaton Corporation Plc
- General Electric Company
Key Developments in Arc Flash Protection Market Industry
- June 2022: Schneider Electric launched ArcBlok, a flash mitigation solution recognized for innovation at Electro Expo 2022.
- April 2023: Pyramex launched its GL3000 Series Arc Flash Protection gloves, focusing on comfort and agility.
Future Outlook for Arc Flash Protection Market Market
The Arc Flash Protection market is poised for continued growth, driven by ongoing technological advancements, increasing safety regulations, and expanding industrialization globally. Strategic partnerships, product innovation, and expansion into new markets will be crucial for players to capitalize on the significant market opportunities. The market is expected to witness substantial growth in developing economies, where awareness of arc flash hazards is increasing.
Arc Flash Protection Market Segmentation
-
1. Equipment
- 1.1. Arc Flash Detection & Control System
- 1.2. Personal Protection Equipment
-
2. End-User
- 2.1. Utilities
- 2.2. Manufacturing & Processing
- 2.3. Oil & Gas
- 2.4. Other End-Users
Arc Flash Protection Market Segmentation By Geography
-
1. North America
- 1.1. United States of America
- 1.2. Canada
- 1.3. Rest of the North America
-
2. Asia Pacific
- 2.1. China
- 2.2. India
- 2.3. South Korea
- 2.4. Rest of the Asia Pacific
-
3. Europe
- 3.1. United Kingdom
- 3.2. Germany
- 3.3. France
- 3.4. Italy
- 3.5. Rest of the Europe
-
4. South America
- 4.1. Brazil
- 4.2. Argentina
- 4.3. Rest of the South America
-
5. Middle East and Africa
- 5.1. United Arab Emirates
- 5.2. Saudi Arabia
- 5.3. Rest of the Middle East and Africa
Arc Flash Protection Market REPORT HIGHLIGHTS
| Aspects | Details |
|---|---|
| Study Period | 2019-2033 |
| Base Year | 2024 |
| Estimated Year | 2025 |
| Forecast Period | 2025-2033 |
| Historical Period | 2019-2024 |
| Growth Rate | CAGR of 4.18% from 2019-2033 |
| Segmentation |
|
Table of Contents
- 1. Introduction
- 1.1. Research Scope
- 1.2. Market Segmentation
- 1.3. Research Methodology
- 1.4. Definitions and Assumptions
- 2. Executive Summary
- 2.1. Introduction
- 3. Market Dynamics
- 3.1. Introduction
- 3.2. Market Drivers
- 3.2.1. 4.; Presence of Fire Safety Regulations4.; Increasing Industrialization across the World
- 3.3. Market Restrains
- 3.3.1. 4.; High Product Prices and Maintenance Costs
- 3.4. Market Trends
- 3.4.1. Utility Sector to Witness Significant Growth
- 4. Market Factor Analysis
- 4.1. Porters Five Forces
- 4.2. Supply/Value Chain
- 4.3. PESTEL analysis
- 4.4. Market Entropy
- 4.5. Patent/Trademark Analysis
- 5. Global Arc Flash Protection Market Analysis, Insights and Forecast, 2019-2031
- 5.1. Market Analysis, Insights and Forecast - by Equipment
- 5.1.1. Arc Flash Detection & Control System
- 5.1.2. Personal Protection Equipment
- 5.2. Market Analysis, Insights and Forecast - by End-User
- 5.2.1. Utilities
- 5.2.2. Manufacturing & Processing
- 5.2.3. Oil & Gas
- 5.2.4. Other End-Users
- 5.3. Market Analysis, Insights and Forecast - by Region
- 5.3.1. North America
- 5.3.2. Asia Pacific
- 5.3.3. Europe
- 5.3.4. South America
- 5.3.5. Middle East and Africa
- 5.1. Market Analysis, Insights and Forecast - by Equipment
- 6. North America Arc Flash Protection Market Analysis, Insights and Forecast, 2019-2031
- 6.1. Market Analysis, Insights and Forecast - by Equipment
- 6.1.1. Arc Flash Detection & Control System
- 6.1.2. Personal Protection Equipment
- 6.2. Market Analysis, Insights and Forecast - by End-User
- 6.2.1. Utilities
- 6.2.2. Manufacturing & Processing
- 6.2.3. Oil & Gas
- 6.2.4. Other End-Users
- 6.1. Market Analysis, Insights and Forecast - by Equipment
- 7. Asia Pacific Arc Flash Protection Market Analysis, Insights and Forecast, 2019-2031
- 7.1. Market Analysis, Insights and Forecast - by Equipment
- 7.1.1. Arc Flash Detection & Control System
- 7.1.2. Personal Protection Equipment
- 7.2. Market Analysis, Insights and Forecast - by End-User
- 7.2.1. Utilities
- 7.2.2. Manufacturing & Processing
- 7.2.3. Oil & Gas
- 7.2.4. Other End-Users
- 7.1. Market Analysis, Insights and Forecast - by Equipment
- 8. Europe Arc Flash Protection Market Analysis, Insights and Forecast, 2019-2031
- 8.1. Market Analysis, Insights and Forecast - by Equipment
- 8.1.1. Arc Flash Detection & Control System
- 8.1.2. Personal Protection Equipment
- 8.2. Market Analysis, Insights and Forecast - by End-User
- 8.2.1. Utilities
- 8.2.2. Manufacturing & Processing
- 8.2.3. Oil & Gas
- 8.2.4. Other End-Users
- 8.1. Market Analysis, Insights and Forecast - by Equipment
- 9. South America Arc Flash Protection Market Analysis, Insights and Forecast, 2019-2031
- 9.1. Market Analysis, Insights and Forecast - by Equipment
- 9.1.1. Arc Flash Detection & Control System
- 9.1.2. Personal Protection Equipment
- 9.2. Market Analysis, Insights and Forecast - by End-User
- 9.2.1. Utilities
- 9.2.2. Manufacturing & Processing
- 9.2.3. Oil & Gas
- 9.2.4. Other End-Users
- 9.1. Market Analysis, Insights and Forecast - by Equipment
- 10. Middle East and Africa Arc Flash Protection Market Analysis, Insights and Forecast, 2019-2031
- 10.1. Market Analysis, Insights and Forecast - by Equipment
- 10.1.1. Arc Flash Detection & Control System
- 10.1.2. Personal Protection Equipment
- 10.2. Market Analysis, Insights and Forecast - by End-User
- 10.2.1. Utilities
- 10.2.2. Manufacturing & Processing
- 10.2.3. Oil & Gas
- 10.2.4. Other End-Users
- 10.1. Market Analysis, Insights and Forecast - by Equipment
- 11. North America Arc Flash Protection Market Analysis, Insights and Forecast, 2019-2031
- 11.1. Market Analysis, Insights and Forecast - By Country/Sub-region
- 11.1.1 United States
- 11.1.2 Canada
- 11.1.3 Mexico
- 12. Europe Arc Flash Protection Market Analysis, Insights and Forecast, 2019-2031
- 12.1. Market Analysis, Insights and Forecast - By Country/Sub-region
- 12.1.1 Germany
- 12.1.2 United Kingdom
- 12.1.3 France
- 12.1.4 Spain
- 12.1.5 Italy
- 12.1.6 Spain
- 12.1.7 Belgium
- 12.1.8 Netherland
- 12.1.9 Nordics
- 12.1.10 Rest of Europe
- 13. Asia Pacific Arc Flash Protection Market Analysis, Insights and Forecast, 2019-2031
- 13.1. Market Analysis, Insights and Forecast - By Country/Sub-region
- 13.1.1 China
- 13.1.2 Japan
- 13.1.3 India
- 13.1.4 South Korea
- 13.1.5 Southeast Asia
- 13.1.6 Australia
- 13.1.7 Indonesia
- 13.1.8 Phillipes
- 13.1.9 Singapore
- 13.1.10 Thailandc
- 13.1.11 Rest of Asia Pacific
- 14. South America Arc Flash Protection Market Analysis, Insights and Forecast, 2019-2031
- 14.1. Market Analysis, Insights and Forecast - By Country/Sub-region
- 14.1.1 Brazil
- 14.1.2 Argentina
- 14.1.3 Peru
- 14.1.4 Chile
- 14.1.5 Colombia
- 14.1.6 Ecuador
- 14.1.7 Venezuela
- 14.1.8 Rest of South America
- 15. MEA Arc Flash Protection Market Analysis, Insights and Forecast, 2019-2031
- 15.1. Market Analysis, Insights and Forecast - By Country/Sub-region
- 15.1.1 United Arab Emirates
- 15.1.2 Saudi Arabia
- 15.1.3 South Africa
- 15.1.4 Rest of Middle East and Africa
- 16. Competitive Analysis
- 16.1. Global Market Share Analysis 2024
- 16.2. Company Profiles
- 16.2.1 Littlefuse Inc
- 16.2.1.1. Overview
- 16.2.1.2. Products
- 16.2.1.3. SWOT Analysis
- 16.2.1.4. Recent Developments
- 16.2.1.5. Financials (Based on Availability)
- 16.2.2 ABB Ltd
- 16.2.2.1. Overview
- 16.2.2.2. Products
- 16.2.2.3. SWOT Analysis
- 16.2.2.4. Recent Developments
- 16.2.2.5. Financials (Based on Availability)
- 16.2.3 Larsen & Toubro Limited
- 16.2.3.1. Overview
- 16.2.3.2. Products
- 16.2.3.3. SWOT Analysis
- 16.2.3.4. Recent Developments
- 16.2.3.5. Financials (Based on Availability)
- 16.2.4 DuPont de Nemours Inc
- 16.2.4.1. Overview
- 16.2.4.2. Products
- 16.2.4.3. SWOT Analysis
- 16.2.4.4. Recent Developments
- 16.2.4.5. Financials (Based on Availability)
- 16.2.5 Arcteq Relays Ltd
- 16.2.5.1. Overview
- 16.2.5.2. Products
- 16.2.5.3. SWOT Analysis
- 16.2.5.4. Recent Developments
- 16.2.5.5. Financials (Based on Availability)
- 16.2.6 Siemens AG
- 16.2.6.1. Overview
- 16.2.6.2. Products
- 16.2.6.3. SWOT Analysis
- 16.2.6.4. Recent Developments
- 16.2.6.5. Financials (Based on Availability)
- 16.2.7 Schneider Electric SE
- 16.2.7.1. Overview
- 16.2.7.2. Products
- 16.2.7.3. SWOT Analysis
- 16.2.7.4. Recent Developments
- 16.2.7.5. Financials (Based on Availability)
- 16.2.8 NR Electric Co Ltd
- 16.2.8.1. Overview
- 16.2.8.2. Products
- 16.2.8.3. SWOT Analysis
- 16.2.8.4. Recent Developments
- 16.2.8.5. Financials (Based on Availability)
- 16.2.9 Eaton Corporation Plc
- 16.2.9.1. Overview
- 16.2.9.2. Products
- 16.2.9.3. SWOT Analysis
- 16.2.9.4. Recent Developments
- 16.2.9.5. Financials (Based on Availability)
- 16.2.10 General Electric Company
- 16.2.10.1. Overview
- 16.2.10.2. Products
- 16.2.10.3. SWOT Analysis
- 16.2.10.4. Recent Developments
- 16.2.10.5. Financials (Based on Availability)
- 16.2.1 Littlefuse Inc
List of Figures
- Figure 1: Global Arc Flash Protection Market Revenue Breakdown (Million, %) by Region 2024 & 2032
- Figure 2: North America Arc Flash Protection Market Revenue (Million), by Country 2024 & 2032
- Figure 3: North America Arc Flash Protection Market Revenue Share (%), by Country 2024 & 2032
- Figure 4: Europe Arc Flash Protection Market Revenue (Million), by Country 2024 & 2032
- Figure 5: Europe Arc Flash Protection Market Revenue Share (%), by Country 2024 & 2032
- Figure 6: Asia Pacific Arc Flash Protection Market Revenue (Million), by Country 2024 & 2032
- Figure 7: Asia Pacific Arc Flash Protection Market Revenue Share (%), by Country 2024 & 2032
- Figure 8: South America Arc Flash Protection Market Revenue (Million), by Country 2024 & 2032
- Figure 9: South America Arc Flash Protection Market Revenue Share (%), by Country 2024 & 2032
- Figure 10: MEA Arc Flash Protection Market Revenue (Million), by Country 2024 & 2032
- Figure 11: MEA Arc Flash Protection Market Revenue Share (%), by Country 2024 & 2032
- Figure 12: North America Arc Flash Protection Market Revenue (Million), by Equipment 2024 & 2032
- Figure 13: North America Arc Flash Protection Market Revenue Share (%), by Equipment 2024 & 2032
- Figure 14: North America Arc Flash Protection Market Revenue (Million), by End-User 2024 & 2032
- Figure 15: North America Arc Flash Protection Market Revenue Share (%), by End-User 2024 & 2032
- Figure 16: North America Arc Flash Protection Market Revenue (Million), by Country 2024 & 2032
- Figure 17: North America Arc Flash Protection Market Revenue Share (%), by Country 2024 & 2032
- Figure 18: Asia Pacific Arc Flash Protection Market Revenue (Million), by Equipment 2024 & 2032
- Figure 19: Asia Pacific Arc Flash Protection Market Revenue Share (%), by Equipment 2024 & 2032
- Figure 20: Asia Pacific Arc Flash Protection Market Revenue (Million), by End-User 2024 & 2032
- Figure 21: Asia Pacific Arc Flash Protection Market Revenue Share (%), by End-User 2024 & 2032
- Figure 22: Asia Pacific Arc Flash Protection Market Revenue (Million), by Country 2024 & 2032
- Figure 23: Asia Pacific Arc Flash Protection Market Revenue Share (%), by Country 2024 & 2032
- Figure 24: Europe Arc Flash Protection Market Revenue (Million), by Equipment 2024 & 2032
- Figure 25: Europe Arc Flash Protection Market Revenue Share (%), by Equipment 2024 & 2032
- Figure 26: Europe Arc Flash Protection Market Revenue (Million), by End-User 2024 & 2032
- Figure 27: Europe Arc Flash Protection Market Revenue Share (%), by End-User 2024 & 2032
- Figure 28: Europe Arc Flash Protection Market Revenue (Million), by Country 2024 & 2032
- Figure 29: Europe Arc Flash Protection Market Revenue Share (%), by Country 2024 & 2032
- Figure 30: South America Arc Flash Protection Market Revenue (Million), by Equipment 2024 & 2032
- Figure 31: South America Arc Flash Protection Market Revenue Share (%), by Equipment 2024 & 2032
- Figure 32: South America Arc Flash Protection Market Revenue (Million), by End-User 2024 & 2032
- Figure 33: South America Arc Flash Protection Market Revenue Share (%), by End-User 2024 & 2032
- Figure 34: South America Arc Flash Protection Market Revenue (Million), by Country 2024 & 2032
- Figure 35: South America Arc Flash Protection Market Revenue Share (%), by Country 2024 & 2032
- Figure 36: Middle East and Africa Arc Flash Protection Market Revenue (Million), by Equipment 2024 & 2032
- Figure 37: Middle East and Africa Arc Flash Protection Market Revenue Share (%), by Equipment 2024 & 2032
- Figure 38: Middle East and Africa Arc Flash Protection Market Revenue (Million), by End-User 2024 & 2032
- Figure 39: Middle East and Africa Arc Flash Protection Market Revenue Share (%), by End-User 2024 & 2032
- Figure 40: Middle East and Africa Arc Flash Protection Market Revenue (Million), by Country 2024 & 2032
- Figure 41: Middle East and Africa Arc Flash Protection Market Revenue Share (%), by Country 2024 & 2032
List of Tables
- Table 1: Global Arc Flash Protection Market Revenue Million Forecast, by Region 2019 & 2032
- Table 2: Global Arc Flash Protection Market Revenue Million Forecast, by Equipment 2019 & 2032
- Table 3: Global Arc Flash Protection Market Revenue Million Forecast, by End-User 2019 & 2032
- Table 4: Global Arc Flash Protection Market Revenue Million Forecast, by Region 2019 & 2032
- Table 5: Global Arc Flash Protection Market Revenue Million Forecast, by Country 2019 & 2032
- Table 6: United States Arc Flash Protection Market Revenue (Million) Forecast, by Application 2019 & 2032
- Table 7: Canada Arc Flash Protection Market Revenue (Million) Forecast, by Application 2019 & 2032
- Table 8: Mexico Arc Flash Protection Market Revenue (Million) Forecast, by Application 2019 & 2032
- Table 9: Global Arc Flash Protection Market Revenue Million Forecast, by Country 2019 & 2032
- Table 10: Germany Arc Flash Protection Market Revenue (Million) Forecast, by Application 2019 & 2032
- Table 11: United Kingdom Arc Flash Protection Market Revenue (Million) Forecast, by Application 2019 & 2032
- Table 12: France Arc Flash Protection Market Revenue (Million) Forecast, by Application 2019 & 2032
- Table 13: Spain Arc Flash Protection Market Revenue (Million) Forecast, by Application 2019 & 2032
- Table 14: Italy Arc Flash Protection Market Revenue (Million) Forecast, by Application 2019 & 2032
- Table 15: Spain Arc Flash Protection Market Revenue (Million) Forecast, by Application 2019 & 2032
- Table 16: Belgium Arc Flash Protection Market Revenue (Million) Forecast, by Application 2019 & 2032
- Table 17: Netherland Arc Flash Protection Market Revenue (Million) Forecast, by Application 2019 & 2032
- Table 18: Nordics Arc Flash Protection Market Revenue (Million) Forecast, by Application 2019 & 2032
- Table 19: Rest of Europe Arc Flash Protection Market Revenue (Million) Forecast, by Application 2019 & 2032
- Table 20: Global Arc Flash Protection Market Revenue Million Forecast, by Country 2019 & 2032
- Table 21: China Arc Flash Protection Market Revenue (Million) Forecast, by Application 2019 & 2032
- Table 22: Japan Arc Flash Protection Market Revenue (Million) Forecast, by Application 2019 & 2032
- Table 23: India Arc Flash Protection Market Revenue (Million) Forecast, by Application 2019 & 2032
- Table 24: South Korea Arc Flash Protection Market Revenue (Million) Forecast, by Application 2019 & 2032
- Table 25: Southeast Asia Arc Flash Protection Market Revenue (Million) Forecast, by Application 2019 & 2032
- Table 26: Australia Arc Flash Protection Market Revenue (Million) Forecast, by Application 2019 & 2032
- Table 27: Indonesia Arc Flash Protection Market Revenue (Million) Forecast, by Application 2019 & 2032
- Table 28: Phillipes Arc Flash Protection Market Revenue (Million) Forecast, by Application 2019 & 2032
- Table 29: Singapore Arc Flash Protection Market Revenue (Million) Forecast, by Application 2019 & 2032
- Table 30: Thailandc Arc Flash Protection Market Revenue (Million) Forecast, by Application 2019 & 2032
- Table 31: Rest of Asia Pacific Arc Flash Protection Market Revenue (Million) Forecast, by Application 2019 & 2032
- Table 32: Global Arc Flash Protection Market Revenue Million Forecast, by Country 2019 & 2032
- Table 33: Brazil Arc Flash Protection Market Revenue (Million) Forecast, by Application 2019 & 2032
- Table 34: Argentina Arc Flash Protection Market Revenue (Million) Forecast, by Application 2019 & 2032
- Table 35: Peru Arc Flash Protection Market Revenue (Million) Forecast, by Application 2019 & 2032
- Table 36: Chile Arc Flash Protection Market Revenue (Million) Forecast, by Application 2019 & 2032
- Table 37: Colombia Arc Flash Protection Market Revenue (Million) Forecast, by Application 2019 & 2032
- Table 38: Ecuador Arc Flash Protection Market Revenue (Million) Forecast, by Application 2019 & 2032
- Table 39: Venezuela Arc Flash Protection Market Revenue (Million) Forecast, by Application 2019 & 2032
- Table 40: Rest of South America Arc Flash Protection Market Revenue (Million) Forecast, by Application 2019 & 2032
- Table 41: Global Arc Flash Protection Market Revenue Million Forecast, by Country 2019 & 2032
- Table 42: United Arab Emirates Arc Flash Protection Market Revenue (Million) Forecast, by Application 2019 & 2032
- Table 43: Saudi Arabia Arc Flash Protection Market Revenue (Million) Forecast, by Application 2019 & 2032
- Table 44: South Africa Arc Flash Protection Market Revenue (Million) Forecast, by Application 2019 & 2032
- Table 45: Rest of Middle East and Africa Arc Flash Protection Market Revenue (Million) Forecast, by Application 2019 & 2032
- Table 46: Global Arc Flash Protection Market Revenue Million Forecast, by Equipment 2019 & 2032
- Table 47: Global Arc Flash Protection Market Revenue Million Forecast, by End-User 2019 & 2032
- Table 48: Global Arc Flash Protection Market Revenue Million Forecast, by Country 2019 & 2032
- Table 49: United States of America Arc Flash Protection Market Revenue (Million) Forecast, by Application 2019 & 2032
- Table 50: Canada Arc Flash Protection Market Revenue (Million) Forecast, by Application 2019 & 2032
- Table 51: Rest of the North America Arc Flash Protection Market Revenue (Million) Forecast, by Application 2019 & 2032
- Table 52: Global Arc Flash Protection Market Revenue Million Forecast, by Equipment 2019 & 2032
- Table 53: Global Arc Flash Protection Market Revenue Million Forecast, by End-User 2019 & 2032
- Table 54: Global Arc Flash Protection Market Revenue Million Forecast, by Country 2019 & 2032
- Table 55: China Arc Flash Protection Market Revenue (Million) Forecast, by Application 2019 & 2032
- Table 56: India Arc Flash Protection Market Revenue (Million) Forecast, by Application 2019 & 2032
- Table 57: South Korea Arc Flash Protection Market Revenue (Million) Forecast, by Application 2019 & 2032
- Table 58: Rest of the Asia Pacific Arc Flash Protection Market Revenue (Million) Forecast, by Application 2019 & 2032
- Table 59: Global Arc Flash Protection Market Revenue Million Forecast, by Equipment 2019 & 2032
- Table 60: Global Arc Flash Protection Market Revenue Million Forecast, by End-User 2019 & 2032
- Table 61: Global Arc Flash Protection Market Revenue Million Forecast, by Country 2019 & 2032
- Table 62: United Kingdom Arc Flash Protection Market Revenue (Million) Forecast, by Application 2019 & 2032
- Table 63: Germany Arc Flash Protection Market Revenue (Million) Forecast, by Application 2019 & 2032
- Table 64: France Arc Flash Protection Market Revenue (Million) Forecast, by Application 2019 & 2032
- Table 65: Italy Arc Flash Protection Market Revenue (Million) Forecast, by Application 2019 & 2032
- Table 66: Rest of the Europe Arc Flash Protection Market Revenue (Million) Forecast, by Application 2019 & 2032
- Table 67: Global Arc Flash Protection Market Revenue Million Forecast, by Equipment 2019 & 2032
- Table 68: Global Arc Flash Protection Market Revenue Million Forecast, by End-User 2019 & 2032
- Table 69: Global Arc Flash Protection Market Revenue Million Forecast, by Country 2019 & 2032
- Table 70: Brazil Arc Flash Protection Market Revenue (Million) Forecast, by Application 2019 & 2032
- Table 71: Argentina Arc Flash Protection Market Revenue (Million) Forecast, by Application 2019 & 2032
- Table 72: Rest of the South America Arc Flash Protection Market Revenue (Million) Forecast, by Application 2019 & 2032
- Table 73: Global Arc Flash Protection Market Revenue Million Forecast, by Equipment 2019 & 2032
- Table 74: Global Arc Flash Protection Market Revenue Million Forecast, by End-User 2019 & 2032
- Table 75: Global Arc Flash Protection Market Revenue Million Forecast, by Country 2019 & 2032
- Table 76: United Arab Emirates Arc Flash Protection Market Revenue (Million) Forecast, by Application 2019 & 2032
- Table 77: Saudi Arabia Arc Flash Protection Market Revenue (Million) Forecast, by Application 2019 & 2032
- Table 78: Rest of the Middle East and Africa Arc Flash Protection Market Revenue (Million) Forecast, by Application 2019 & 2032
Frequently Asked Questions
1. What is the projected Compound Annual Growth Rate (CAGR) of the Arc Flash Protection Market?
The projected CAGR is approximately 4.18%.
2. Which companies are prominent players in the Arc Flash Protection Market?
Key companies in the market include Littlefuse Inc, ABB Ltd, Larsen & Toubro Limited, DuPont de Nemours Inc, Arcteq Relays Ltd, Siemens AG, Schneider Electric SE, NR Electric Co Ltd , Eaton Corporation Plc, General Electric Company.
3. What are the main segments of the Arc Flash Protection Market?
The market segments include Equipment, End-User.
4. Can you provide details about the market size?
The market size is estimated to be USD 3.25 Million as of 2022.
5. What are some drivers contributing to market growth?
4.; Presence of Fire Safety Regulations4.; Increasing Industrialization across the World.
6. What are the notable trends driving market growth?
Utility Sector to Witness Significant Growth.
7. Are there any restraints impacting market growth?
4.; High Product Prices and Maintenance Costs.
8. Can you provide examples of recent developments in the market?
April 2023: Pyramex launched its new GL3000 Series Arc Flash Protection gloves. The series includes two new glove options for comfort, fit, and agility. They are designed to provide premium protection for workers who may have an arc flash incident in their line of work.
9. What pricing options are available for accessing the report?
Pricing options include single-user, multi-user, and enterprise licenses priced at USD 4750, USD 5250, and USD 8750 respectively.
10. Is the market size provided in terms of value or volume?
The market size is provided in terms of value, measured in Million.
11. Are there any specific market keywords associated with the report?
Yes, the market keyword associated with the report is "Arc Flash Protection Market," which aids in identifying and referencing the specific market segment covered.
12. How do I determine which pricing option suits my needs best?
The pricing options vary based on user requirements and access needs. Individual users may opt for single-user licenses, while businesses requiring broader access may choose multi-user or enterprise licenses for cost-effective access to the report.
13. Are there any additional resources or data provided in the Arc Flash Protection Market report?
While the report offers comprehensive insights, it's advisable to review the specific contents or supplementary materials provided to ascertain if additional resources or data are available.
14. How can I stay updated on further developments or reports in the Arc Flash Protection Market?
To stay informed about further developments, trends, and reports in the Arc Flash Protection Market, consider subscribing to industry newsletters, following relevant companies and organizations, or regularly checking reputable industry news sources and publications.
Methodology
Step 1 - Identification of Relevant Samples Size from Population Database


Step 2 - Approaches for Defining Global Market Size (Value, Volume* & Price*)

Note*: In applicable scenarios
Step 3 - Data Sources
Primary Research
- Web Analytics
- Survey Reports
- Research Institute
- Latest Research Reports
- Opinion Leaders
Secondary Research
- Annual Reports
- White Paper
- Latest Press Release
- Industry Association
- Paid Database
- Investor Presentations

Step 4 - Data Triangulation
Involves using different sources of information in order to increase the validity of a study
These sources are likely to be stakeholders in a program - participants, other researchers, program staff, other community members, and so on.
Then we put all data in single framework & apply various statistical tools to find out the dynamic on the market.
During the analysis stage, feedback from the stakeholder groups would be compared to determine areas of agreement as well as areas of divergence


