
Key Insights
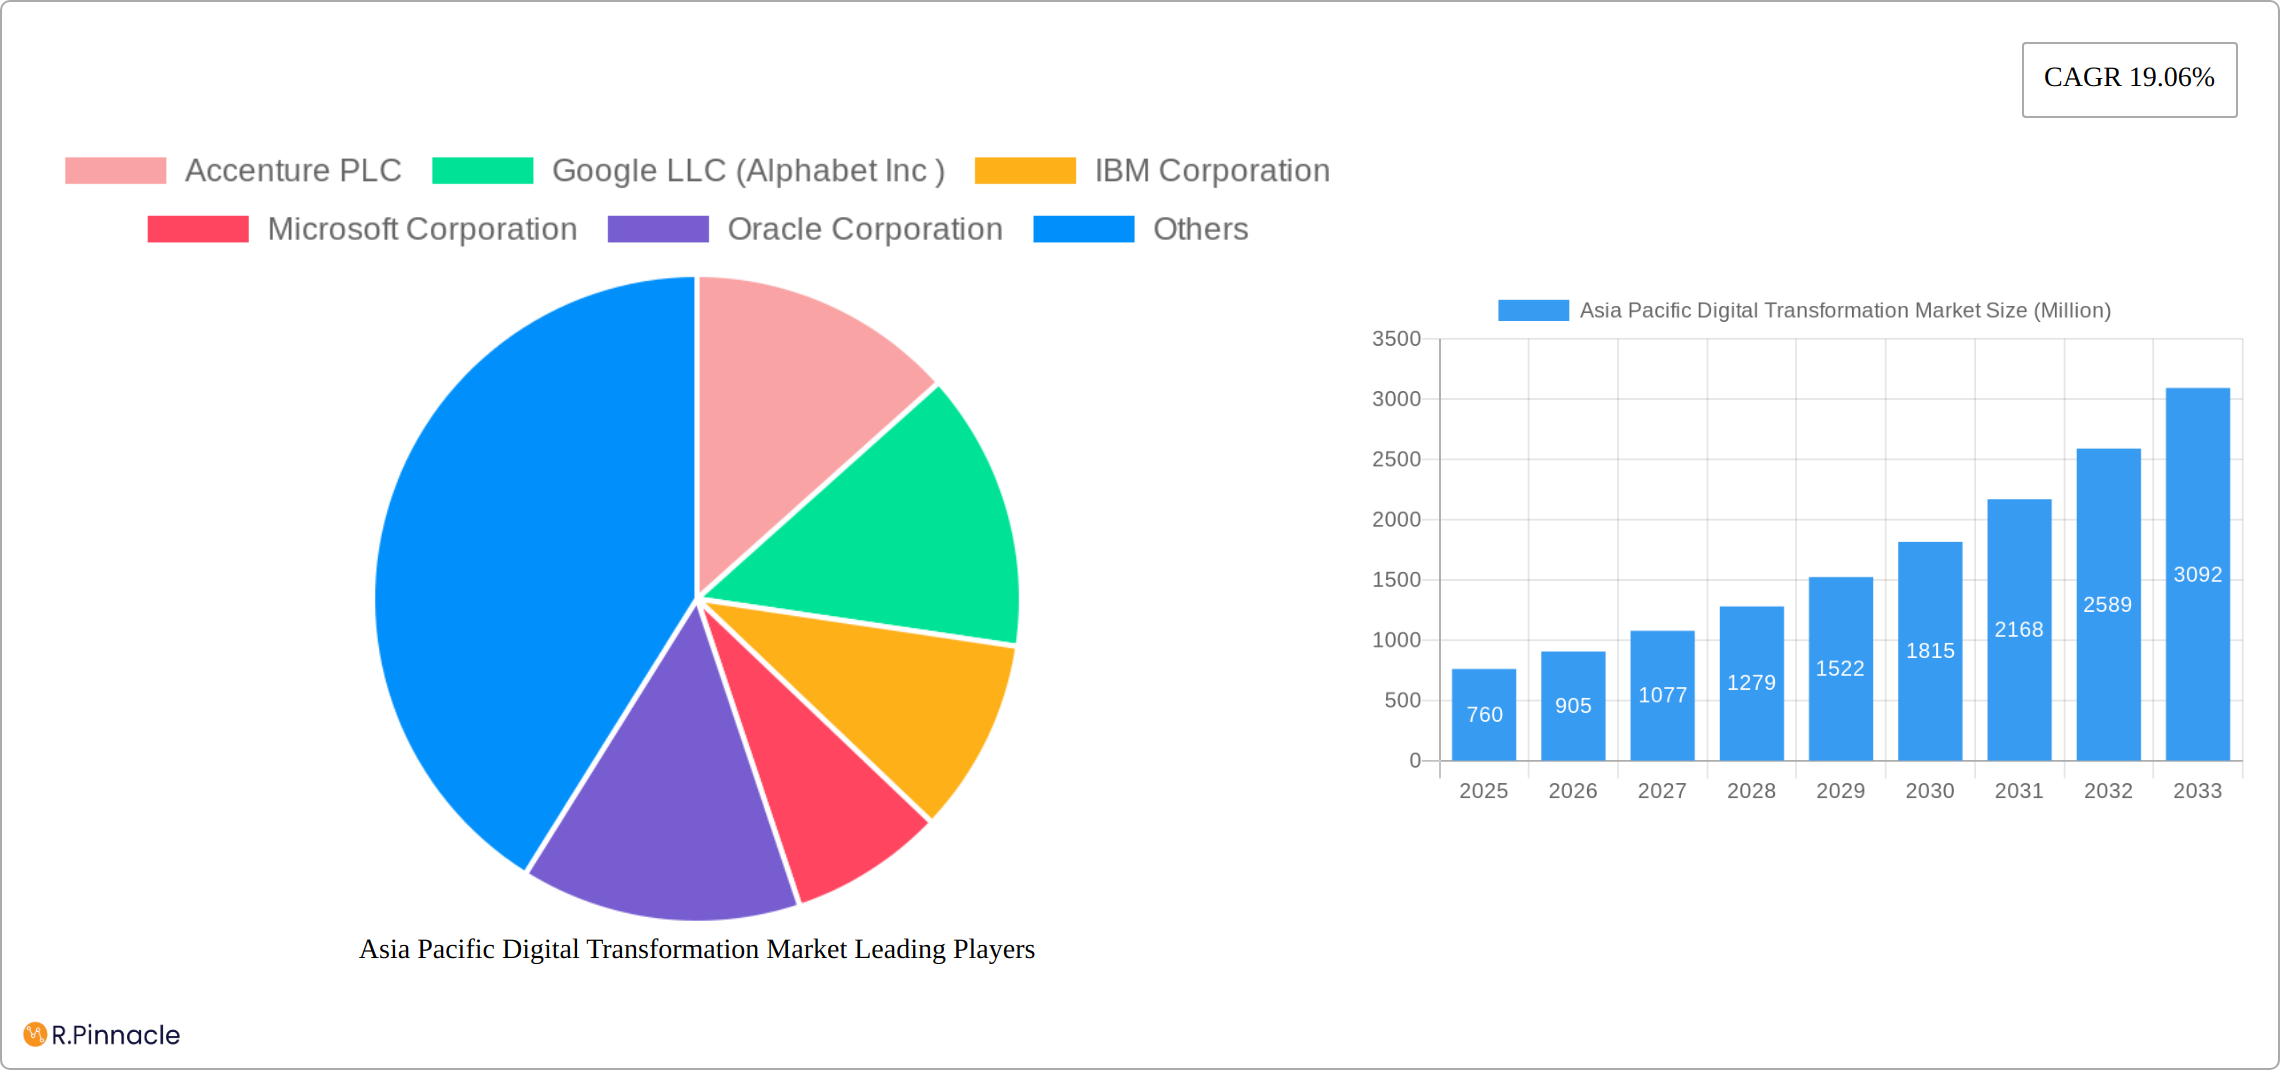
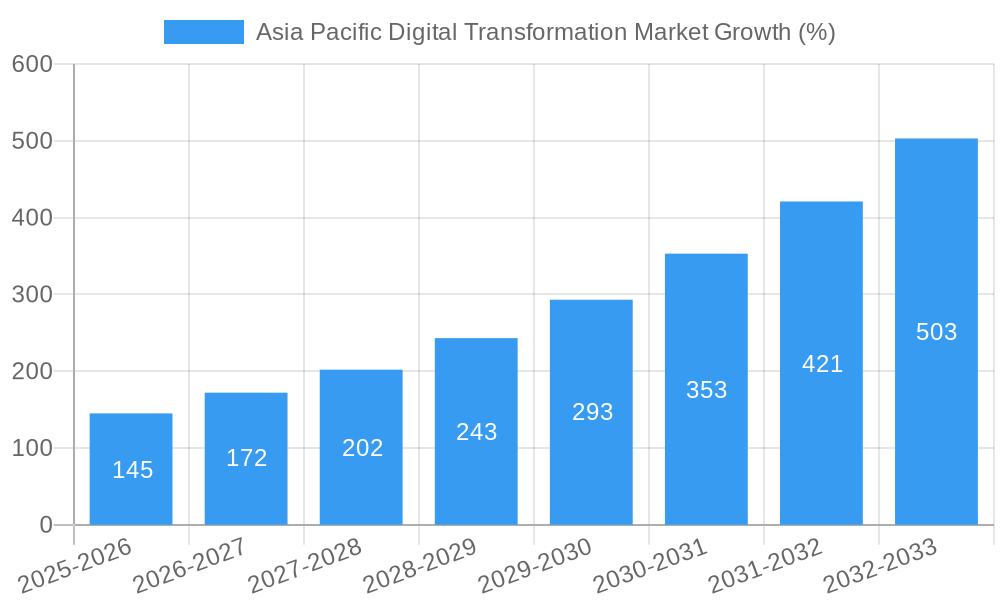
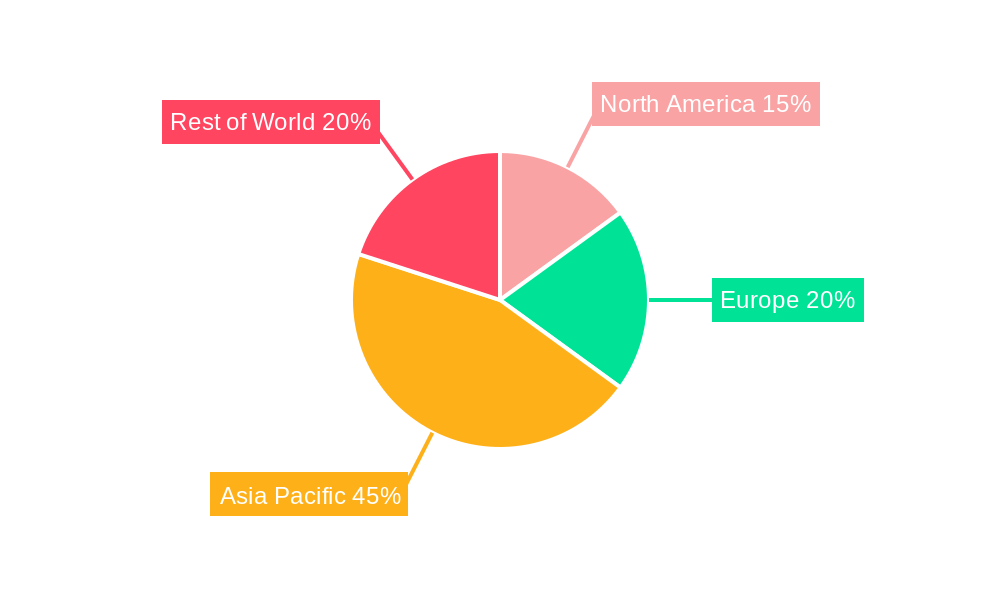
The Asia Pacific Digital Transformation market, currently valued at $0.76 billion (2025), is experiencing robust growth, projected to expand at a Compound Annual Growth Rate (CAGR) of 19.06% from 2025 to 2033. This surge is driven by several key factors. Firstly, increasing government initiatives across the region promoting digital infrastructure development and adoption are creating a fertile ground for digital transformation projects. Secondly, the rising adoption of cloud computing, artificial intelligence (AI), and the Internet of Things (IoT) across various sectors – from manufacturing and finance to healthcare and retail – is fueling demand for digital transformation solutions. Furthermore, the burgeoning startup ecosystem and the presence of major technology players like Accenture, Google, IBM, and Microsoft are further accelerating market expansion. The competitive landscape is characterized by both large multinational corporations offering comprehensive solutions and smaller niche players specializing in specific aspects of digital transformation. This creates a dynamic environment fostering innovation and competition, benefiting businesses across the Asia Pacific region.
However, challenges remain. The uneven digital infrastructure across different countries within the region presents a significant hurdle. Furthermore, concerns surrounding data security and privacy, along with a potential skills gap in managing and implementing digital transformation projects, could potentially slow down the market's progress. Despite these restraints, the overall outlook remains positive, driven by the region's growing digital economy and the increasing awareness among businesses of the necessity for digital transformation to remain competitive in the global market. The market is expected to see substantial growth across various segments, including cloud services, cybersecurity solutions, and data analytics. This growth will be concentrated in countries with strong economic growth and a focus on technological advancement, likely leading to regional disparities in market penetration.
Asia Pacific Digital Transformation Market Report: 2019-2033
This comprehensive report provides an in-depth analysis of the Asia Pacific Digital Transformation Market, offering valuable insights for industry professionals, investors, and strategic decision-makers. With a study period spanning 2019-2033, a base year of 2025, and a forecast period of 2025-2033, this report offers a complete picture of the market's evolution and future potential. The market is projected to reach xx Million by 2033, exhibiting a compelling CAGR of xx% during the forecast period.
Asia Pacific Digital Transformation Market Structure & Innovation Trends
This section analyzes the competitive landscape, innovation drivers, and regulatory influences shaping the Asia Pacific digital transformation market. We delve into market concentration, examining the market share held by key players like Accenture PLC, Google LLC (Alphabet Inc.), IBM Corporation, Microsoft Corporation, Oracle Corporation, Hewlett Packard Enterprise, SAP SE, Dell EMC (formerly EMC Corporation), Cognex Corporation, Adobe Inc., and Siemens AG. The report also explores M&A activity, quantifying deal values in Millions and their impact on market consolidation. Innovation drivers, including advancements in AI, cloud computing, and IoT, are assessed, alongside regulatory frameworks influencing market growth. The analysis further considers the impact of product substitutes and evolving end-user demographics on market dynamics.
- Market Concentration: The market exhibits a moderately concentrated structure, with the top 5 players holding approximately xx% of the market share in 2025.
- Innovation Drivers: Advancements in AI, cloud computing, and IoT are key drivers of innovation, fueling the adoption of digital transformation solutions.
- Regulatory Frameworks: Government initiatives promoting digitalization and data privacy regulations are shaping market development.
- M&A Activity: The report details significant M&A transactions, with an estimated total deal value of xx Million during the historical period (2019-2024).
Asia Pacific Digital Transformation Market Dynamics & Trends
This section examines the key factors driving market growth, technological disruptions, evolving consumer preferences, and intense competitive dynamics within the Asia Pacific Digital Transformation Market. The analysis encompasses detailed examination of market size, penetration rate, and CAGR, providing a granular understanding of market expansion across various segments. The influence of macroeconomic factors and evolving consumer behavior on market growth trajectories is also scrutinized.
Dominant Regions & Segments in Asia Pacific Digital Transformation Market
This section identifies the leading regions and segments within the Asia Pacific Digital Transformation Market. We provide a comprehensive dominance analysis for the leading region/country, detailing the key drivers responsible for its market leadership.
- Key Drivers (Leading Region/Country):
- Favorable economic policies promoting digitalization.
- Robust digital infrastructure development.
- High levels of technological adoption among businesses.
- Supportive government regulations.
Asia Pacific Digital Transformation Market Product Innovations
The Asia Pacific digital transformation market is witnessing a surge in innovative product development, driven by advancements in cloud computing, artificial intelligence (AI), the Internet of Things (IoT), and big data analytics. Recent innovations focus on enhancing operational efficiency, improving customer experiences, and fostering greater agility across diverse industries. Key areas of innovation include hyper-automation solutions streamlining complex processes, AI-powered predictive maintenance tools for minimizing downtime, and secure cloud platforms enabling seamless data sharing and collaboration. The market is also witnessing the rise of specialized solutions tailored to specific industry needs, such as AI-driven diagnostic tools in healthcare or intelligent supply chain management systems in manufacturing. Analysis of market fit reveals a strong demand for solutions addressing data security, scalability, and integration with existing legacy systems. The strategic implications of these product launches are significant, leading to increased competition, faster adoption cycles, and a greater focus on value-added services.
Report Scope & Segmentation Analysis
This report segments the Asia Pacific Digital Transformation Market across various parameters, providing detailed growth projections, market sizes, and competitive dynamics for each segment. (Specific segment details would be included here, but require more information to complete.)
Key Drivers of Asia Pacific Digital Transformation Market Growth
Robust growth in the Asia Pacific digital transformation market is fueled by a confluence of factors. The rapid expansion of cloud computing infrastructure provides scalable and cost-effective solutions for businesses of all sizes. The proliferation of big data analytics empowers organizations to extract valuable insights from massive datasets, driving better decision-making and improved operational efficiency. The increasing adoption of AI and machine learning is transforming various aspects of business operations, automating tasks, and improving accuracy. The demand for enhanced customer experiences is also a significant driver, pushing businesses to invest in digital tools that personalize interactions and optimize customer journeys. Government initiatives across the region, aimed at promoting digital infrastructure and fostering innovation, provide further impetus to this growth. Furthermore, the rising adoption of digital technologies across diverse sectors, from finance and healthcare to manufacturing and retail, contributes significantly to market expansion.
Challenges in the Asia Pacific Digital Transformation Market Sector
Despite significant growth opportunities, challenges remain. These include the complexity of implementing digital transformation projects, cybersecurity concerns, the lack of skilled professionals, and the high cost of implementation. These challenges impact the market's growth trajectory and necessitate strategic considerations for businesses.
Emerging Opportunities in Asia Pacific Digital Transformation Market
The Asia Pacific digital transformation market presents a wealth of emerging opportunities. The expanding digital economy, particularly in developing economies, presents substantial potential for growth, driven by rising smartphone penetration and increasing internet access. The burgeoning adoption of AI, IoT, and cloud technologies across various sectors, including manufacturing, healthcare, finance, and education, creates significant avenues for innovation and market expansion. Specific opportunities include the development of smart city solutions, the implementation of Industry 4.0 technologies in manufacturing, the adoption of telemedicine and personalized healthcare solutions, and the creation of more secure and efficient financial services platforms. Furthermore, the growing focus on sustainability and environmental concerns presents opportunities for the development of eco-friendly digital solutions.
Leading Players in the Asia Pacific Digital Transformation Market Market
- Accenture PLC
- Google LLC (Alphabet Inc.)
- IBM Corporation
- Microsoft Corporation
- Oracle Corporation
- Hewlett Packard Enterprise
- SAP SE
- Dell EMC (Dell Technologies) - website link not provided
- Cognex Corporation - website link not provided
- Adobe Inc
- Siemens AG - website link not provided
Key Developments in Asia Pacific Digital Transformation Market Industry
- June 2024: Honeywell and PwC India launched a joint initiative to accelerate digital transformation for businesses in industrial, building, and infrastructure sectors, focusing on enhancing reliability, strengthening cybersecurity measures, and optimizing energy efficiency. This collaboration combines Honeywell's expertise in industrial technologies with PwC's consulting and digital transformation capabilities.
- May 2024: Colt Technology Services partnered with Infosys for a five-year collaboration to deliver integrated digital transformation solutions. This strategic partnership leverages Colt's robust network infrastructure and Infosys' extensive consulting expertise to provide comprehensive and tailored solutions to enterprises across the region. The collaboration focuses on delivering seamless digital experiences, enhancing operational efficiency, and driving business growth.
- [Add another recent development here with date and brief description]
Future Outlook for Asia Pacific Digital Transformation Market Market
The Asia Pacific Digital Transformation Market is poised for sustained growth, driven by increasing government support, technological advancements, and rising digital adoption across diverse industries. Strategic partnerships, investments in R&D, and a focus on customer experience will be crucial for success in this dynamic market.
Asia Pacific Digital Transformation Market Segmentation
- 1. Production Analysis
- 2. Consumption Analysis
- 3. Import Market Analysis (Value & Volume)
- 4. Export Market Analysis (Value & Volume)
- 5. Price Trend Analysis
Asia Pacific Digital Transformation Market Segmentation By Geography
-
1. Asia Pacific
- 1.1. China
- 1.2. Japan
- 1.3. South Korea
- 1.4. India
- 1.5. Australia
- 1.6. New Zealand
- 1.7. Indonesia
- 1.8. Malaysia
- 1.9. Singapore
- 1.10. Thailand
- 1.11. Vietnam
- 1.12. Philippines
Asia Pacific Digital Transformation Market REPORT HIGHLIGHTS
| Aspects | Details |
|---|---|
| Study Period | 2019-2033 |
| Base Year | 2024 |
| Estimated Year | 2025 |
| Forecast Period | 2025-2033 |
| Historical Period | 2019-2024 |
| Growth Rate | CAGR of 19.06% from 2019-2033 |
| Segmentation |
|
Table of Contents
- 1. Introduction
- 1.1. Research Scope
- 1.2. Market Segmentation
- 1.3. Research Methodology
- 1.4. Definitions and Assumptions
- 2. Executive Summary
- 2.1. Introduction
- 3. Market Dynamics
- 3.1. Introduction
- 3.2. Market Drivers
- 3.3. Market Restrains
- 3.4. Market Trends
- 3.4.1. The IoT Segment is Expected to Occupy the Largest Market Share
- 4. Market Factor Analysis
- 4.1. Porters Five Forces
- 4.2. Supply/Value Chain
- 4.3. PESTEL analysis
- 4.4. Market Entropy
- 4.5. Patent/Trademark Analysis
- 5. Asia Pacific Digital Transformation Market Analysis, Insights and Forecast, 2019-2031
- 5.1. Market Analysis, Insights and Forecast - by Production Analysis
- 5.2. Market Analysis, Insights and Forecast - by Consumption Analysis
- 5.3. Market Analysis, Insights and Forecast - by Import Market Analysis (Value & Volume)
- 5.4. Market Analysis, Insights and Forecast - by Export Market Analysis (Value & Volume)
- 5.5. Market Analysis, Insights and Forecast - by Price Trend Analysis
- 5.6. Market Analysis, Insights and Forecast - by Region
- 5.6.1. Asia Pacific
- 5.1. Market Analysis, Insights and Forecast - by Production Analysis
- 6. Competitive Analysis
- 6.1. Market Share Analysis 2024
- 6.2. Company Profiles
- 6.2.1 Accenture PLC
- 6.2.1.1. Overview
- 6.2.1.2. Products
- 6.2.1.3. SWOT Analysis
- 6.2.1.4. Recent Developments
- 6.2.1.5. Financials (Based on Availability)
- 6.2.2 Google LLC (Alphabet Inc )
- 6.2.2.1. Overview
- 6.2.2.2. Products
- 6.2.2.3. SWOT Analysis
- 6.2.2.4. Recent Developments
- 6.2.2.5. Financials (Based on Availability)
- 6.2.3 IBM Corporation
- 6.2.3.1. Overview
- 6.2.3.2. Products
- 6.2.3.3. SWOT Analysis
- 6.2.3.4. Recent Developments
- 6.2.3.5. Financials (Based on Availability)
- 6.2.4 Microsoft Corporation
- 6.2.4.1. Overview
- 6.2.4.2. Products
- 6.2.4.3. SWOT Analysis
- 6.2.4.4. Recent Developments
- 6.2.4.5. Financials (Based on Availability)
- 6.2.5 Oracle Corporation
- 6.2.5.1. Overview
- 6.2.5.2. Products
- 6.2.5.3. SWOT Analysis
- 6.2.5.4. Recent Developments
- 6.2.5.5. Financials (Based on Availability)
- 6.2.6 Hewlett Packard Enterprise
- 6.2.6.1. Overview
- 6.2.6.2. Products
- 6.2.6.3. SWOT Analysis
- 6.2.6.4. Recent Developments
- 6.2.6.5. Financials (Based on Availability)
- 6.2.7 SAP SE
- 6.2.7.1. Overview
- 6.2.7.2. Products
- 6.2.7.3. SWOT Analysis
- 6.2.7.4. Recent Developments
- 6.2.7.5. Financials (Based on Availability)
- 6.2.8 EMC Corporation (Dell EMC)
- 6.2.8.1. Overview
- 6.2.8.2. Products
- 6.2.8.3. SWOT Analysis
- 6.2.8.4. Recent Developments
- 6.2.8.5. Financials (Based on Availability)
- 6.2.9 Cognex Corporation
- 6.2.9.1. Overview
- 6.2.9.2. Products
- 6.2.9.3. SWOT Analysis
- 6.2.9.4. Recent Developments
- 6.2.9.5. Financials (Based on Availability)
- 6.2.10 Adobe Inc
- 6.2.10.1. Overview
- 6.2.10.2. Products
- 6.2.10.3. SWOT Analysis
- 6.2.10.4. Recent Developments
- 6.2.10.5. Financials (Based on Availability)
- 6.2.11 Siemens A
- 6.2.11.1. Overview
- 6.2.11.2. Products
- 6.2.11.3. SWOT Analysis
- 6.2.11.4. Recent Developments
- 6.2.11.5. Financials (Based on Availability)
- 6.2.1 Accenture PLC
List of Figures
- Figure 1: Asia Pacific Digital Transformation Market Revenue Breakdown (Million, %) by Product 2024 & 2032
- Figure 2: Asia Pacific Digital Transformation Market Share (%) by Company 2024
List of Tables
- Table 1: Asia Pacific Digital Transformation Market Revenue Million Forecast, by Region 2019 & 2032
- Table 2: Asia Pacific Digital Transformation Market Volume Trillion Forecast, by Region 2019 & 2032
- Table 3: Asia Pacific Digital Transformation Market Revenue Million Forecast, by Production Analysis 2019 & 2032
- Table 4: Asia Pacific Digital Transformation Market Volume Trillion Forecast, by Production Analysis 2019 & 2032
- Table 5: Asia Pacific Digital Transformation Market Revenue Million Forecast, by Consumption Analysis 2019 & 2032
- Table 6: Asia Pacific Digital Transformation Market Volume Trillion Forecast, by Consumption Analysis 2019 & 2032
- Table 7: Asia Pacific Digital Transformation Market Revenue Million Forecast, by Import Market Analysis (Value & Volume) 2019 & 2032
- Table 8: Asia Pacific Digital Transformation Market Volume Trillion Forecast, by Import Market Analysis (Value & Volume) 2019 & 2032
- Table 9: Asia Pacific Digital Transformation Market Revenue Million Forecast, by Export Market Analysis (Value & Volume) 2019 & 2032
- Table 10: Asia Pacific Digital Transformation Market Volume Trillion Forecast, by Export Market Analysis (Value & Volume) 2019 & 2032
- Table 11: Asia Pacific Digital Transformation Market Revenue Million Forecast, by Price Trend Analysis 2019 & 2032
- Table 12: Asia Pacific Digital Transformation Market Volume Trillion Forecast, by Price Trend Analysis 2019 & 2032
- Table 13: Asia Pacific Digital Transformation Market Revenue Million Forecast, by Region 2019 & 2032
- Table 14: Asia Pacific Digital Transformation Market Volume Trillion Forecast, by Region 2019 & 2032
- Table 15: Asia Pacific Digital Transformation Market Revenue Million Forecast, by Production Analysis 2019 & 2032
- Table 16: Asia Pacific Digital Transformation Market Volume Trillion Forecast, by Production Analysis 2019 & 2032
- Table 17: Asia Pacific Digital Transformation Market Revenue Million Forecast, by Consumption Analysis 2019 & 2032
- Table 18: Asia Pacific Digital Transformation Market Volume Trillion Forecast, by Consumption Analysis 2019 & 2032
- Table 19: Asia Pacific Digital Transformation Market Revenue Million Forecast, by Import Market Analysis (Value & Volume) 2019 & 2032
- Table 20: Asia Pacific Digital Transformation Market Volume Trillion Forecast, by Import Market Analysis (Value & Volume) 2019 & 2032
- Table 21: Asia Pacific Digital Transformation Market Revenue Million Forecast, by Export Market Analysis (Value & Volume) 2019 & 2032
- Table 22: Asia Pacific Digital Transformation Market Volume Trillion Forecast, by Export Market Analysis (Value & Volume) 2019 & 2032
- Table 23: Asia Pacific Digital Transformation Market Revenue Million Forecast, by Price Trend Analysis 2019 & 2032
- Table 24: Asia Pacific Digital Transformation Market Volume Trillion Forecast, by Price Trend Analysis 2019 & 2032
- Table 25: Asia Pacific Digital Transformation Market Revenue Million Forecast, by Country 2019 & 2032
- Table 26: Asia Pacific Digital Transformation Market Volume Trillion Forecast, by Country 2019 & 2032
- Table 27: China Asia Pacific Digital Transformation Market Revenue (Million) Forecast, by Application 2019 & 2032
- Table 28: China Asia Pacific Digital Transformation Market Volume (Trillion) Forecast, by Application 2019 & 2032
- Table 29: Japan Asia Pacific Digital Transformation Market Revenue (Million) Forecast, by Application 2019 & 2032
- Table 30: Japan Asia Pacific Digital Transformation Market Volume (Trillion) Forecast, by Application 2019 & 2032
- Table 31: South Korea Asia Pacific Digital Transformation Market Revenue (Million) Forecast, by Application 2019 & 2032
- Table 32: South Korea Asia Pacific Digital Transformation Market Volume (Trillion) Forecast, by Application 2019 & 2032
- Table 33: India Asia Pacific Digital Transformation Market Revenue (Million) Forecast, by Application 2019 & 2032
- Table 34: India Asia Pacific Digital Transformation Market Volume (Trillion) Forecast, by Application 2019 & 2032
- Table 35: Australia Asia Pacific Digital Transformation Market Revenue (Million) Forecast, by Application 2019 & 2032
- Table 36: Australia Asia Pacific Digital Transformation Market Volume (Trillion) Forecast, by Application 2019 & 2032
- Table 37: New Zealand Asia Pacific Digital Transformation Market Revenue (Million) Forecast, by Application 2019 & 2032
- Table 38: New Zealand Asia Pacific Digital Transformation Market Volume (Trillion) Forecast, by Application 2019 & 2032
- Table 39: Indonesia Asia Pacific Digital Transformation Market Revenue (Million) Forecast, by Application 2019 & 2032
- Table 40: Indonesia Asia Pacific Digital Transformation Market Volume (Trillion) Forecast, by Application 2019 & 2032
- Table 41: Malaysia Asia Pacific Digital Transformation Market Revenue (Million) Forecast, by Application 2019 & 2032
- Table 42: Malaysia Asia Pacific Digital Transformation Market Volume (Trillion) Forecast, by Application 2019 & 2032
- Table 43: Singapore Asia Pacific Digital Transformation Market Revenue (Million) Forecast, by Application 2019 & 2032
- Table 44: Singapore Asia Pacific Digital Transformation Market Volume (Trillion) Forecast, by Application 2019 & 2032
- Table 45: Thailand Asia Pacific Digital Transformation Market Revenue (Million) Forecast, by Application 2019 & 2032
- Table 46: Thailand Asia Pacific Digital Transformation Market Volume (Trillion) Forecast, by Application 2019 & 2032
- Table 47: Vietnam Asia Pacific Digital Transformation Market Revenue (Million) Forecast, by Application 2019 & 2032
- Table 48: Vietnam Asia Pacific Digital Transformation Market Volume (Trillion) Forecast, by Application 2019 & 2032
- Table 49: Philippines Asia Pacific Digital Transformation Market Revenue (Million) Forecast, by Application 2019 & 2032
- Table 50: Philippines Asia Pacific Digital Transformation Market Volume (Trillion) Forecast, by Application 2019 & 2032
Frequently Asked Questions
1. What is the projected Compound Annual Growth Rate (CAGR) of the Asia Pacific Digital Transformation Market?
The projected CAGR is approximately 19.06%.
2. Which companies are prominent players in the Asia Pacific Digital Transformation Market?
Key companies in the market include Accenture PLC, Google LLC (Alphabet Inc ), IBM Corporation, Microsoft Corporation, Oracle Corporation, Hewlett Packard Enterprise, SAP SE, EMC Corporation (Dell EMC), Cognex Corporation, Adobe Inc, Siemens A.
3. What are the main segments of the Asia Pacific Digital Transformation Market?
The market segments include Production Analysis, Consumption Analysis, Import Market Analysis (Value & Volume), Export Market Analysis (Value & Volume), Price Trend Analysis.
4. Can you provide details about the market size?
The market size is estimated to be USD 0.76 Million as of 2022.
5. What are some drivers contributing to market growth?
N/A
6. What are the notable trends driving market growth?
The IoT Segment is Expected to Occupy the Largest Market Share.
7. Are there any restraints impacting market growth?
N/A
8. Can you provide examples of recent developments in the market?
June 2024: Honeywell and PwC India unveiled a joint initiative with a strategic goal to expedite digital transformations for businesses, equipping them to navigate future challenges. This partnership harnesses PwC India's consulting prowess alongside Honeywell's state-of-the-art operational technology (OT) software. The primary aim is to bolster reliability, cybersecurity, and energy efficiency. Their efforts are honed in on the industrial, buildings, and infrastructure domains, emphasizing enterprise-wide digitalization.
9. What pricing options are available for accessing the report?
Pricing options include single-user, multi-user, and enterprise licenses priced at USD 4750, USD 4950, and USD 6800 respectively.
10. Is the market size provided in terms of value or volume?
The market size is provided in terms of value, measured in Million and volume, measured in Trillion.
11. Are there any specific market keywords associated with the report?
Yes, the market keyword associated with the report is "Asia Pacific Digital Transformation Market," which aids in identifying and referencing the specific market segment covered.
12. How do I determine which pricing option suits my needs best?
The pricing options vary based on user requirements and access needs. Individual users may opt for single-user licenses, while businesses requiring broader access may choose multi-user or enterprise licenses for cost-effective access to the report.
13. Are there any additional resources or data provided in the Asia Pacific Digital Transformation Market report?
While the report offers comprehensive insights, it's advisable to review the specific contents or supplementary materials provided to ascertain if additional resources or data are available.
14. How can I stay updated on further developments or reports in the Asia Pacific Digital Transformation Market?
To stay informed about further developments, trends, and reports in the Asia Pacific Digital Transformation Market, consider subscribing to industry newsletters, following relevant companies and organizations, or regularly checking reputable industry news sources and publications.
Methodology
Step 1 - Identification of Relevant Samples Size from Population Database


Step 2 - Approaches for Defining Global Market Size (Value, Volume* & Price*)

Note*: In applicable scenarios
Step 3 - Data Sources
Primary Research
- Web Analytics
- Survey Reports
- Research Institute
- Latest Research Reports
- Opinion Leaders
Secondary Research
- Annual Reports
- White Paper
- Latest Press Release
- Industry Association
- Paid Database
- Investor Presentations

Step 4 - Data Triangulation
Involves using different sources of information in order to increase the validity of a study
These sources are likely to be stakeholders in a program - participants, other researchers, program staff, other community members, and so on.
Then we put all data in single framework & apply various statistical tools to find out the dynamic on the market.
During the analysis stage, feedback from the stakeholder groups would be compared to determine areas of agreement as well as areas of divergence


