
Key Insights
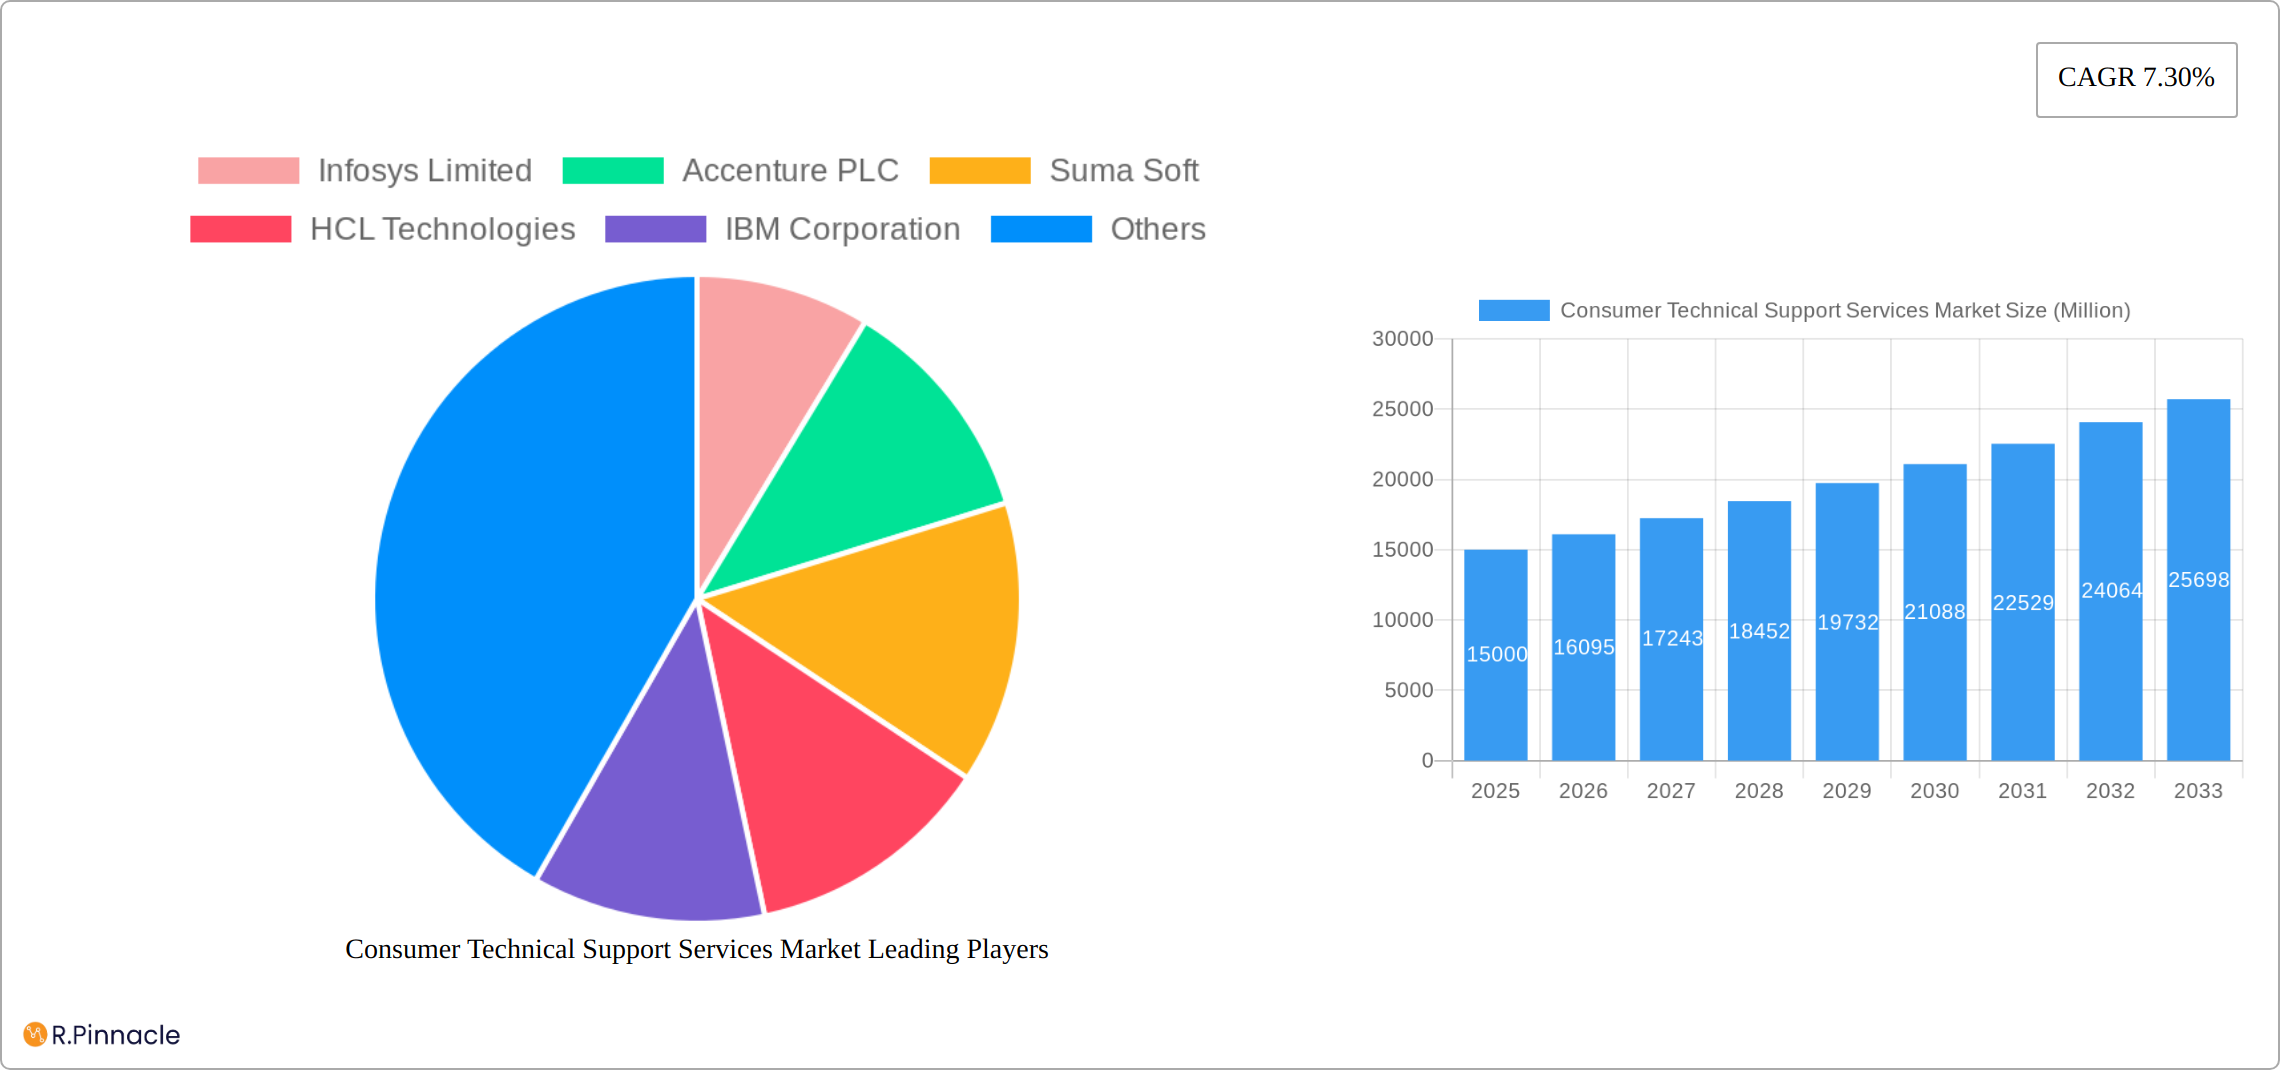
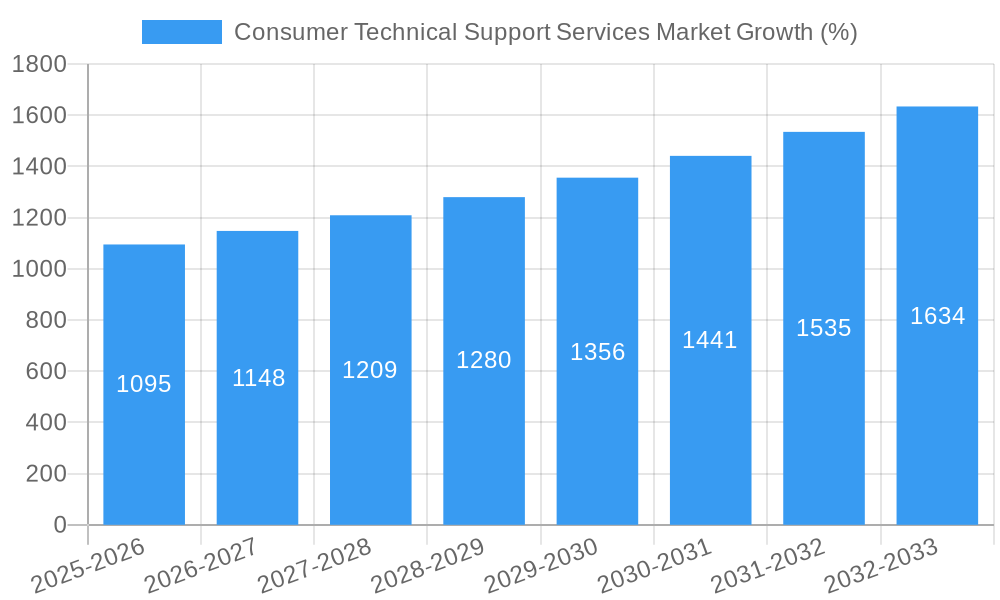
The Consumer Technical Support Services market is experiencing robust growth, projected to reach a significant market size by 2033. A 7.30% CAGR from 2019 to 2024 suggests a consistently expanding market fueled by several key drivers. The increasing reliance on technology across various sectors, including IT & Telecommunications, BFSI (Banking, Financial Services, and Insurance), Education, Manufacturing, and Automotive, is a primary driver. The surge in e-commerce and the expanding adoption of smart devices and connected home technologies further fuels the demand for efficient and readily available consumer technical support. While data privacy concerns and the need for highly skilled support personnel represent potential restraints, the market's growth trajectory remains positive. Segmentation reveals a strong presence across North America and Europe, but the Asia-Pacific region is poised for rapid expansion given its burgeoning tech-savvy population and increasing penetration of digital services. Key players like Infosys, Accenture, and HCL Technologies are leveraging their expertise in providing comprehensive solutions, including help desk and call center support, catering to diverse customer needs. The market exhibits strong potential for growth due to continued technological advancements and evolving consumer expectations for seamless technical assistance.
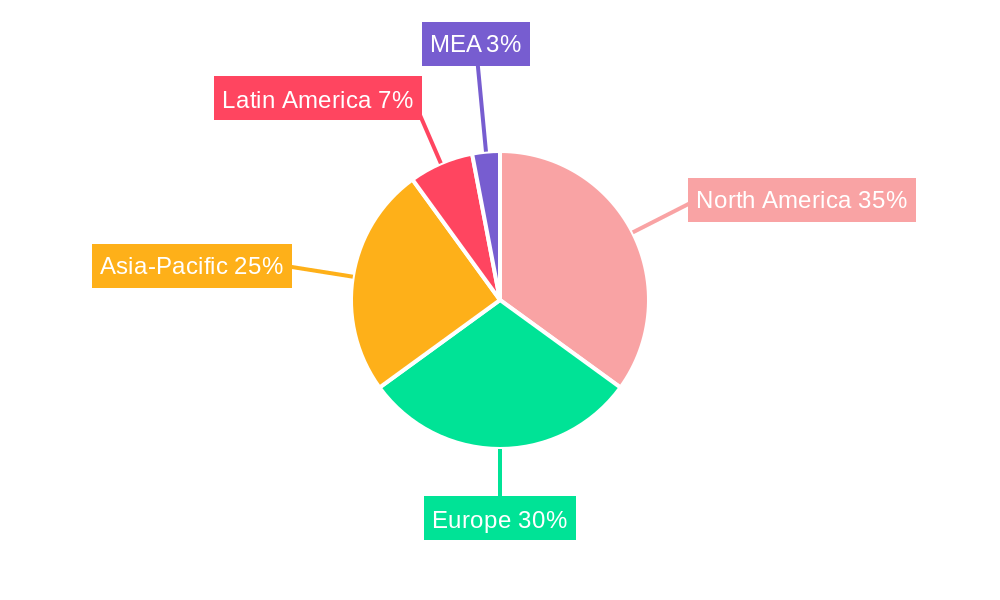
The market's segmentation by end-user highlights the diverse applications of consumer technical support services. The IT and Telecommunications sector consistently leads the demand, followed by BFSI, reflecting the critical nature of IT support for maintaining business continuity and customer satisfaction. The Education sector’s growing reliance on technology for teaching and learning also drives substantial demand. The manufacturing and automotive sectors, with their increasing adoption of automation and interconnected systems, further contribute to market growth. Emerging sectors like e-commerce and hospitality are also experiencing increasing demand for robust consumer technical support, suggesting continued expansion across various industries. Geographic segmentation indicates substantial market presence in North America and Europe, primarily driven by higher technological penetration and higher disposable incomes. However, the Asia-Pacific region presents significant growth potential, owing to its large population and rapidly expanding digital economy.
Consumer Technical Support Services Market: A Comprehensive Report (2019-2033)
This in-depth report provides a comprehensive analysis of the Consumer Technical Support Services Market, covering market structure, dynamics, dominant regions, product innovations, and future outlook. The study period spans from 2019 to 2033, with 2025 serving as the base and estimated year. The forecast period is 2025-2033, and the historical period covers 2019-2024. Key players analyzed include Infosys Limited, Accenture PLC, Suma Soft, HCL Technologies, IBM Corporation, Flatworld Solutions Pvt Ltd, Qcom Outsourcing Ltd, Collabera Inc, Genpact, Aegis Plc (Essar), Worldwide Call Centers Inc, Tata Consultancy Services Limited, and Wipro Limited.
Consumer Technical Support Services Market Structure & Innovation Trends
This section analyzes the market's competitive landscape, innovation drivers, and regulatory influences. The market exhibits a moderately consolidated structure, with the top five players holding an estimated xx% market share in 2025. M&A activity has been significant, with deal values exceeding $xx Million in the past five years. Innovation is driven primarily by advancements in AI, automation, and cloud computing, enabling more efficient and personalized support services. Regulatory frameworks vary by region, impacting data privacy and security compliance. Product substitutes, such as self-service portals and online knowledge bases, are increasingly prevalent. End-user demographics are shifting towards a greater reliance on digital channels for support, with younger generations exhibiting higher digital proficiency.
- Market Concentration: Top 5 players hold xx% market share (2025).
- M&A Activity: Deal values exceeding $xx Million (2020-2024).
- Innovation Drivers: AI, automation, cloud computing.
- Regulatory Landscape: Varies significantly by region.
- Product Substitutes: Self-service portals, online knowledge bases.
Consumer Technical Support Services Market Dynamics & Trends
The Consumer Technical Support Services Market is experiencing robust growth, with a projected CAGR of xx% during the forecast period (2025-2033). This growth is fueled by several factors. Increasing digital adoption across various industries and regions necessitates robust technical support infrastructure. Consumer preference for seamless omnichannel support experiences, encompassing phone, email, chat, and social media channels, is driving innovation and investment in advanced support solutions. Technological disruptions, such as the rise of AI-powered chatbots and remote diagnostics, are enhancing support efficiency and effectiveness. However, fierce competitive dynamics, with established players and new entrants vying for market share, present a challenge. Market penetration of advanced support technologies, such as AI-driven solutions, remains relatively low, offering significant growth potential.
Dominant Regions & Segments in Consumer Technical Support Services Market
North America currently holds the largest market share, driven by high technology adoption and robust digital infrastructure. However, the Asia-Pacific region is projected to exhibit the fastest growth rate during the forecast period, fueled by rapid economic expansion and increasing smartphone penetration.
- By Type: The Call Centre segment currently dominates, but the Help Desk segment is projected to grow faster due to the increasing demand for self-service options and remote assistance.
- By End-User: The IT and Telecommunication sector leads in market share, followed by BFSI, due to their high reliance on technology and sophisticated support needs. The other segments (Manufacturing, Automotive, Education, and Others) are also experiencing significant growth fueled by increasing digitization.
Key Drivers:
- North America: Strong digital infrastructure, high tech adoption.
- Asia-Pacific: Rapid economic growth, increasing smartphone penetration.
- Europe: Stringent data privacy regulations drive innovation in secure support solutions.
Consumer Technical Support Services Market Product Innovations
The Consumer Technical Support Services market is undergoing a significant transformation driven by cutting-edge product innovations designed to elevate customer experience and operational efficiency. Leading the charge are sophisticated AI-powered chatbots capable of handling a vast array of common queries, offering instant resolutions 24/7. Complementing this are robust self-service portals that empower users with comprehensive knowledge bases, troubleshooting guides, and intuitive diagnostic tools. Furthermore, the integration of remote diagnostics tools allows support professionals to securely access and fix issues on customer devices without physical intervention, drastically reducing resolution times and on-site visit costs. These advancements not only provide a significant competitive edge by optimizing operational expenditures but also demonstrably boost customer satisfaction through faster, more convenient, and personalized support. The market is increasingly gravitating towards holistic, integrated support platforms that unify diverse communication channels (phone, email, chat, social media) and leverage advanced technologies to deliver a seamless and context-aware experience for end-users.
Report Scope & Segmentation Analysis
This comprehensive report meticulously segments the Consumer Technical Support Services Market to provide granular insights into its diverse landscape. The segmentation is categorized by service type, encompassing Help Desk and Call Centre solutions, and by end-user industries, including IT & Telecommunication, Banking, Financial Services, and Insurance (BFSI), Education, Manufacturing, Automotive, and a broad 'Other' category. Geographically, the analysis spans key regions: North America, Europe, Asia-Pacific, Latin America, and the Middle East & Africa. Each segment's growth trajectories, projected market sizes, and intricate competitive dynamics are thoroughly examined. The analysis indicates robust growth projections, with the Asia-Pacific region anticipated to exhibit the most rapid expansion. Within service types, Help Desk solutions are expected to outpace others, while the IT & Telecommunication sector is projected to be a primary driver of demand. Competitive landscapes vary significantly across these segments, characterized by varying degrees of market consolidation, the strategic presence of large-scale providers, and the agile emergence of specialized niche players.
Key Drivers of Consumer Technical Support Services Market Growth
The market's growth is propelled by several factors: the rising adoption of cloud-based technologies, increasing reliance on digital services across industries, growing demand for personalized customer support, and advancements in AI and automation. Government initiatives promoting digitalization and robust internet infrastructure further fuel market expansion. Additionally, the increasing demand for omnichannel support solutions enhances customer satisfaction and loyalty.
Challenges in the Consumer Technical Support Services Market Sector
Navigating the Consumer Technical Support Services Market presents a multifaceted array of challenges that demand strategic foresight and adaptive solutions. Paramount among these is the imperative to uphold stringent data security and privacy standards in an increasingly interconnected digital ecosystem, where the risk of breaches is a constant concern. Simultaneously, the market grapples with the escalating expectations of consumers for immediate, efficient, and personalized support, often demanding resolutions in real-time. Complying with the intricate and ever-evolving landscape of regulatory requirements across diverse geographical jurisdictions adds another layer of complexity. The competitive arena is intensely crowded, with both established giants and agile new entrants vying for market share, thereby intensifying pressure on pricing models and profit margins. Furthermore, disruptions within global supply chains, particularly affecting the availability of essential hardware and software components, can significantly impede service delivery capabilities. Lastly, the substantial investment required for the continuous training and retention of highly skilled technical professionals remains a persistent and resource-intensive challenge for organizations operating in this sector.
Emerging Opportunities in Consumer Technical Support Services Market
The integration of AI, machine learning, and augmented reality in customer support offers significant opportunities. Expansion into underserved markets, especially in developing economies, presents significant potential. The growing demand for multilingual support in a globalized world opens new avenues for growth. The focus on personalized and proactive support, anticipating customer needs, creates opportunities to enhance customer loyalty and satisfaction.
Leading Players in the Consumer Technical Support Services Market Market
- Infosys Limited (Infosys)
- Accenture PLC (Accenture)
- Suma Soft
- HCL Technologies (HCL Technologies)
- IBM Corporation (IBM)
- Flatworld Solutions Pvt Ltd
- Qcom Outsourcing Ltd
- Collabera Inc
- Genpact (Genpact)
- Aegis Plc (Essar)
- Worldwide Call Centers Inc
- Tata Consultancy Services Limited (TCS)
- Wipro Limited (Wipro)
Key Developments in Consumer Technical Support Services Market Industry
- November 2022: In a strategic move to bolster their AI and automation capabilities, Infosys BPM and IBM inaugurated a state-of-the-art AI and automation center in Poland. This significant investment underscores the growing industry emphasis on advanced digital support solutions to enhance efficiency and customer engagement.
- September 2022: Tata Consultancy Services (TCS) announced the extension of its long-standing collaboration with Zurich Insurance. This renewed partnership highlights the increasing and sustained demand for comprehensive and robust IT support services within the critical BFSI sector, reflecting the trust placed in experienced providers to manage complex IT environments.
Future Outlook for Consumer Technical Support Services Market Market
The Consumer Technical Support Services Market is poised for continued growth, driven by technological advancements, expanding digital adoption, and increasing consumer expectations. Strategic partnerships, investments in AI and automation, and expansion into new markets will be key to success for companies in this sector. The market's potential lies in developing proactive, personalized, and omnichannel support solutions that deliver seamless customer experiences.
Consumer Technical Support Services Market Segmentation
-
1. Type
- 1.1. Help Desk
- 1.2. Call Centre
-
2. End-User
- 2.1. IT and Telecommunication
- 2.2. BFSI
- 2.3. Education
- 2.4. Manufacturing
- 2.5. Automotive
- 2.6. Other
Consumer Technical Support Services Market Segmentation By Geography
-
1. North America
- 1.1. United States
- 1.2. Canada
- 1.3. Mexico
-
2. South America
- 2.1. Brazil
- 2.2. Argentina
- 2.3. Rest of South America
-
3. Europe
- 3.1. United Kingdom
- 3.2. Germany
- 3.3. France
- 3.4. Italy
- 3.5. Spain
- 3.6. Russia
- 3.7. Benelux
- 3.8. Nordics
- 3.9. Rest of Europe
-
4. Middle East & Africa
- 4.1. Turkey
- 4.2. Israel
- 4.3. GCC
- 4.4. North Africa
- 4.5. South Africa
- 4.6. Rest of Middle East & Africa
-
5. Asia Pacific
- 5.1. China
- 5.2. India
- 5.3. Japan
- 5.4. South Korea
- 5.5. ASEAN
- 5.6. Oceania
- 5.7. Rest of Asia Pacific
Consumer Technical Support Services Market REPORT HIGHLIGHTS
| Aspects | Details |
|---|---|
| Study Period | 2019-2033 |
| Base Year | 2024 |
| Estimated Year | 2025 |
| Forecast Period | 2025-2033 |
| Historical Period | 2019-2024 |
| Growth Rate | CAGR of 7.30% from 2019-2033 |
| Segmentation |
|
Table of Contents
- 1. Introduction
- 1.1. Research Scope
- 1.2. Market Segmentation
- 1.3. Research Methodology
- 1.4. Definitions and Assumptions
- 2. Executive Summary
- 2.1. Introduction
- 3. Market Dynamics
- 3.1. Introduction
- 3.2. Market Drivers
- 3.2.1. Increase in Automation in the Industry; Digital Transformation and Industry 4.0 Practices
- 3.3. Market Restrains
- 3.3.1. High Initial Costs and Low ROI; Design and Upgradation of Platforms
- 3.4. Market Trends
- 3.4.1. Help Desk Holds the Major Market Share
- 4. Market Factor Analysis
- 4.1. Porters Five Forces
- 4.2. Supply/Value Chain
- 4.3. PESTEL analysis
- 4.4. Market Entropy
- 4.5. Patent/Trademark Analysis
- 5. Global Consumer Technical Support Services Market Analysis, Insights and Forecast, 2019-2031
- 5.1. Market Analysis, Insights and Forecast - by Type
- 5.1.1. Help Desk
- 5.1.2. Call Centre
- 5.2. Market Analysis, Insights and Forecast - by End-User
- 5.2.1. IT and Telecommunication
- 5.2.2. BFSI
- 5.2.3. Education
- 5.2.4. Manufacturing
- 5.2.5. Automotive
- 5.2.6. Other
- 5.3. Market Analysis, Insights and Forecast - by Region
- 5.3.1. North America
- 5.3.2. South America
- 5.3.3. Europe
- 5.3.4. Middle East & Africa
- 5.3.5. Asia Pacific
- 5.1. Market Analysis, Insights and Forecast - by Type
- 6. North America Consumer Technical Support Services Market Analysis, Insights and Forecast, 2019-2031
- 6.1. Market Analysis, Insights and Forecast - by Type
- 6.1.1. Help Desk
- 6.1.2. Call Centre
- 6.2. Market Analysis, Insights and Forecast - by End-User
- 6.2.1. IT and Telecommunication
- 6.2.2. BFSI
- 6.2.3. Education
- 6.2.4. Manufacturing
- 6.2.5. Automotive
- 6.2.6. Other
- 6.1. Market Analysis, Insights and Forecast - by Type
- 7. South America Consumer Technical Support Services Market Analysis, Insights and Forecast, 2019-2031
- 7.1. Market Analysis, Insights and Forecast - by Type
- 7.1.1. Help Desk
- 7.1.2. Call Centre
- 7.2. Market Analysis, Insights and Forecast - by End-User
- 7.2.1. IT and Telecommunication
- 7.2.2. BFSI
- 7.2.3. Education
- 7.2.4. Manufacturing
- 7.2.5. Automotive
- 7.2.6. Other
- 7.1. Market Analysis, Insights and Forecast - by Type
- 8. Europe Consumer Technical Support Services Market Analysis, Insights and Forecast, 2019-2031
- 8.1. Market Analysis, Insights and Forecast - by Type
- 8.1.1. Help Desk
- 8.1.2. Call Centre
- 8.2. Market Analysis, Insights and Forecast - by End-User
- 8.2.1. IT and Telecommunication
- 8.2.2. BFSI
- 8.2.3. Education
- 8.2.4. Manufacturing
- 8.2.5. Automotive
- 8.2.6. Other
- 8.1. Market Analysis, Insights and Forecast - by Type
- 9. Middle East & Africa Consumer Technical Support Services Market Analysis, Insights and Forecast, 2019-2031
- 9.1. Market Analysis, Insights and Forecast - by Type
- 9.1.1. Help Desk
- 9.1.2. Call Centre
- 9.2. Market Analysis, Insights and Forecast - by End-User
- 9.2.1. IT and Telecommunication
- 9.2.2. BFSI
- 9.2.3. Education
- 9.2.4. Manufacturing
- 9.2.5. Automotive
- 9.2.6. Other
- 9.1. Market Analysis, Insights and Forecast - by Type
- 10. Asia Pacific Consumer Technical Support Services Market Analysis, Insights and Forecast, 2019-2031
- 10.1. Market Analysis, Insights and Forecast - by Type
- 10.1.1. Help Desk
- 10.1.2. Call Centre
- 10.2. Market Analysis, Insights and Forecast - by End-User
- 10.2.1. IT and Telecommunication
- 10.2.2. BFSI
- 10.2.3. Education
- 10.2.4. Manufacturing
- 10.2.5. Automotive
- 10.2.6. Other
- 10.1. Market Analysis, Insights and Forecast - by Type
- 11. North America Consumer Technical Support Services Market Analysis, Insights and Forecast, 2019-2031
- 11.1. Market Analysis, Insights and Forecast - By Country/Sub-region
- 11.1.1 United States
- 11.1.2 Canada
- 11.1.3 Mexico
- 12. Europe Consumer Technical Support Services Market Analysis, Insights and Forecast, 2019-2031
- 12.1. Market Analysis, Insights and Forecast - By Country/Sub-region
- 12.1.1 Germany
- 12.1.2 United Kingdom
- 12.1.3 France
- 12.1.4 Spain
- 12.1.5 Italy
- 12.1.6 Spain
- 12.1.7 Belgium
- 12.1.8 Netherland
- 12.1.9 Nordics
- 12.1.10 Rest of Europe
- 13. Asia Pacific Consumer Technical Support Services Market Analysis, Insights and Forecast, 2019-2031
- 13.1. Market Analysis, Insights and Forecast - By Country/Sub-region
- 13.1.1 China
- 13.1.2 Japan
- 13.1.3 India
- 13.1.4 South Korea
- 13.1.5 Southeast Asia
- 13.1.6 Australia
- 13.1.7 Indonesia
- 13.1.8 Phillipes
- 13.1.9 Singapore
- 13.1.10 Thailandc
- 13.1.11 Rest of Asia Pacific
- 14. South America Consumer Technical Support Services Market Analysis, Insights and Forecast, 2019-2031
- 14.1. Market Analysis, Insights and Forecast - By Country/Sub-region
- 14.1.1 Brazil
- 14.1.2 Argentina
- 14.1.3 Peru
- 14.1.4 Chile
- 14.1.5 Colombia
- 14.1.6 Ecuador
- 14.1.7 Venezuela
- 14.1.8 Rest of South America
- 15. North America Consumer Technical Support Services Market Analysis, Insights and Forecast, 2019-2031
- 15.1. Market Analysis, Insights and Forecast - By Country/Sub-region
- 15.1.1 United States
- 15.1.2 Canada
- 15.1.3 Mexico
- 16. MEA Consumer Technical Support Services Market Analysis, Insights and Forecast, 2019-2031
- 16.1. Market Analysis, Insights and Forecast - By Country/Sub-region
- 16.1.1 United Arab Emirates
- 16.1.2 Saudi Arabia
- 16.1.3 South Africa
- 16.1.4 Rest of Middle East and Africa
- 17. Competitive Analysis
- 17.1. Global Market Share Analysis 2024
- 17.2. Company Profiles
- 17.2.1 Infosys Limited
- 17.2.1.1. Overview
- 17.2.1.2. Products
- 17.2.1.3. SWOT Analysis
- 17.2.1.4. Recent Developments
- 17.2.1.5. Financials (Based on Availability)
- 17.2.2 Accenture PLC
- 17.2.2.1. Overview
- 17.2.2.2. Products
- 17.2.2.3. SWOT Analysis
- 17.2.2.4. Recent Developments
- 17.2.2.5. Financials (Based on Availability)
- 17.2.3 Suma Soft
- 17.2.3.1. Overview
- 17.2.3.2. Products
- 17.2.3.3. SWOT Analysis
- 17.2.3.4. Recent Developments
- 17.2.3.5. Financials (Based on Availability)
- 17.2.4 HCL Technologies
- 17.2.4.1. Overview
- 17.2.4.2. Products
- 17.2.4.3. SWOT Analysis
- 17.2.4.4. Recent Developments
- 17.2.4.5. Financials (Based on Availability)
- 17.2.5 IBM Corporation
- 17.2.5.1. Overview
- 17.2.5.2. Products
- 17.2.5.3. SWOT Analysis
- 17.2.5.4. Recent Developments
- 17.2.5.5. Financials (Based on Availability)
- 17.2.6 Flatworld Solutions Pvt Ltd
- 17.2.6.1. Overview
- 17.2.6.2. Products
- 17.2.6.3. SWOT Analysis
- 17.2.6.4. Recent Developments
- 17.2.6.5. Financials (Based on Availability)
- 17.2.7 Qcom Outsourcing Ltd
- 17.2.7.1. Overview
- 17.2.7.2. Products
- 17.2.7.3. SWOT Analysis
- 17.2.7.4. Recent Developments
- 17.2.7.5. Financials (Based on Availability)
- 17.2.8 Collabera Inc
- 17.2.8.1. Overview
- 17.2.8.2. Products
- 17.2.8.3. SWOT Analysis
- 17.2.8.4. Recent Developments
- 17.2.8.5. Financials (Based on Availability)
- 17.2.9 Genpact
- 17.2.9.1. Overview
- 17.2.9.2. Products
- 17.2.9.3. SWOT Analysis
- 17.2.9.4. Recent Developments
- 17.2.9.5. Financials (Based on Availability)
- 17.2.10 Aegis Plc(Essar)
- 17.2.10.1. Overview
- 17.2.10.2. Products
- 17.2.10.3. SWOT Analysis
- 17.2.10.4. Recent Developments
- 17.2.10.5. Financials (Based on Availability)
- 17.2.11 Worldwide Call Centers Inc
- 17.2.11.1. Overview
- 17.2.11.2. Products
- 17.2.11.3. SWOT Analysis
- 17.2.11.4. Recent Developments
- 17.2.11.5. Financials (Based on Availability)
- 17.2.12 Tata Consultancy Services Limited
- 17.2.12.1. Overview
- 17.2.12.2. Products
- 17.2.12.3. SWOT Analysis
- 17.2.12.4. Recent Developments
- 17.2.12.5. Financials (Based on Availability)
- 17.2.13 Wipro Limited
- 17.2.13.1. Overview
- 17.2.13.2. Products
- 17.2.13.3. SWOT Analysis
- 17.2.13.4. Recent Developments
- 17.2.13.5. Financials (Based on Availability)
- 17.2.1 Infosys Limited
List of Figures
- Figure 1: Global Consumer Technical Support Services Market Revenue Breakdown (Million, %) by Region 2024 & 2032
- Figure 2: Global Consumer Technical Support Services Market Volume Breakdown (K Unit, %) by Region 2024 & 2032
- Figure 3: North America Consumer Technical Support Services Market Revenue (Million), by Country 2024 & 2032
- Figure 4: North America Consumer Technical Support Services Market Volume (K Unit), by Country 2024 & 2032
- Figure 5: North America Consumer Technical Support Services Market Revenue Share (%), by Country 2024 & 2032
- Figure 6: North America Consumer Technical Support Services Market Volume Share (%), by Country 2024 & 2032
- Figure 7: Europe Consumer Technical Support Services Market Revenue (Million), by Country 2024 & 2032
- Figure 8: Europe Consumer Technical Support Services Market Volume (K Unit), by Country 2024 & 2032
- Figure 9: Europe Consumer Technical Support Services Market Revenue Share (%), by Country 2024 & 2032
- Figure 10: Europe Consumer Technical Support Services Market Volume Share (%), by Country 2024 & 2032
- Figure 11: Asia Pacific Consumer Technical Support Services Market Revenue (Million), by Country 2024 & 2032
- Figure 12: Asia Pacific Consumer Technical Support Services Market Volume (K Unit), by Country 2024 & 2032
- Figure 13: Asia Pacific Consumer Technical Support Services Market Revenue Share (%), by Country 2024 & 2032
- Figure 14: Asia Pacific Consumer Technical Support Services Market Volume Share (%), by Country 2024 & 2032
- Figure 15: South America Consumer Technical Support Services Market Revenue (Million), by Country 2024 & 2032
- Figure 16: South America Consumer Technical Support Services Market Volume (K Unit), by Country 2024 & 2032
- Figure 17: South America Consumer Technical Support Services Market Revenue Share (%), by Country 2024 & 2032
- Figure 18: South America Consumer Technical Support Services Market Volume Share (%), by Country 2024 & 2032
- Figure 19: North America Consumer Technical Support Services Market Revenue (Million), by Country 2024 & 2032
- Figure 20: North America Consumer Technical Support Services Market Volume (K Unit), by Country 2024 & 2032
- Figure 21: North America Consumer Technical Support Services Market Revenue Share (%), by Country 2024 & 2032
- Figure 22: North America Consumer Technical Support Services Market Volume Share (%), by Country 2024 & 2032
- Figure 23: MEA Consumer Technical Support Services Market Revenue (Million), by Country 2024 & 2032
- Figure 24: MEA Consumer Technical Support Services Market Volume (K Unit), by Country 2024 & 2032
- Figure 25: MEA Consumer Technical Support Services Market Revenue Share (%), by Country 2024 & 2032
- Figure 26: MEA Consumer Technical Support Services Market Volume Share (%), by Country 2024 & 2032
- Figure 27: North America Consumer Technical Support Services Market Revenue (Million), by Type 2024 & 2032
- Figure 28: North America Consumer Technical Support Services Market Volume (K Unit), by Type 2024 & 2032
- Figure 29: North America Consumer Technical Support Services Market Revenue Share (%), by Type 2024 & 2032
- Figure 30: North America Consumer Technical Support Services Market Volume Share (%), by Type 2024 & 2032
- Figure 31: North America Consumer Technical Support Services Market Revenue (Million), by End-User 2024 & 2032
- Figure 32: North America Consumer Technical Support Services Market Volume (K Unit), by End-User 2024 & 2032
- Figure 33: North America Consumer Technical Support Services Market Revenue Share (%), by End-User 2024 & 2032
- Figure 34: North America Consumer Technical Support Services Market Volume Share (%), by End-User 2024 & 2032
- Figure 35: North America Consumer Technical Support Services Market Revenue (Million), by Country 2024 & 2032
- Figure 36: North America Consumer Technical Support Services Market Volume (K Unit), by Country 2024 & 2032
- Figure 37: North America Consumer Technical Support Services Market Revenue Share (%), by Country 2024 & 2032
- Figure 38: North America Consumer Technical Support Services Market Volume Share (%), by Country 2024 & 2032
- Figure 39: South America Consumer Technical Support Services Market Revenue (Million), by Type 2024 & 2032
- Figure 40: South America Consumer Technical Support Services Market Volume (K Unit), by Type 2024 & 2032
- Figure 41: South America Consumer Technical Support Services Market Revenue Share (%), by Type 2024 & 2032
- Figure 42: South America Consumer Technical Support Services Market Volume Share (%), by Type 2024 & 2032
- Figure 43: South America Consumer Technical Support Services Market Revenue (Million), by End-User 2024 & 2032
- Figure 44: South America Consumer Technical Support Services Market Volume (K Unit), by End-User 2024 & 2032
- Figure 45: South America Consumer Technical Support Services Market Revenue Share (%), by End-User 2024 & 2032
- Figure 46: South America Consumer Technical Support Services Market Volume Share (%), by End-User 2024 & 2032
- Figure 47: South America Consumer Technical Support Services Market Revenue (Million), by Country 2024 & 2032
- Figure 48: South America Consumer Technical Support Services Market Volume (K Unit), by Country 2024 & 2032
- Figure 49: South America Consumer Technical Support Services Market Revenue Share (%), by Country 2024 & 2032
- Figure 50: South America Consumer Technical Support Services Market Volume Share (%), by Country 2024 & 2032
- Figure 51: Europe Consumer Technical Support Services Market Revenue (Million), by Type 2024 & 2032
- Figure 52: Europe Consumer Technical Support Services Market Volume (K Unit), by Type 2024 & 2032
- Figure 53: Europe Consumer Technical Support Services Market Revenue Share (%), by Type 2024 & 2032
- Figure 54: Europe Consumer Technical Support Services Market Volume Share (%), by Type 2024 & 2032
- Figure 55: Europe Consumer Technical Support Services Market Revenue (Million), by End-User 2024 & 2032
- Figure 56: Europe Consumer Technical Support Services Market Volume (K Unit), by End-User 2024 & 2032
- Figure 57: Europe Consumer Technical Support Services Market Revenue Share (%), by End-User 2024 & 2032
- Figure 58: Europe Consumer Technical Support Services Market Volume Share (%), by End-User 2024 & 2032
- Figure 59: Europe Consumer Technical Support Services Market Revenue (Million), by Country 2024 & 2032
- Figure 60: Europe Consumer Technical Support Services Market Volume (K Unit), by Country 2024 & 2032
- Figure 61: Europe Consumer Technical Support Services Market Revenue Share (%), by Country 2024 & 2032
- Figure 62: Europe Consumer Technical Support Services Market Volume Share (%), by Country 2024 & 2032
- Figure 63: Middle East & Africa Consumer Technical Support Services Market Revenue (Million), by Type 2024 & 2032
- Figure 64: Middle East & Africa Consumer Technical Support Services Market Volume (K Unit), by Type 2024 & 2032
- Figure 65: Middle East & Africa Consumer Technical Support Services Market Revenue Share (%), by Type 2024 & 2032
- Figure 66: Middle East & Africa Consumer Technical Support Services Market Volume Share (%), by Type 2024 & 2032
- Figure 67: Middle East & Africa Consumer Technical Support Services Market Revenue (Million), by End-User 2024 & 2032
- Figure 68: Middle East & Africa Consumer Technical Support Services Market Volume (K Unit), by End-User 2024 & 2032
- Figure 69: Middle East & Africa Consumer Technical Support Services Market Revenue Share (%), by End-User 2024 & 2032
- Figure 70: Middle East & Africa Consumer Technical Support Services Market Volume Share (%), by End-User 2024 & 2032
- Figure 71: Middle East & Africa Consumer Technical Support Services Market Revenue (Million), by Country 2024 & 2032
- Figure 72: Middle East & Africa Consumer Technical Support Services Market Volume (K Unit), by Country 2024 & 2032
- Figure 73: Middle East & Africa Consumer Technical Support Services Market Revenue Share (%), by Country 2024 & 2032
- Figure 74: Middle East & Africa Consumer Technical Support Services Market Volume Share (%), by Country 2024 & 2032
- Figure 75: Asia Pacific Consumer Technical Support Services Market Revenue (Million), by Type 2024 & 2032
- Figure 76: Asia Pacific Consumer Technical Support Services Market Volume (K Unit), by Type 2024 & 2032
- Figure 77: Asia Pacific Consumer Technical Support Services Market Revenue Share (%), by Type 2024 & 2032
- Figure 78: Asia Pacific Consumer Technical Support Services Market Volume Share (%), by Type 2024 & 2032
- Figure 79: Asia Pacific Consumer Technical Support Services Market Revenue (Million), by End-User 2024 & 2032
- Figure 80: Asia Pacific Consumer Technical Support Services Market Volume (K Unit), by End-User 2024 & 2032
- Figure 81: Asia Pacific Consumer Technical Support Services Market Revenue Share (%), by End-User 2024 & 2032
- Figure 82: Asia Pacific Consumer Technical Support Services Market Volume Share (%), by End-User 2024 & 2032
- Figure 83: Asia Pacific Consumer Technical Support Services Market Revenue (Million), by Country 2024 & 2032
- Figure 84: Asia Pacific Consumer Technical Support Services Market Volume (K Unit), by Country 2024 & 2032
- Figure 85: Asia Pacific Consumer Technical Support Services Market Revenue Share (%), by Country 2024 & 2032
- Figure 86: Asia Pacific Consumer Technical Support Services Market Volume Share (%), by Country 2024 & 2032
List of Tables
- Table 1: Global Consumer Technical Support Services Market Revenue Million Forecast, by Region 2019 & 2032
- Table 2: Global Consumer Technical Support Services Market Volume K Unit Forecast, by Region 2019 & 2032
- Table 3: Global Consumer Technical Support Services Market Revenue Million Forecast, by Type 2019 & 2032
- Table 4: Global Consumer Technical Support Services Market Volume K Unit Forecast, by Type 2019 & 2032
- Table 5: Global Consumer Technical Support Services Market Revenue Million Forecast, by End-User 2019 & 2032
- Table 6: Global Consumer Technical Support Services Market Volume K Unit Forecast, by End-User 2019 & 2032
- Table 7: Global Consumer Technical Support Services Market Revenue Million Forecast, by Region 2019 & 2032
- Table 8: Global Consumer Technical Support Services Market Volume K Unit Forecast, by Region 2019 & 2032
- Table 9: Global Consumer Technical Support Services Market Revenue Million Forecast, by Country 2019 & 2032
- Table 10: Global Consumer Technical Support Services Market Volume K Unit Forecast, by Country 2019 & 2032
- Table 11: United States Consumer Technical Support Services Market Revenue (Million) Forecast, by Application 2019 & 2032
- Table 12: United States Consumer Technical Support Services Market Volume (K Unit) Forecast, by Application 2019 & 2032
- Table 13: Canada Consumer Technical Support Services Market Revenue (Million) Forecast, by Application 2019 & 2032
- Table 14: Canada Consumer Technical Support Services Market Volume (K Unit) Forecast, by Application 2019 & 2032
- Table 15: Mexico Consumer Technical Support Services Market Revenue (Million) Forecast, by Application 2019 & 2032
- Table 16: Mexico Consumer Technical Support Services Market Volume (K Unit) Forecast, by Application 2019 & 2032
- Table 17: Global Consumer Technical Support Services Market Revenue Million Forecast, by Country 2019 & 2032
- Table 18: Global Consumer Technical Support Services Market Volume K Unit Forecast, by Country 2019 & 2032
- Table 19: Germany Consumer Technical Support Services Market Revenue (Million) Forecast, by Application 2019 & 2032
- Table 20: Germany Consumer Technical Support Services Market Volume (K Unit) Forecast, by Application 2019 & 2032
- Table 21: United Kingdom Consumer Technical Support Services Market Revenue (Million) Forecast, by Application 2019 & 2032
- Table 22: United Kingdom Consumer Technical Support Services Market Volume (K Unit) Forecast, by Application 2019 & 2032
- Table 23: France Consumer Technical Support Services Market Revenue (Million) Forecast, by Application 2019 & 2032
- Table 24: France Consumer Technical Support Services Market Volume (K Unit) Forecast, by Application 2019 & 2032
- Table 25: Spain Consumer Technical Support Services Market Revenue (Million) Forecast, by Application 2019 & 2032
- Table 26: Spain Consumer Technical Support Services Market Volume (K Unit) Forecast, by Application 2019 & 2032
- Table 27: Italy Consumer Technical Support Services Market Revenue (Million) Forecast, by Application 2019 & 2032
- Table 28: Italy Consumer Technical Support Services Market Volume (K Unit) Forecast, by Application 2019 & 2032
- Table 29: Spain Consumer Technical Support Services Market Revenue (Million) Forecast, by Application 2019 & 2032
- Table 30: Spain Consumer Technical Support Services Market Volume (K Unit) Forecast, by Application 2019 & 2032
- Table 31: Belgium Consumer Technical Support Services Market Revenue (Million) Forecast, by Application 2019 & 2032
- Table 32: Belgium Consumer Technical Support Services Market Volume (K Unit) Forecast, by Application 2019 & 2032
- Table 33: Netherland Consumer Technical Support Services Market Revenue (Million) Forecast, by Application 2019 & 2032
- Table 34: Netherland Consumer Technical Support Services Market Volume (K Unit) Forecast, by Application 2019 & 2032
- Table 35: Nordics Consumer Technical Support Services Market Revenue (Million) Forecast, by Application 2019 & 2032
- Table 36: Nordics Consumer Technical Support Services Market Volume (K Unit) Forecast, by Application 2019 & 2032
- Table 37: Rest of Europe Consumer Technical Support Services Market Revenue (Million) Forecast, by Application 2019 & 2032
- Table 38: Rest of Europe Consumer Technical Support Services Market Volume (K Unit) Forecast, by Application 2019 & 2032
- Table 39: Global Consumer Technical Support Services Market Revenue Million Forecast, by Country 2019 & 2032
- Table 40: Global Consumer Technical Support Services Market Volume K Unit Forecast, by Country 2019 & 2032
- Table 41: China Consumer Technical Support Services Market Revenue (Million) Forecast, by Application 2019 & 2032
- Table 42: China Consumer Technical Support Services Market Volume (K Unit) Forecast, by Application 2019 & 2032
- Table 43: Japan Consumer Technical Support Services Market Revenue (Million) Forecast, by Application 2019 & 2032
- Table 44: Japan Consumer Technical Support Services Market Volume (K Unit) Forecast, by Application 2019 & 2032
- Table 45: India Consumer Technical Support Services Market Revenue (Million) Forecast, by Application 2019 & 2032
- Table 46: India Consumer Technical Support Services Market Volume (K Unit) Forecast, by Application 2019 & 2032
- Table 47: South Korea Consumer Technical Support Services Market Revenue (Million) Forecast, by Application 2019 & 2032
- Table 48: South Korea Consumer Technical Support Services Market Volume (K Unit) Forecast, by Application 2019 & 2032
- Table 49: Southeast Asia Consumer Technical Support Services Market Revenue (Million) Forecast, by Application 2019 & 2032
- Table 50: Southeast Asia Consumer Technical Support Services Market Volume (K Unit) Forecast, by Application 2019 & 2032
- Table 51: Australia Consumer Technical Support Services Market Revenue (Million) Forecast, by Application 2019 & 2032
- Table 52: Australia Consumer Technical Support Services Market Volume (K Unit) Forecast, by Application 2019 & 2032
- Table 53: Indonesia Consumer Technical Support Services Market Revenue (Million) Forecast, by Application 2019 & 2032
- Table 54: Indonesia Consumer Technical Support Services Market Volume (K Unit) Forecast, by Application 2019 & 2032
- Table 55: Phillipes Consumer Technical Support Services Market Revenue (Million) Forecast, by Application 2019 & 2032
- Table 56: Phillipes Consumer Technical Support Services Market Volume (K Unit) Forecast, by Application 2019 & 2032
- Table 57: Singapore Consumer Technical Support Services Market Revenue (Million) Forecast, by Application 2019 & 2032
- Table 58: Singapore Consumer Technical Support Services Market Volume (K Unit) Forecast, by Application 2019 & 2032
- Table 59: Thailandc Consumer Technical Support Services Market Revenue (Million) Forecast, by Application 2019 & 2032
- Table 60: Thailandc Consumer Technical Support Services Market Volume (K Unit) Forecast, by Application 2019 & 2032
- Table 61: Rest of Asia Pacific Consumer Technical Support Services Market Revenue (Million) Forecast, by Application 2019 & 2032
- Table 62: Rest of Asia Pacific Consumer Technical Support Services Market Volume (K Unit) Forecast, by Application 2019 & 2032
- Table 63: Global Consumer Technical Support Services Market Revenue Million Forecast, by Country 2019 & 2032
- Table 64: Global Consumer Technical Support Services Market Volume K Unit Forecast, by Country 2019 & 2032
- Table 65: Brazil Consumer Technical Support Services Market Revenue (Million) Forecast, by Application 2019 & 2032
- Table 66: Brazil Consumer Technical Support Services Market Volume (K Unit) Forecast, by Application 2019 & 2032
- Table 67: Argentina Consumer Technical Support Services Market Revenue (Million) Forecast, by Application 2019 & 2032
- Table 68: Argentina Consumer Technical Support Services Market Volume (K Unit) Forecast, by Application 2019 & 2032
- Table 69: Peru Consumer Technical Support Services Market Revenue (Million) Forecast, by Application 2019 & 2032
- Table 70: Peru Consumer Technical Support Services Market Volume (K Unit) Forecast, by Application 2019 & 2032
- Table 71: Chile Consumer Technical Support Services Market Revenue (Million) Forecast, by Application 2019 & 2032
- Table 72: Chile Consumer Technical Support Services Market Volume (K Unit) Forecast, by Application 2019 & 2032
- Table 73: Colombia Consumer Technical Support Services Market Revenue (Million) Forecast, by Application 2019 & 2032
- Table 74: Colombia Consumer Technical Support Services Market Volume (K Unit) Forecast, by Application 2019 & 2032
- Table 75: Ecuador Consumer Technical Support Services Market Revenue (Million) Forecast, by Application 2019 & 2032
- Table 76: Ecuador Consumer Technical Support Services Market Volume (K Unit) Forecast, by Application 2019 & 2032
- Table 77: Venezuela Consumer Technical Support Services Market Revenue (Million) Forecast, by Application 2019 & 2032
- Table 78: Venezuela Consumer Technical Support Services Market Volume (K Unit) Forecast, by Application 2019 & 2032
- Table 79: Rest of South America Consumer Technical Support Services Market Revenue (Million) Forecast, by Application 2019 & 2032
- Table 80: Rest of South America Consumer Technical Support Services Market Volume (K Unit) Forecast, by Application 2019 & 2032
- Table 81: Global Consumer Technical Support Services Market Revenue Million Forecast, by Country 2019 & 2032
- Table 82: Global Consumer Technical Support Services Market Volume K Unit Forecast, by Country 2019 & 2032
- Table 83: United States Consumer Technical Support Services Market Revenue (Million) Forecast, by Application 2019 & 2032
- Table 84: United States Consumer Technical Support Services Market Volume (K Unit) Forecast, by Application 2019 & 2032
- Table 85: Canada Consumer Technical Support Services Market Revenue (Million) Forecast, by Application 2019 & 2032
- Table 86: Canada Consumer Technical Support Services Market Volume (K Unit) Forecast, by Application 2019 & 2032
- Table 87: Mexico Consumer Technical Support Services Market Revenue (Million) Forecast, by Application 2019 & 2032
- Table 88: Mexico Consumer Technical Support Services Market Volume (K Unit) Forecast, by Application 2019 & 2032
- Table 89: Global Consumer Technical Support Services Market Revenue Million Forecast, by Country 2019 & 2032
- Table 90: Global Consumer Technical Support Services Market Volume K Unit Forecast, by Country 2019 & 2032
- Table 91: United Arab Emirates Consumer Technical Support Services Market Revenue (Million) Forecast, by Application 2019 & 2032
- Table 92: United Arab Emirates Consumer Technical Support Services Market Volume (K Unit) Forecast, by Application 2019 & 2032
- Table 93: Saudi Arabia Consumer Technical Support Services Market Revenue (Million) Forecast, by Application 2019 & 2032
- Table 94: Saudi Arabia Consumer Technical Support Services Market Volume (K Unit) Forecast, by Application 2019 & 2032
- Table 95: South Africa Consumer Technical Support Services Market Revenue (Million) Forecast, by Application 2019 & 2032
- Table 96: South Africa Consumer Technical Support Services Market Volume (K Unit) Forecast, by Application 2019 & 2032
- Table 97: Rest of Middle East and Africa Consumer Technical Support Services Market Revenue (Million) Forecast, by Application 2019 & 2032
- Table 98: Rest of Middle East and Africa Consumer Technical Support Services Market Volume (K Unit) Forecast, by Application 2019 & 2032
- Table 99: Global Consumer Technical Support Services Market Revenue Million Forecast, by Type 2019 & 2032
- Table 100: Global Consumer Technical Support Services Market Volume K Unit Forecast, by Type 2019 & 2032
- Table 101: Global Consumer Technical Support Services Market Revenue Million Forecast, by End-User 2019 & 2032
- Table 102: Global Consumer Technical Support Services Market Volume K Unit Forecast, by End-User 2019 & 2032
- Table 103: Global Consumer Technical Support Services Market Revenue Million Forecast, by Country 2019 & 2032
- Table 104: Global Consumer Technical Support Services Market Volume K Unit Forecast, by Country 2019 & 2032
- Table 105: United States Consumer Technical Support Services Market Revenue (Million) Forecast, by Application 2019 & 2032
- Table 106: United States Consumer Technical Support Services Market Volume (K Unit) Forecast, by Application 2019 & 2032
- Table 107: Canada Consumer Technical Support Services Market Revenue (Million) Forecast, by Application 2019 & 2032
- Table 108: Canada Consumer Technical Support Services Market Volume (K Unit) Forecast, by Application 2019 & 2032
- Table 109: Mexico Consumer Technical Support Services Market Revenue (Million) Forecast, by Application 2019 & 2032
- Table 110: Mexico Consumer Technical Support Services Market Volume (K Unit) Forecast, by Application 2019 & 2032
- Table 111: Global Consumer Technical Support Services Market Revenue Million Forecast, by Type 2019 & 2032
- Table 112: Global Consumer Technical Support Services Market Volume K Unit Forecast, by Type 2019 & 2032
- Table 113: Global Consumer Technical Support Services Market Revenue Million Forecast, by End-User 2019 & 2032
- Table 114: Global Consumer Technical Support Services Market Volume K Unit Forecast, by End-User 2019 & 2032
- Table 115: Global Consumer Technical Support Services Market Revenue Million Forecast, by Country 2019 & 2032
- Table 116: Global Consumer Technical Support Services Market Volume K Unit Forecast, by Country 2019 & 2032
- Table 117: Brazil Consumer Technical Support Services Market Revenue (Million) Forecast, by Application 2019 & 2032
- Table 118: Brazil Consumer Technical Support Services Market Volume (K Unit) Forecast, by Application 2019 & 2032
- Table 119: Argentina Consumer Technical Support Services Market Revenue (Million) Forecast, by Application 2019 & 2032
- Table 120: Argentina Consumer Technical Support Services Market Volume (K Unit) Forecast, by Application 2019 & 2032
- Table 121: Rest of South America Consumer Technical Support Services Market Revenue (Million) Forecast, by Application 2019 & 2032
- Table 122: Rest of South America Consumer Technical Support Services Market Volume (K Unit) Forecast, by Application 2019 & 2032
- Table 123: Global Consumer Technical Support Services Market Revenue Million Forecast, by Type 2019 & 2032
- Table 124: Global Consumer Technical Support Services Market Volume K Unit Forecast, by Type 2019 & 2032
- Table 125: Global Consumer Technical Support Services Market Revenue Million Forecast, by End-User 2019 & 2032
- Table 126: Global Consumer Technical Support Services Market Volume K Unit Forecast, by End-User 2019 & 2032
- Table 127: Global Consumer Technical Support Services Market Revenue Million Forecast, by Country 2019 & 2032
- Table 128: Global Consumer Technical Support Services Market Volume K Unit Forecast, by Country 2019 & 2032
- Table 129: United Kingdom Consumer Technical Support Services Market Revenue (Million) Forecast, by Application 2019 & 2032
- Table 130: United Kingdom Consumer Technical Support Services Market Volume (K Unit) Forecast, by Application 2019 & 2032
- Table 131: Germany Consumer Technical Support Services Market Revenue (Million) Forecast, by Application 2019 & 2032
- Table 132: Germany Consumer Technical Support Services Market Volume (K Unit) Forecast, by Application 2019 & 2032
- Table 133: France Consumer Technical Support Services Market Revenue (Million) Forecast, by Application 2019 & 2032
- Table 134: France Consumer Technical Support Services Market Volume (K Unit) Forecast, by Application 2019 & 2032
- Table 135: Italy Consumer Technical Support Services Market Revenue (Million) Forecast, by Application 2019 & 2032
- Table 136: Italy Consumer Technical Support Services Market Volume (K Unit) Forecast, by Application 2019 & 2032
- Table 137: Spain Consumer Technical Support Services Market Revenue (Million) Forecast, by Application 2019 & 2032
- Table 138: Spain Consumer Technical Support Services Market Volume (K Unit) Forecast, by Application 2019 & 2032
- Table 139: Russia Consumer Technical Support Services Market Revenue (Million) Forecast, by Application 2019 & 2032
- Table 140: Russia Consumer Technical Support Services Market Volume (K Unit) Forecast, by Application 2019 & 2032
- Table 141: Benelux Consumer Technical Support Services Market Revenue (Million) Forecast, by Application 2019 & 2032
- Table 142: Benelux Consumer Technical Support Services Market Volume (K Unit) Forecast, by Application 2019 & 2032
- Table 143: Nordics Consumer Technical Support Services Market Revenue (Million) Forecast, by Application 2019 & 2032
- Table 144: Nordics Consumer Technical Support Services Market Volume (K Unit) Forecast, by Application 2019 & 2032
- Table 145: Rest of Europe Consumer Technical Support Services Market Revenue (Million) Forecast, by Application 2019 & 2032
- Table 146: Rest of Europe Consumer Technical Support Services Market Volume (K Unit) Forecast, by Application 2019 & 2032
- Table 147: Global Consumer Technical Support Services Market Revenue Million Forecast, by Type 2019 & 2032
- Table 148: Global Consumer Technical Support Services Market Volume K Unit Forecast, by Type 2019 & 2032
- Table 149: Global Consumer Technical Support Services Market Revenue Million Forecast, by End-User 2019 & 2032
- Table 150: Global Consumer Technical Support Services Market Volume K Unit Forecast, by End-User 2019 & 2032
- Table 151: Global Consumer Technical Support Services Market Revenue Million Forecast, by Country 2019 & 2032
- Table 152: Global Consumer Technical Support Services Market Volume K Unit Forecast, by Country 2019 & 2032
- Table 153: Turkey Consumer Technical Support Services Market Revenue (Million) Forecast, by Application 2019 & 2032
- Table 154: Turkey Consumer Technical Support Services Market Volume (K Unit) Forecast, by Application 2019 & 2032
- Table 155: Israel Consumer Technical Support Services Market Revenue (Million) Forecast, by Application 2019 & 2032
- Table 156: Israel Consumer Technical Support Services Market Volume (K Unit) Forecast, by Application 2019 & 2032
- Table 157: GCC Consumer Technical Support Services Market Revenue (Million) Forecast, by Application 2019 & 2032
- Table 158: GCC Consumer Technical Support Services Market Volume (K Unit) Forecast, by Application 2019 & 2032
- Table 159: North Africa Consumer Technical Support Services Market Revenue (Million) Forecast, by Application 2019 & 2032
- Table 160: North Africa Consumer Technical Support Services Market Volume (K Unit) Forecast, by Application 2019 & 2032
- Table 161: South Africa Consumer Technical Support Services Market Revenue (Million) Forecast, by Application 2019 & 2032
- Table 162: South Africa Consumer Technical Support Services Market Volume (K Unit) Forecast, by Application 2019 & 2032
- Table 163: Rest of Middle East & Africa Consumer Technical Support Services Market Revenue (Million) Forecast, by Application 2019 & 2032
- Table 164: Rest of Middle East & Africa Consumer Technical Support Services Market Volume (K Unit) Forecast, by Application 2019 & 2032
- Table 165: Global Consumer Technical Support Services Market Revenue Million Forecast, by Type 2019 & 2032
- Table 166: Global Consumer Technical Support Services Market Volume K Unit Forecast, by Type 2019 & 2032
- Table 167: Global Consumer Technical Support Services Market Revenue Million Forecast, by End-User 2019 & 2032
- Table 168: Global Consumer Technical Support Services Market Volume K Unit Forecast, by End-User 2019 & 2032
- Table 169: Global Consumer Technical Support Services Market Revenue Million Forecast, by Country 2019 & 2032
- Table 170: Global Consumer Technical Support Services Market Volume K Unit Forecast, by Country 2019 & 2032
- Table 171: China Consumer Technical Support Services Market Revenue (Million) Forecast, by Application 2019 & 2032
- Table 172: China Consumer Technical Support Services Market Volume (K Unit) Forecast, by Application 2019 & 2032
- Table 173: India Consumer Technical Support Services Market Revenue (Million) Forecast, by Application 2019 & 2032
- Table 174: India Consumer Technical Support Services Market Volume (K Unit) Forecast, by Application 2019 & 2032
- Table 175: Japan Consumer Technical Support Services Market Revenue (Million) Forecast, by Application 2019 & 2032
- Table 176: Japan Consumer Technical Support Services Market Volume (K Unit) Forecast, by Application 2019 & 2032
- Table 177: South Korea Consumer Technical Support Services Market Revenue (Million) Forecast, by Application 2019 & 2032
- Table 178: South Korea Consumer Technical Support Services Market Volume (K Unit) Forecast, by Application 2019 & 2032
- Table 179: ASEAN Consumer Technical Support Services Market Revenue (Million) Forecast, by Application 2019 & 2032
- Table 180: ASEAN Consumer Technical Support Services Market Volume (K Unit) Forecast, by Application 2019 & 2032
- Table 181: Oceania Consumer Technical Support Services Market Revenue (Million) Forecast, by Application 2019 & 2032
- Table 182: Oceania Consumer Technical Support Services Market Volume (K Unit) Forecast, by Application 2019 & 2032
- Table 183: Rest of Asia Pacific Consumer Technical Support Services Market Revenue (Million) Forecast, by Application 2019 & 2032
- Table 184: Rest of Asia Pacific Consumer Technical Support Services Market Volume (K Unit) Forecast, by Application 2019 & 2032
Frequently Asked Questions
1. What is the projected Compound Annual Growth Rate (CAGR) of the Consumer Technical Support Services Market?
The projected CAGR is approximately 7.30%.
2. Which companies are prominent players in the Consumer Technical Support Services Market?
Key companies in the market include Infosys Limited, Accenture PLC, Suma Soft, HCL Technologies, IBM Corporation, Flatworld Solutions Pvt Ltd, Qcom Outsourcing Ltd, Collabera Inc, Genpact, Aegis Plc(Essar), Worldwide Call Centers Inc, Tata Consultancy Services Limited, Wipro Limited.
3. What are the main segments of the Consumer Technical Support Services Market?
The market segments include Type, End-User.
4. Can you provide details about the market size?
The market size is estimated to be USD XX Million as of 2022.
5. What are some drivers contributing to market growth?
Increase in Automation in the Industry; Digital Transformation and Industry 4.0 Practices.
6. What are the notable trends driving market growth?
Help Desk Holds the Major Market Share.
7. Are there any restraints impacting market growth?
High Initial Costs and Low ROI; Design and Upgradation of Platforms.
8. Can you provide examples of recent developments in the market?
November 2022: Infosys BPM, the business process management division of Infosys, in collaboration with IBM, opened a center for AI and automation in Poland to deliver digital excellence to businesses worldwide. This announcement highlights the two years of strategic collaboration between Infosys BPM and IBM, which will result in successfully delivering customers, discovering new use cases, and developing solutions that empower clients to innovate in hybrid cloud settings.
9. What pricing options are available for accessing the report?
Pricing options include single-user, multi-user, and enterprise licenses priced at USD 4750, USD 5250, and USD 8750 respectively.
10. Is the market size provided in terms of value or volume?
The market size is provided in terms of value, measured in Million and volume, measured in K Unit.
11. Are there any specific market keywords associated with the report?
Yes, the market keyword associated with the report is "Consumer Technical Support Services Market," which aids in identifying and referencing the specific market segment covered.
12. How do I determine which pricing option suits my needs best?
The pricing options vary based on user requirements and access needs. Individual users may opt for single-user licenses, while businesses requiring broader access may choose multi-user or enterprise licenses for cost-effective access to the report.
13. Are there any additional resources or data provided in the Consumer Technical Support Services Market report?
While the report offers comprehensive insights, it's advisable to review the specific contents or supplementary materials provided to ascertain if additional resources or data are available.
14. How can I stay updated on further developments or reports in the Consumer Technical Support Services Market?
To stay informed about further developments, trends, and reports in the Consumer Technical Support Services Market, consider subscribing to industry newsletters, following relevant companies and organizations, or regularly checking reputable industry news sources and publications.
Methodology
Step 1 - Identification of Relevant Samples Size from Population Database


Step 2 - Approaches for Defining Global Market Size (Value, Volume* & Price*)

Note*: In applicable scenarios
Step 3 - Data Sources
Primary Research
- Web Analytics
- Survey Reports
- Research Institute
- Latest Research Reports
- Opinion Leaders
Secondary Research
- Annual Reports
- White Paper
- Latest Press Release
- Industry Association
- Paid Database
- Investor Presentations

Step 4 - Data Triangulation
Involves using different sources of information in order to increase the validity of a study
These sources are likely to be stakeholders in a program - participants, other researchers, program staff, other community members, and so on.
Then we put all data in single framework & apply various statistical tools to find out the dynamic on the market.
During the analysis stage, feedback from the stakeholder groups would be compared to determine areas of agreement as well as areas of divergence


