
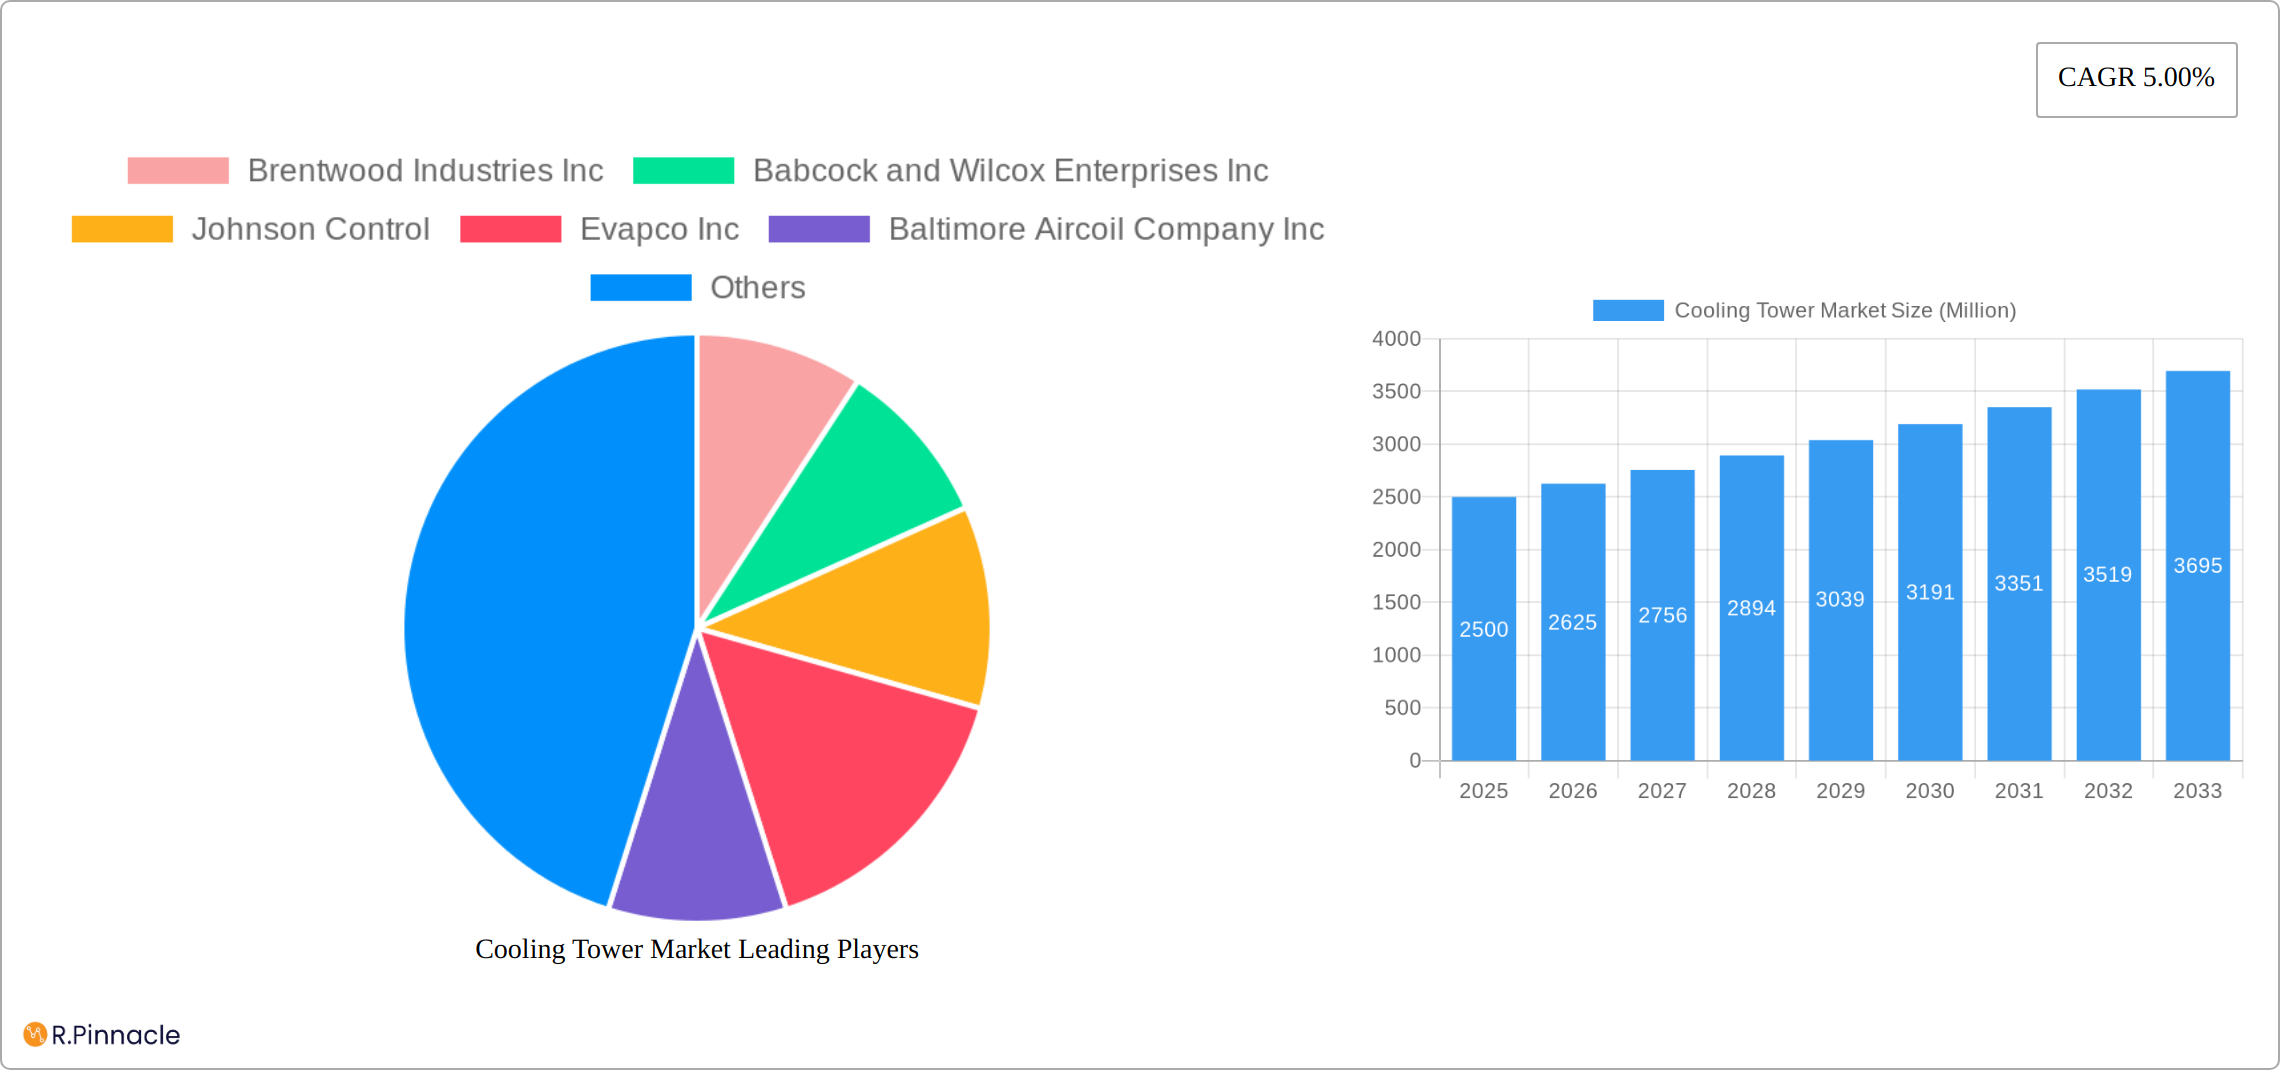
Key Insights
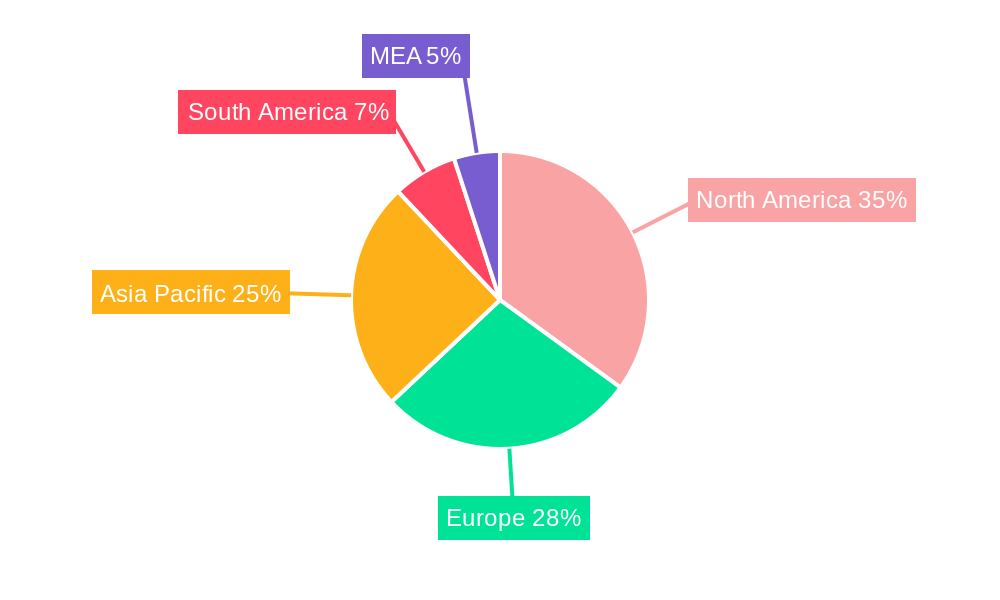
The global cooling tower market, valued at approximately $XX million in 2025, is projected to experience robust growth, exhibiting a compound annual growth rate (CAGR) of 5.00% from 2025 to 2033. This expansion is fueled by several key drivers. Increasing industrialization across developing economies like India and China is creating a significant demand for efficient cooling solutions in various sectors, including power generation, chemical processing, and HVACR (Heating, Ventilation, Air Conditioning, and Refrigeration). Stringent environmental regulations promoting energy-efficient cooling technologies further bolster market growth. The rising adoption of evaporative cooling towers, owing to their cost-effectiveness and high cooling efficiency, is a major trend shaping market dynamics. However, the market faces certain restraints, including high initial investment costs for advanced cooling tower systems and concerns related to water consumption and potential environmental impact. The market is segmented by application (oil & gas, HVACR, chemical, power generation, others), flow type (crossflow, counterflow), and type (evaporative, dry, hybrid). Major players such as Brentwood Industries Inc., Babcock & Wilcox Enterprises Inc., Johnson Controls, Evapco Inc., and Baltimore Aircoil Company Inc. are actively engaged in technological advancements and strategic expansions to maintain their market positions. Regional analysis reveals significant growth opportunities in Asia Pacific, driven by rapid industrialization and urbanization. North America and Europe, while mature markets, continue to contribute substantially to overall market revenue. The market's future trajectory is significantly influenced by the adoption of sustainable cooling technologies, technological advancements in heat transfer efficiency, and governmental policies aimed at reducing carbon emissions.
The competitive landscape is marked by both established multinational corporations and regional players. Companies are focusing on research and development to create more efficient and environmentally friendly cooling towers. This includes developing advanced materials, improving control systems, and integrating digital technologies for monitoring and optimization. Furthermore, mergers, acquisitions, and strategic partnerships are expected to reshape the market landscape in the coming years. The diverse range of applications and the continuous need for improved energy efficiency ensure the cooling tower market's continued growth and evolution, with significant opportunities for innovation and expansion across various geographical regions. The focus will likely shift towards hybrid cooling tower technologies that offer a balance between energy efficiency and water conservation, meeting the demands of a more environmentally conscious world.
Cooling Tower Market Report: 2019-2033 Forecast
This comprehensive report provides a detailed analysis of the Cooling Tower market, offering invaluable insights for industry professionals, investors, and strategic decision-makers. Covering the period from 2019 to 2033, with a focus on 2025, this report meticulously examines market dynamics, segmentation, key players, and future growth potential. The market is projected to reach xx Million by 2033, exhibiting a CAGR of xx% during the forecast period (2025-2033).
Cooling Tower Market Structure & Innovation Trends
This section delves into the competitive landscape of the cooling tower market, analyzing market concentration, innovation drivers, and regulatory influences. We examine the impact of mergers and acquisitions (M&A) activities, providing insights into deal values and their influence on market share.
- Market Concentration: The market exhibits a moderately concentrated structure, with key players holding significant market share. The top five players account for approximately xx% of the global market.
- Innovation Drivers: Stringent environmental regulations, the increasing demand for energy efficiency, and advancements in materials science are driving innovation in cooling tower technology.
- Regulatory Frameworks: Government regulations concerning water conservation and emission reduction significantly impact market growth and product development. Compliance costs and evolving standards influence the adoption of specific cooling tower technologies.
- Product Substitutes: Alternative cooling technologies, such as dry cooling towers and hybrid systems, are emerging as substitutes, impacting the market share of traditional evaporative cooling towers.
- End-User Demographics: The key end-user segments are power generation, HVACR, chemical, and oil & gas industries. Growth in these sectors directly influences the demand for cooling towers.
- M&A Activities: The past five years have witnessed several significant M&A activities in the cooling tower sector, resulting in market consolidation and increased competition. Total M&A deal value is estimated at xx Million during the historical period (2019-2024). Examples include [mention specific M&A deals if data is available, including deal values].
Cooling Tower Market Dynamics & Trends
This section explores the key factors influencing the growth trajectory of the cooling tower market. We analyze market growth drivers, technological disruptions, consumer preferences, and competitive dynamics, providing a comprehensive overview of the market's evolution. The global cooling tower market is expected to experience significant growth, driven primarily by increased industrial activity and stringent environmental regulations.
Market growth is further fueled by:
- Technological advancements: Improved efficiency, reduced water consumption, and enhanced durability are key technological drivers.
- Rising demand from various sectors: The expansion of power generation, HVACR, and chemical industries is increasing the demand for cooling towers.
- Government initiatives: Government regulations promoting energy efficiency and sustainable practices are positively impacting market growth.
- Competitive landscape: Intense competition among key players is leading to innovation and improved product offerings.
Dominant Regions & Segments in Cooling Tower Market
The cooling tower market is experiencing robust growth, driven by a confluence of factors impacting various regions and segments. This section delves into a detailed analysis of the leading players and market dynamics, highlighting the key factors contributing to their dominance.
Leading Region: North America currently holds the largest market share, fueled by robust industrial expansion, particularly in the energy and manufacturing sectors. Stringent environmental regulations and a focus on energy efficiency further bolster demand for advanced cooling tower technologies within the region. Government incentives and supportive policies also contribute to this market leadership.
Leading Application Segment: The power generation segment continues to be the dominant application, driven by the increasing capacity of power plants globally and the critical need for efficient and reliable cooling solutions. The sector's consistent expansion and the ongoing upgrades to existing infrastructure solidify its leading position within the cooling tower market.
Leading Flow Type: Crossflow cooling towers maintain their market dominance due to their compact design, cost-effectiveness, and adaptability to various applications. Their efficient heat transfer capabilities and ease of maintenance further enhance their appeal across diverse industrial settings.
Leading Type: Evaporative cooling towers hold a significant market share, primarily due to their high cooling efficiency and comparatively lower operating costs compared to other types. Their wide-ranging applications and suitability for diverse climates contribute to their sustained popularity.
Cooling Tower Market Product Innovations
The cooling tower industry is characterized by continuous innovation, focusing on enhancing energy efficiency, minimizing water consumption, and reducing environmental impact. Recent advancements include the development of highly efficient adiabatic coolers, which significantly reduce water usage while maintaining optimal cooling performance. The incorporation of advanced materials, such as corrosion-resistant alloys and high-performance polymers, is improving durability and extending the lifespan of cooling towers. These innovations are not only driving cost savings but also addressing growing environmental concerns associated with traditional cooling systems.
Report Scope & Segmentation Analysis
This report segments the cooling tower market based on application (Oil Industry, HVACR, Chemical Industry, Power Generation, Others), flow type (Cross Flow, Counter Flow), and type (Evaporative Cooling Tower, Dry Cooling Tower, Hybrid Cooling Tower). Each segment is analyzed individually, providing market size, growth projections, and competitive dynamics. The report offers a detailed breakdown of the market's structure, allowing for a thorough understanding of its diverse segments and growth trajectories.
Key Drivers of Cooling Tower Market Growth
Several key factors are driving the sustained growth of the cooling tower market:
- Increased industrialization and urbanization: Rapid industrialization across emerging economies and expanding urban centers is creating significant demand for reliable and efficient cooling solutions across a wide range of industries.
- Stringent environmental regulations and sustainability concerns: Governments worldwide are implementing stricter environmental regulations aimed at minimizing water consumption, reducing greenhouse gas emissions, and promoting sustainable industrial practices. This is driving the adoption of advanced, energy-efficient cooling technologies.
- Technological advancements and improved efficiency: Continuous innovation in materials science, engineering, and control systems is leading to the development of more efficient, durable, and environmentally friendly cooling towers. These advancements are further enhanced by improved design optimization and digital monitoring systems.
- Rising global temperatures and climate change: The increasing global temperatures are exacerbating the need for efficient cooling solutions across various sectors, driving the demand for higher capacity and more efficient cooling towers.
Challenges in the Cooling Tower Market Sector
The cooling tower market faces several challenges, including:
- High initial investment costs: The initial investment for installing cooling towers can be substantial, acting as a barrier to entry for some businesses.
- Maintenance and operational costs: Ongoing maintenance and operational costs can be significant, impacting overall profitability.
- Supply chain disruptions: Disruptions to global supply chains can impact the availability of raw materials and components, affecting production and market stability.
Emerging Opportunities in Cooling Tower Market
The cooling tower market presents numerous emerging opportunities, including:
- Expanding into new markets: The increasing industrialization in developing economies presents substantial growth potential.
- Development of innovative technologies: Advancements in materials science, AI, and IoT create opportunities for new and improved cooling tower designs.
- Focus on sustainability: Growing environmental concerns offer opportunities for companies that focus on energy-efficient and water-saving cooling technologies.
Leading Players in the Cooling Tower Market Market
- Brentwood Industries Inc
- Babcock and Wilcox Enterprises Inc
- Johnson Controls
- Evapco Inc
- Baltimore Aircoil Company Inc
- Artech Cooling Towers Pvt Ltd
- SPX Cooling Tech LLC
- Hamon and CIE
- Thermax Limited
- Enexio Management Gmbh
Key Developments in Cooling Tower Market Industry
- February 2023: Baltimore Aircoil Company (BAC) launched the Trillium Series Adiabatic Cooler, a significant advancement highlighting the industry's commitment to energy and water conservation. This product showcases the trend towards more sustainable cooling solutions.
- November 2022: The completion of a 179m cooling tower at the Kursk II nuclear power plant in Russia signifies a remarkable feat in engineering and highlights the demand for large-scale cooling solutions within the nuclear power sector.
- [Add more recent developments with dates and brief descriptions]
Future Outlook for Cooling Tower Market Market
The cooling tower market is poised for continued growth, driven by increasing industrialization, stricter environmental regulations, and technological advancements. The focus on sustainability and energy efficiency will shape future market trends, creating lucrative opportunities for companies offering innovative and environmentally friendly solutions. The market is expected to witness a significant expansion in the coming years, particularly in emerging economies and sectors like renewable energy.
Cooling Tower Market Segmentation
-
1. Application
- 1.1. Oil Industry
- 1.2. HVACR
- 1.3. Chemical Industry
- 1.4. Power Generation
- 1.5. Others
-
2. Flow Type
- 2.1. Cross Flow
- 2.2. Counter Flow
-
3. Type
- 3.1. Evaporative Cooling Tower
- 3.2. Dry Cooling Tower
- 3.3. Hybrid Cooling Tower
Cooling Tower Market Segmentation By Geography
-
1. North America
- 1.1. United States
- 1.2. Canada
- 1.3. Rest of North America
-
2. Europe
- 2.1. Germany
- 2.2. France
- 2.3. United Kingdom
- 2.4. Russia
- 2.5. Rest of Europe
-
3. Asia Pacific
- 3.1. China
- 3.2. India
- 3.3. Australia
- 3.4. Malaysia
- 3.5. Rest of Asia Pacific
-
4. Middle East and Africa
- 4.1. Saudi Arabia
- 4.2. United Arab Emirates
- 4.3. Nigeria
- 4.4. Rest of Middle East and Africa
-
5. South America
- 5.1. Brazil
- 5.2. Argentina
- 5.3. Columbia
- 5.4. Rest of South America
Cooling Tower Market REPORT HIGHLIGHTS
| Aspects | Details |
|---|---|
| Study Period | 2019-2033 |
| Base Year | 2024 |
| Estimated Year | 2025 |
| Forecast Period | 2025-2033 |
| Historical Period | 2019-2024 |
| Growth Rate | CAGR of 5.00% from 2019-2033 |
| Segmentation |
|
Table of Contents
- 1. Introduction
- 1.1. Research Scope
- 1.2. Market Segmentation
- 1.3. Research Methodology
- 1.4. Definitions and Assumptions
- 2. Executive Summary
- 2.1. Introduction
- 3. Market Dynamics
- 3.1. Introduction
- 3.2. Market Drivers
- 3.2.1. 4.; Falling Costs of Green And Blue Hydrogen Generation4.; Rising Demand from The Automotive Sector
- 3.3. Market Restrains
- 3.3.1. 4.; Competition for Alternative Energy Source
- 3.4. Market Trends
- 3.4.1. Power Generation Expected to Witness Growth
- 4. Market Factor Analysis
- 4.1. Porters Five Forces
- 4.2. Supply/Value Chain
- 4.3. PESTEL analysis
- 4.4. Market Entropy
- 4.5. Patent/Trademark Analysis
- 5. Global Cooling Tower Market Analysis, Insights and Forecast, 2019-2031
- 5.1. Market Analysis, Insights and Forecast - by Application
- 5.1.1. Oil Industry
- 5.1.2. HVACR
- 5.1.3. Chemical Industry
- 5.1.4. Power Generation
- 5.1.5. Others
- 5.2. Market Analysis, Insights and Forecast - by Flow Type
- 5.2.1. Cross Flow
- 5.2.2. Counter Flow
- 5.3. Market Analysis, Insights and Forecast - by Type
- 5.3.1. Evaporative Cooling Tower
- 5.3.2. Dry Cooling Tower
- 5.3.3. Hybrid Cooling Tower
- 5.4. Market Analysis, Insights and Forecast - by Region
- 5.4.1. North America
- 5.4.2. Europe
- 5.4.3. Asia Pacific
- 5.4.4. Middle East and Africa
- 5.4.5. South America
- 5.1. Market Analysis, Insights and Forecast - by Application
- 6. North America Cooling Tower Market Analysis, Insights and Forecast, 2019-2031
- 6.1. Market Analysis, Insights and Forecast - by Application
- 6.1.1. Oil Industry
- 6.1.2. HVACR
- 6.1.3. Chemical Industry
- 6.1.4. Power Generation
- 6.1.5. Others
- 6.2. Market Analysis, Insights and Forecast - by Flow Type
- 6.2.1. Cross Flow
- 6.2.2. Counter Flow
- 6.3. Market Analysis, Insights and Forecast - by Type
- 6.3.1. Evaporative Cooling Tower
- 6.3.2. Dry Cooling Tower
- 6.3.3. Hybrid Cooling Tower
- 6.1. Market Analysis, Insights and Forecast - by Application
- 7. Europe Cooling Tower Market Analysis, Insights and Forecast, 2019-2031
- 7.1. Market Analysis, Insights and Forecast - by Application
- 7.1.1. Oil Industry
- 7.1.2. HVACR
- 7.1.3. Chemical Industry
- 7.1.4. Power Generation
- 7.1.5. Others
- 7.2. Market Analysis, Insights and Forecast - by Flow Type
- 7.2.1. Cross Flow
- 7.2.2. Counter Flow
- 7.3. Market Analysis, Insights and Forecast - by Type
- 7.3.1. Evaporative Cooling Tower
- 7.3.2. Dry Cooling Tower
- 7.3.3. Hybrid Cooling Tower
- 7.1. Market Analysis, Insights and Forecast - by Application
- 8. Asia Pacific Cooling Tower Market Analysis, Insights and Forecast, 2019-2031
- 8.1. Market Analysis, Insights and Forecast - by Application
- 8.1.1. Oil Industry
- 8.1.2. HVACR
- 8.1.3. Chemical Industry
- 8.1.4. Power Generation
- 8.1.5. Others
- 8.2. Market Analysis, Insights and Forecast - by Flow Type
- 8.2.1. Cross Flow
- 8.2.2. Counter Flow
- 8.3. Market Analysis, Insights and Forecast - by Type
- 8.3.1. Evaporative Cooling Tower
- 8.3.2. Dry Cooling Tower
- 8.3.3. Hybrid Cooling Tower
- 8.1. Market Analysis, Insights and Forecast - by Application
- 9. Middle East and Africa Cooling Tower Market Analysis, Insights and Forecast, 2019-2031
- 9.1. Market Analysis, Insights and Forecast - by Application
- 9.1.1. Oil Industry
- 9.1.2. HVACR
- 9.1.3. Chemical Industry
- 9.1.4. Power Generation
- 9.1.5. Others
- 9.2. Market Analysis, Insights and Forecast - by Flow Type
- 9.2.1. Cross Flow
- 9.2.2. Counter Flow
- 9.3. Market Analysis, Insights and Forecast - by Type
- 9.3.1. Evaporative Cooling Tower
- 9.3.2. Dry Cooling Tower
- 9.3.3. Hybrid Cooling Tower
- 9.1. Market Analysis, Insights and Forecast - by Application
- 10. South America Cooling Tower Market Analysis, Insights and Forecast, 2019-2031
- 10.1. Market Analysis, Insights and Forecast - by Application
- 10.1.1. Oil Industry
- 10.1.2. HVACR
- 10.1.3. Chemical Industry
- 10.1.4. Power Generation
- 10.1.5. Others
- 10.2. Market Analysis, Insights and Forecast - by Flow Type
- 10.2.1. Cross Flow
- 10.2.2. Counter Flow
- 10.3. Market Analysis, Insights and Forecast - by Type
- 10.3.1. Evaporative Cooling Tower
- 10.3.2. Dry Cooling Tower
- 10.3.3. Hybrid Cooling Tower
- 10.1. Market Analysis, Insights and Forecast - by Application
- 11. North America Cooling Tower Market Analysis, Insights and Forecast, 2019-2031
- 11.1. Market Analysis, Insights and Forecast - By Country/Sub-region
- 11.1.1 United States
- 11.1.2 Canada
- 11.1.3 Mexico
- 12. Europe Cooling Tower Market Analysis, Insights and Forecast, 2019-2031
- 12.1. Market Analysis, Insights and Forecast - By Country/Sub-region
- 12.1.1 Germany
- 12.1.2 United Kingdom
- 12.1.3 France
- 12.1.4 Spain
- 12.1.5 Italy
- 12.1.6 Spain
- 12.1.7 Belgium
- 12.1.8 Netherland
- 12.1.9 Nordics
- 12.1.10 Rest of Europe
- 13. Asia Pacific Cooling Tower Market Analysis, Insights and Forecast, 2019-2031
- 13.1. Market Analysis, Insights and Forecast - By Country/Sub-region
- 13.1.1 China
- 13.1.2 Japan
- 13.1.3 India
- 13.1.4 South Korea
- 13.1.5 Southeast Asia
- 13.1.6 Australia
- 13.1.7 Indonesia
- 13.1.8 Phillipes
- 13.1.9 Singapore
- 13.1.10 Thailandc
- 13.1.11 Rest of Asia Pacific
- 14. South America Cooling Tower Market Analysis, Insights and Forecast, 2019-2031
- 14.1. Market Analysis, Insights and Forecast - By Country/Sub-region
- 14.1.1 Brazil
- 14.1.2 Argentina
- 14.1.3 Peru
- 14.1.4 Chile
- 14.1.5 Colombia
- 14.1.6 Ecuador
- 14.1.7 Venezuela
- 14.1.8 Rest of South America
- 15. North America Cooling Tower Market Analysis, Insights and Forecast, 2019-2031
- 15.1. Market Analysis, Insights and Forecast - By Country/Sub-region
- 15.1.1 United States
- 15.1.2 Canada
- 15.1.3 Mexico
- 16. MEA Cooling Tower Market Analysis, Insights and Forecast, 2019-2031
- 16.1. Market Analysis, Insights and Forecast - By Country/Sub-region
- 16.1.1 United Arab Emirates
- 16.1.2 Saudi Arabia
- 16.1.3 South Africa
- 16.1.4 Rest of Middle East and Africa
- 17. Competitive Analysis
- 17.1. Global Market Share Analysis 2024
- 17.2. Company Profiles
- 17.2.1 Brentwood Industries Inc
- 17.2.1.1. Overview
- 17.2.1.2. Products
- 17.2.1.3. SWOT Analysis
- 17.2.1.4. Recent Developments
- 17.2.1.5. Financials (Based on Availability)
- 17.2.2 Babcock and Wilcox Enterprises Inc
- 17.2.2.1. Overview
- 17.2.2.2. Products
- 17.2.2.3. SWOT Analysis
- 17.2.2.4. Recent Developments
- 17.2.2.5. Financials (Based on Availability)
- 17.2.3 Johnson Control
- 17.2.3.1. Overview
- 17.2.3.2. Products
- 17.2.3.3. SWOT Analysis
- 17.2.3.4. Recent Developments
- 17.2.3.5. Financials (Based on Availability)
- 17.2.4 Evapco Inc
- 17.2.4.1. Overview
- 17.2.4.2. Products
- 17.2.4.3. SWOT Analysis
- 17.2.4.4. Recent Developments
- 17.2.4.5. Financials (Based on Availability)
- 17.2.5 Baltimore Aircoil Company Inc
- 17.2.5.1. Overview
- 17.2.5.2. Products
- 17.2.5.3. SWOT Analysis
- 17.2.5.4. Recent Developments
- 17.2.5.5. Financials (Based on Availability)
- 17.2.6 Artech Cooling Towers Pvt Ltd
- 17.2.6.1. Overview
- 17.2.6.2. Products
- 17.2.6.3. SWOT Analysis
- 17.2.6.4. Recent Developments
- 17.2.6.5. Financials (Based on Availability)
- 17.2.7 SPX Cooling Tech LLC
- 17.2.7.1. Overview
- 17.2.7.2. Products
- 17.2.7.3. SWOT Analysis
- 17.2.7.4. Recent Developments
- 17.2.7.5. Financials (Based on Availability)
- 17.2.8 Hamon and CIE
- 17.2.8.1. Overview
- 17.2.8.2. Products
- 17.2.8.3. SWOT Analysis
- 17.2.8.4. Recent Developments
- 17.2.8.5. Financials (Based on Availability)
- 17.2.9 Thermax Limited*List Not Exhaustive
- 17.2.9.1. Overview
- 17.2.9.2. Products
- 17.2.9.3. SWOT Analysis
- 17.2.9.4. Recent Developments
- 17.2.9.5. Financials (Based on Availability)
- 17.2.10 Enexio Management Gmbh
- 17.2.10.1. Overview
- 17.2.10.2. Products
- 17.2.10.3. SWOT Analysis
- 17.2.10.4. Recent Developments
- 17.2.10.5. Financials (Based on Availability)
- 17.2.1 Brentwood Industries Inc
List of Figures
- Figure 1: Global Cooling Tower Market Revenue Breakdown (Million, %) by Region 2024 & 2032
- Figure 2: Global Cooling Tower Market Volume Breakdown (K Unit, %) by Region 2024 & 2032
- Figure 3: North America Cooling Tower Market Revenue (Million), by Country 2024 & 2032
- Figure 4: North America Cooling Tower Market Volume (K Unit), by Country 2024 & 2032
- Figure 5: North America Cooling Tower Market Revenue Share (%), by Country 2024 & 2032
- Figure 6: North America Cooling Tower Market Volume Share (%), by Country 2024 & 2032
- Figure 7: Europe Cooling Tower Market Revenue (Million), by Country 2024 & 2032
- Figure 8: Europe Cooling Tower Market Volume (K Unit), by Country 2024 & 2032
- Figure 9: Europe Cooling Tower Market Revenue Share (%), by Country 2024 & 2032
- Figure 10: Europe Cooling Tower Market Volume Share (%), by Country 2024 & 2032
- Figure 11: Asia Pacific Cooling Tower Market Revenue (Million), by Country 2024 & 2032
- Figure 12: Asia Pacific Cooling Tower Market Volume (K Unit), by Country 2024 & 2032
- Figure 13: Asia Pacific Cooling Tower Market Revenue Share (%), by Country 2024 & 2032
- Figure 14: Asia Pacific Cooling Tower Market Volume Share (%), by Country 2024 & 2032
- Figure 15: South America Cooling Tower Market Revenue (Million), by Country 2024 & 2032
- Figure 16: South America Cooling Tower Market Volume (K Unit), by Country 2024 & 2032
- Figure 17: South America Cooling Tower Market Revenue Share (%), by Country 2024 & 2032
- Figure 18: South America Cooling Tower Market Volume Share (%), by Country 2024 & 2032
- Figure 19: North America Cooling Tower Market Revenue (Million), by Country 2024 & 2032
- Figure 20: North America Cooling Tower Market Volume (K Unit), by Country 2024 & 2032
- Figure 21: North America Cooling Tower Market Revenue Share (%), by Country 2024 & 2032
- Figure 22: North America Cooling Tower Market Volume Share (%), by Country 2024 & 2032
- Figure 23: MEA Cooling Tower Market Revenue (Million), by Country 2024 & 2032
- Figure 24: MEA Cooling Tower Market Volume (K Unit), by Country 2024 & 2032
- Figure 25: MEA Cooling Tower Market Revenue Share (%), by Country 2024 & 2032
- Figure 26: MEA Cooling Tower Market Volume Share (%), by Country 2024 & 2032
- Figure 27: North America Cooling Tower Market Revenue (Million), by Application 2024 & 2032
- Figure 28: North America Cooling Tower Market Volume (K Unit), by Application 2024 & 2032
- Figure 29: North America Cooling Tower Market Revenue Share (%), by Application 2024 & 2032
- Figure 30: North America Cooling Tower Market Volume Share (%), by Application 2024 & 2032
- Figure 31: North America Cooling Tower Market Revenue (Million), by Flow Type 2024 & 2032
- Figure 32: North America Cooling Tower Market Volume (K Unit), by Flow Type 2024 & 2032
- Figure 33: North America Cooling Tower Market Revenue Share (%), by Flow Type 2024 & 2032
- Figure 34: North America Cooling Tower Market Volume Share (%), by Flow Type 2024 & 2032
- Figure 35: North America Cooling Tower Market Revenue (Million), by Type 2024 & 2032
- Figure 36: North America Cooling Tower Market Volume (K Unit), by Type 2024 & 2032
- Figure 37: North America Cooling Tower Market Revenue Share (%), by Type 2024 & 2032
- Figure 38: North America Cooling Tower Market Volume Share (%), by Type 2024 & 2032
- Figure 39: North America Cooling Tower Market Revenue (Million), by Country 2024 & 2032
- Figure 40: North America Cooling Tower Market Volume (K Unit), by Country 2024 & 2032
- Figure 41: North America Cooling Tower Market Revenue Share (%), by Country 2024 & 2032
- Figure 42: North America Cooling Tower Market Volume Share (%), by Country 2024 & 2032
- Figure 43: Europe Cooling Tower Market Revenue (Million), by Application 2024 & 2032
- Figure 44: Europe Cooling Tower Market Volume (K Unit), by Application 2024 & 2032
- Figure 45: Europe Cooling Tower Market Revenue Share (%), by Application 2024 & 2032
- Figure 46: Europe Cooling Tower Market Volume Share (%), by Application 2024 & 2032
- Figure 47: Europe Cooling Tower Market Revenue (Million), by Flow Type 2024 & 2032
- Figure 48: Europe Cooling Tower Market Volume (K Unit), by Flow Type 2024 & 2032
- Figure 49: Europe Cooling Tower Market Revenue Share (%), by Flow Type 2024 & 2032
- Figure 50: Europe Cooling Tower Market Volume Share (%), by Flow Type 2024 & 2032
- Figure 51: Europe Cooling Tower Market Revenue (Million), by Type 2024 & 2032
- Figure 52: Europe Cooling Tower Market Volume (K Unit), by Type 2024 & 2032
- Figure 53: Europe Cooling Tower Market Revenue Share (%), by Type 2024 & 2032
- Figure 54: Europe Cooling Tower Market Volume Share (%), by Type 2024 & 2032
- Figure 55: Europe Cooling Tower Market Revenue (Million), by Country 2024 & 2032
- Figure 56: Europe Cooling Tower Market Volume (K Unit), by Country 2024 & 2032
- Figure 57: Europe Cooling Tower Market Revenue Share (%), by Country 2024 & 2032
- Figure 58: Europe Cooling Tower Market Volume Share (%), by Country 2024 & 2032
- Figure 59: Asia Pacific Cooling Tower Market Revenue (Million), by Application 2024 & 2032
- Figure 60: Asia Pacific Cooling Tower Market Volume (K Unit), by Application 2024 & 2032
- Figure 61: Asia Pacific Cooling Tower Market Revenue Share (%), by Application 2024 & 2032
- Figure 62: Asia Pacific Cooling Tower Market Volume Share (%), by Application 2024 & 2032
- Figure 63: Asia Pacific Cooling Tower Market Revenue (Million), by Flow Type 2024 & 2032
- Figure 64: Asia Pacific Cooling Tower Market Volume (K Unit), by Flow Type 2024 & 2032
- Figure 65: Asia Pacific Cooling Tower Market Revenue Share (%), by Flow Type 2024 & 2032
- Figure 66: Asia Pacific Cooling Tower Market Volume Share (%), by Flow Type 2024 & 2032
- Figure 67: Asia Pacific Cooling Tower Market Revenue (Million), by Type 2024 & 2032
- Figure 68: Asia Pacific Cooling Tower Market Volume (K Unit), by Type 2024 & 2032
- Figure 69: Asia Pacific Cooling Tower Market Revenue Share (%), by Type 2024 & 2032
- Figure 70: Asia Pacific Cooling Tower Market Volume Share (%), by Type 2024 & 2032
- Figure 71: Asia Pacific Cooling Tower Market Revenue (Million), by Country 2024 & 2032
- Figure 72: Asia Pacific Cooling Tower Market Volume (K Unit), by Country 2024 & 2032
- Figure 73: Asia Pacific Cooling Tower Market Revenue Share (%), by Country 2024 & 2032
- Figure 74: Asia Pacific Cooling Tower Market Volume Share (%), by Country 2024 & 2032
- Figure 75: Middle East and Africa Cooling Tower Market Revenue (Million), by Application 2024 & 2032
- Figure 76: Middle East and Africa Cooling Tower Market Volume (K Unit), by Application 2024 & 2032
- Figure 77: Middle East and Africa Cooling Tower Market Revenue Share (%), by Application 2024 & 2032
- Figure 78: Middle East and Africa Cooling Tower Market Volume Share (%), by Application 2024 & 2032
- Figure 79: Middle East and Africa Cooling Tower Market Revenue (Million), by Flow Type 2024 & 2032
- Figure 80: Middle East and Africa Cooling Tower Market Volume (K Unit), by Flow Type 2024 & 2032
- Figure 81: Middle East and Africa Cooling Tower Market Revenue Share (%), by Flow Type 2024 & 2032
- Figure 82: Middle East and Africa Cooling Tower Market Volume Share (%), by Flow Type 2024 & 2032
- Figure 83: Middle East and Africa Cooling Tower Market Revenue (Million), by Type 2024 & 2032
- Figure 84: Middle East and Africa Cooling Tower Market Volume (K Unit), by Type 2024 & 2032
- Figure 85: Middle East and Africa Cooling Tower Market Revenue Share (%), by Type 2024 & 2032
- Figure 86: Middle East and Africa Cooling Tower Market Volume Share (%), by Type 2024 & 2032
- Figure 87: Middle East and Africa Cooling Tower Market Revenue (Million), by Country 2024 & 2032
- Figure 88: Middle East and Africa Cooling Tower Market Volume (K Unit), by Country 2024 & 2032
- Figure 89: Middle East and Africa Cooling Tower Market Revenue Share (%), by Country 2024 & 2032
- Figure 90: Middle East and Africa Cooling Tower Market Volume Share (%), by Country 2024 & 2032
- Figure 91: South America Cooling Tower Market Revenue (Million), by Application 2024 & 2032
- Figure 92: South America Cooling Tower Market Volume (K Unit), by Application 2024 & 2032
- Figure 93: South America Cooling Tower Market Revenue Share (%), by Application 2024 & 2032
- Figure 94: South America Cooling Tower Market Volume Share (%), by Application 2024 & 2032
- Figure 95: South America Cooling Tower Market Revenue (Million), by Flow Type 2024 & 2032
- Figure 96: South America Cooling Tower Market Volume (K Unit), by Flow Type 2024 & 2032
- Figure 97: South America Cooling Tower Market Revenue Share (%), by Flow Type 2024 & 2032
- Figure 98: South America Cooling Tower Market Volume Share (%), by Flow Type 2024 & 2032
- Figure 99: South America Cooling Tower Market Revenue (Million), by Type 2024 & 2032
- Figure 100: South America Cooling Tower Market Volume (K Unit), by Type 2024 & 2032
- Figure 101: South America Cooling Tower Market Revenue Share (%), by Type 2024 & 2032
- Figure 102: South America Cooling Tower Market Volume Share (%), by Type 2024 & 2032
- Figure 103: South America Cooling Tower Market Revenue (Million), by Country 2024 & 2032
- Figure 104: South America Cooling Tower Market Volume (K Unit), by Country 2024 & 2032
- Figure 105: South America Cooling Tower Market Revenue Share (%), by Country 2024 & 2032
- Figure 106: South America Cooling Tower Market Volume Share (%), by Country 2024 & 2032
List of Tables
- Table 1: Global Cooling Tower Market Revenue Million Forecast, by Region 2019 & 2032
- Table 2: Global Cooling Tower Market Volume K Unit Forecast, by Region 2019 & 2032
- Table 3: Global Cooling Tower Market Revenue Million Forecast, by Application 2019 & 2032
- Table 4: Global Cooling Tower Market Volume K Unit Forecast, by Application 2019 & 2032
- Table 5: Global Cooling Tower Market Revenue Million Forecast, by Flow Type 2019 & 2032
- Table 6: Global Cooling Tower Market Volume K Unit Forecast, by Flow Type 2019 & 2032
- Table 7: Global Cooling Tower Market Revenue Million Forecast, by Type 2019 & 2032
- Table 8: Global Cooling Tower Market Volume K Unit Forecast, by Type 2019 & 2032
- Table 9: Global Cooling Tower Market Revenue Million Forecast, by Region 2019 & 2032
- Table 10: Global Cooling Tower Market Volume K Unit Forecast, by Region 2019 & 2032
- Table 11: Global Cooling Tower Market Revenue Million Forecast, by Country 2019 & 2032
- Table 12: Global Cooling Tower Market Volume K Unit Forecast, by Country 2019 & 2032
- Table 13: United States Cooling Tower Market Revenue (Million) Forecast, by Application 2019 & 2032
- Table 14: United States Cooling Tower Market Volume (K Unit) Forecast, by Application 2019 & 2032
- Table 15: Canada Cooling Tower Market Revenue (Million) Forecast, by Application 2019 & 2032
- Table 16: Canada Cooling Tower Market Volume (K Unit) Forecast, by Application 2019 & 2032
- Table 17: Mexico Cooling Tower Market Revenue (Million) Forecast, by Application 2019 & 2032
- Table 18: Mexico Cooling Tower Market Volume (K Unit) Forecast, by Application 2019 & 2032
- Table 19: Global Cooling Tower Market Revenue Million Forecast, by Country 2019 & 2032
- Table 20: Global Cooling Tower Market Volume K Unit Forecast, by Country 2019 & 2032
- Table 21: Germany Cooling Tower Market Revenue (Million) Forecast, by Application 2019 & 2032
- Table 22: Germany Cooling Tower Market Volume (K Unit) Forecast, by Application 2019 & 2032
- Table 23: United Kingdom Cooling Tower Market Revenue (Million) Forecast, by Application 2019 & 2032
- Table 24: United Kingdom Cooling Tower Market Volume (K Unit) Forecast, by Application 2019 & 2032
- Table 25: France Cooling Tower Market Revenue (Million) Forecast, by Application 2019 & 2032
- Table 26: France Cooling Tower Market Volume (K Unit) Forecast, by Application 2019 & 2032
- Table 27: Spain Cooling Tower Market Revenue (Million) Forecast, by Application 2019 & 2032
- Table 28: Spain Cooling Tower Market Volume (K Unit) Forecast, by Application 2019 & 2032
- Table 29: Italy Cooling Tower Market Revenue (Million) Forecast, by Application 2019 & 2032
- Table 30: Italy Cooling Tower Market Volume (K Unit) Forecast, by Application 2019 & 2032
- Table 31: Spain Cooling Tower Market Revenue (Million) Forecast, by Application 2019 & 2032
- Table 32: Spain Cooling Tower Market Volume (K Unit) Forecast, by Application 2019 & 2032
- Table 33: Belgium Cooling Tower Market Revenue (Million) Forecast, by Application 2019 & 2032
- Table 34: Belgium Cooling Tower Market Volume (K Unit) Forecast, by Application 2019 & 2032
- Table 35: Netherland Cooling Tower Market Revenue (Million) Forecast, by Application 2019 & 2032
- Table 36: Netherland Cooling Tower Market Volume (K Unit) Forecast, by Application 2019 & 2032
- Table 37: Nordics Cooling Tower Market Revenue (Million) Forecast, by Application 2019 & 2032
- Table 38: Nordics Cooling Tower Market Volume (K Unit) Forecast, by Application 2019 & 2032
- Table 39: Rest of Europe Cooling Tower Market Revenue (Million) Forecast, by Application 2019 & 2032
- Table 40: Rest of Europe Cooling Tower Market Volume (K Unit) Forecast, by Application 2019 & 2032
- Table 41: Global Cooling Tower Market Revenue Million Forecast, by Country 2019 & 2032
- Table 42: Global Cooling Tower Market Volume K Unit Forecast, by Country 2019 & 2032
- Table 43: China Cooling Tower Market Revenue (Million) Forecast, by Application 2019 & 2032
- Table 44: China Cooling Tower Market Volume (K Unit) Forecast, by Application 2019 & 2032
- Table 45: Japan Cooling Tower Market Revenue (Million) Forecast, by Application 2019 & 2032
- Table 46: Japan Cooling Tower Market Volume (K Unit) Forecast, by Application 2019 & 2032
- Table 47: India Cooling Tower Market Revenue (Million) Forecast, by Application 2019 & 2032
- Table 48: India Cooling Tower Market Volume (K Unit) Forecast, by Application 2019 & 2032
- Table 49: South Korea Cooling Tower Market Revenue (Million) Forecast, by Application 2019 & 2032
- Table 50: South Korea Cooling Tower Market Volume (K Unit) Forecast, by Application 2019 & 2032
- Table 51: Southeast Asia Cooling Tower Market Revenue (Million) Forecast, by Application 2019 & 2032
- Table 52: Southeast Asia Cooling Tower Market Volume (K Unit) Forecast, by Application 2019 & 2032
- Table 53: Australia Cooling Tower Market Revenue (Million) Forecast, by Application 2019 & 2032
- Table 54: Australia Cooling Tower Market Volume (K Unit) Forecast, by Application 2019 & 2032
- Table 55: Indonesia Cooling Tower Market Revenue (Million) Forecast, by Application 2019 & 2032
- Table 56: Indonesia Cooling Tower Market Volume (K Unit) Forecast, by Application 2019 & 2032
- Table 57: Phillipes Cooling Tower Market Revenue (Million) Forecast, by Application 2019 & 2032
- Table 58: Phillipes Cooling Tower Market Volume (K Unit) Forecast, by Application 2019 & 2032
- Table 59: Singapore Cooling Tower Market Revenue (Million) Forecast, by Application 2019 & 2032
- Table 60: Singapore Cooling Tower Market Volume (K Unit) Forecast, by Application 2019 & 2032
- Table 61: Thailandc Cooling Tower Market Revenue (Million) Forecast, by Application 2019 & 2032
- Table 62: Thailandc Cooling Tower Market Volume (K Unit) Forecast, by Application 2019 & 2032
- Table 63: Rest of Asia Pacific Cooling Tower Market Revenue (Million) Forecast, by Application 2019 & 2032
- Table 64: Rest of Asia Pacific Cooling Tower Market Volume (K Unit) Forecast, by Application 2019 & 2032
- Table 65: Global Cooling Tower Market Revenue Million Forecast, by Country 2019 & 2032
- Table 66: Global Cooling Tower Market Volume K Unit Forecast, by Country 2019 & 2032
- Table 67: Brazil Cooling Tower Market Revenue (Million) Forecast, by Application 2019 & 2032
- Table 68: Brazil Cooling Tower Market Volume (K Unit) Forecast, by Application 2019 & 2032
- Table 69: Argentina Cooling Tower Market Revenue (Million) Forecast, by Application 2019 & 2032
- Table 70: Argentina Cooling Tower Market Volume (K Unit) Forecast, by Application 2019 & 2032
- Table 71: Peru Cooling Tower Market Revenue (Million) Forecast, by Application 2019 & 2032
- Table 72: Peru Cooling Tower Market Volume (K Unit) Forecast, by Application 2019 & 2032
- Table 73: Chile Cooling Tower Market Revenue (Million) Forecast, by Application 2019 & 2032
- Table 74: Chile Cooling Tower Market Volume (K Unit) Forecast, by Application 2019 & 2032
- Table 75: Colombia Cooling Tower Market Revenue (Million) Forecast, by Application 2019 & 2032
- Table 76: Colombia Cooling Tower Market Volume (K Unit) Forecast, by Application 2019 & 2032
- Table 77: Ecuador Cooling Tower Market Revenue (Million) Forecast, by Application 2019 & 2032
- Table 78: Ecuador Cooling Tower Market Volume (K Unit) Forecast, by Application 2019 & 2032
- Table 79: Venezuela Cooling Tower Market Revenue (Million) Forecast, by Application 2019 & 2032
- Table 80: Venezuela Cooling Tower Market Volume (K Unit) Forecast, by Application 2019 & 2032
- Table 81: Rest of South America Cooling Tower Market Revenue (Million) Forecast, by Application 2019 & 2032
- Table 82: Rest of South America Cooling Tower Market Volume (K Unit) Forecast, by Application 2019 & 2032
- Table 83: Global Cooling Tower Market Revenue Million Forecast, by Country 2019 & 2032
- Table 84: Global Cooling Tower Market Volume K Unit Forecast, by Country 2019 & 2032
- Table 85: United States Cooling Tower Market Revenue (Million) Forecast, by Application 2019 & 2032
- Table 86: United States Cooling Tower Market Volume (K Unit) Forecast, by Application 2019 & 2032
- Table 87: Canada Cooling Tower Market Revenue (Million) Forecast, by Application 2019 & 2032
- Table 88: Canada Cooling Tower Market Volume (K Unit) Forecast, by Application 2019 & 2032
- Table 89: Mexico Cooling Tower Market Revenue (Million) Forecast, by Application 2019 & 2032
- Table 90: Mexico Cooling Tower Market Volume (K Unit) Forecast, by Application 2019 & 2032
- Table 91: Global Cooling Tower Market Revenue Million Forecast, by Country 2019 & 2032
- Table 92: Global Cooling Tower Market Volume K Unit Forecast, by Country 2019 & 2032
- Table 93: United Arab Emirates Cooling Tower Market Revenue (Million) Forecast, by Application 2019 & 2032
- Table 94: United Arab Emirates Cooling Tower Market Volume (K Unit) Forecast, by Application 2019 & 2032
- Table 95: Saudi Arabia Cooling Tower Market Revenue (Million) Forecast, by Application 2019 & 2032
- Table 96: Saudi Arabia Cooling Tower Market Volume (K Unit) Forecast, by Application 2019 & 2032
- Table 97: South Africa Cooling Tower Market Revenue (Million) Forecast, by Application 2019 & 2032
- Table 98: South Africa Cooling Tower Market Volume (K Unit) Forecast, by Application 2019 & 2032
- Table 99: Rest of Middle East and Africa Cooling Tower Market Revenue (Million) Forecast, by Application 2019 & 2032
- Table 100: Rest of Middle East and Africa Cooling Tower Market Volume (K Unit) Forecast, by Application 2019 & 2032
- Table 101: Global Cooling Tower Market Revenue Million Forecast, by Application 2019 & 2032
- Table 102: Global Cooling Tower Market Volume K Unit Forecast, by Application 2019 & 2032
- Table 103: Global Cooling Tower Market Revenue Million Forecast, by Flow Type 2019 & 2032
- Table 104: Global Cooling Tower Market Volume K Unit Forecast, by Flow Type 2019 & 2032
- Table 105: Global Cooling Tower Market Revenue Million Forecast, by Type 2019 & 2032
- Table 106: Global Cooling Tower Market Volume K Unit Forecast, by Type 2019 & 2032
- Table 107: Global Cooling Tower Market Revenue Million Forecast, by Country 2019 & 2032
- Table 108: Global Cooling Tower Market Volume K Unit Forecast, by Country 2019 & 2032
- Table 109: United States Cooling Tower Market Revenue (Million) Forecast, by Application 2019 & 2032
- Table 110: United States Cooling Tower Market Volume (K Unit) Forecast, by Application 2019 & 2032
- Table 111: Canada Cooling Tower Market Revenue (Million) Forecast, by Application 2019 & 2032
- Table 112: Canada Cooling Tower Market Volume (K Unit) Forecast, by Application 2019 & 2032
- Table 113: Rest of North America Cooling Tower Market Revenue (Million) Forecast, by Application 2019 & 2032
- Table 114: Rest of North America Cooling Tower Market Volume (K Unit) Forecast, by Application 2019 & 2032
- Table 115: Global Cooling Tower Market Revenue Million Forecast, by Application 2019 & 2032
- Table 116: Global Cooling Tower Market Volume K Unit Forecast, by Application 2019 & 2032
- Table 117: Global Cooling Tower Market Revenue Million Forecast, by Flow Type 2019 & 2032
- Table 118: Global Cooling Tower Market Volume K Unit Forecast, by Flow Type 2019 & 2032
- Table 119: Global Cooling Tower Market Revenue Million Forecast, by Type 2019 & 2032
- Table 120: Global Cooling Tower Market Volume K Unit Forecast, by Type 2019 & 2032
- Table 121: Global Cooling Tower Market Revenue Million Forecast, by Country 2019 & 2032
- Table 122: Global Cooling Tower Market Volume K Unit Forecast, by Country 2019 & 2032
- Table 123: Germany Cooling Tower Market Revenue (Million) Forecast, by Application 2019 & 2032
- Table 124: Germany Cooling Tower Market Volume (K Unit) Forecast, by Application 2019 & 2032
- Table 125: France Cooling Tower Market Revenue (Million) Forecast, by Application 2019 & 2032
- Table 126: France Cooling Tower Market Volume (K Unit) Forecast, by Application 2019 & 2032
- Table 127: United Kingdom Cooling Tower Market Revenue (Million) Forecast, by Application 2019 & 2032
- Table 128: United Kingdom Cooling Tower Market Volume (K Unit) Forecast, by Application 2019 & 2032
- Table 129: Russia Cooling Tower Market Revenue (Million) Forecast, by Application 2019 & 2032
- Table 130: Russia Cooling Tower Market Volume (K Unit) Forecast, by Application 2019 & 2032
- Table 131: Rest of Europe Cooling Tower Market Revenue (Million) Forecast, by Application 2019 & 2032
- Table 132: Rest of Europe Cooling Tower Market Volume (K Unit) Forecast, by Application 2019 & 2032
- Table 133: Global Cooling Tower Market Revenue Million Forecast, by Application 2019 & 2032
- Table 134: Global Cooling Tower Market Volume K Unit Forecast, by Application 2019 & 2032
- Table 135: Global Cooling Tower Market Revenue Million Forecast, by Flow Type 2019 & 2032
- Table 136: Global Cooling Tower Market Volume K Unit Forecast, by Flow Type 2019 & 2032
- Table 137: Global Cooling Tower Market Revenue Million Forecast, by Type 2019 & 2032
- Table 138: Global Cooling Tower Market Volume K Unit Forecast, by Type 2019 & 2032
- Table 139: Global Cooling Tower Market Revenue Million Forecast, by Country 2019 & 2032
- Table 140: Global Cooling Tower Market Volume K Unit Forecast, by Country 2019 & 2032
- Table 141: China Cooling Tower Market Revenue (Million) Forecast, by Application 2019 & 2032
- Table 142: China Cooling Tower Market Volume (K Unit) Forecast, by Application 2019 & 2032
- Table 143: India Cooling Tower Market Revenue (Million) Forecast, by Application 2019 & 2032
- Table 144: India Cooling Tower Market Volume (K Unit) Forecast, by Application 2019 & 2032
- Table 145: Australia Cooling Tower Market Revenue (Million) Forecast, by Application 2019 & 2032
- Table 146: Australia Cooling Tower Market Volume (K Unit) Forecast, by Application 2019 & 2032
- Table 147: Malaysia Cooling Tower Market Revenue (Million) Forecast, by Application 2019 & 2032
- Table 148: Malaysia Cooling Tower Market Volume (K Unit) Forecast, by Application 2019 & 2032
- Table 149: Rest of Asia Pacific Cooling Tower Market Revenue (Million) Forecast, by Application 2019 & 2032
- Table 150: Rest of Asia Pacific Cooling Tower Market Volume (K Unit) Forecast, by Application 2019 & 2032
- Table 151: Global Cooling Tower Market Revenue Million Forecast, by Application 2019 & 2032
- Table 152: Global Cooling Tower Market Volume K Unit Forecast, by Application 2019 & 2032
- Table 153: Global Cooling Tower Market Revenue Million Forecast, by Flow Type 2019 & 2032
- Table 154: Global Cooling Tower Market Volume K Unit Forecast, by Flow Type 2019 & 2032
- Table 155: Global Cooling Tower Market Revenue Million Forecast, by Type 2019 & 2032
- Table 156: Global Cooling Tower Market Volume K Unit Forecast, by Type 2019 & 2032
- Table 157: Global Cooling Tower Market Revenue Million Forecast, by Country 2019 & 2032
- Table 158: Global Cooling Tower Market Volume K Unit Forecast, by Country 2019 & 2032
- Table 159: Saudi Arabia Cooling Tower Market Revenue (Million) Forecast, by Application 2019 & 2032
- Table 160: Saudi Arabia Cooling Tower Market Volume (K Unit) Forecast, by Application 2019 & 2032
- Table 161: United Arab Emirates Cooling Tower Market Revenue (Million) Forecast, by Application 2019 & 2032
- Table 162: United Arab Emirates Cooling Tower Market Volume (K Unit) Forecast, by Application 2019 & 2032
- Table 163: Nigeria Cooling Tower Market Revenue (Million) Forecast, by Application 2019 & 2032
- Table 164: Nigeria Cooling Tower Market Volume (K Unit) Forecast, by Application 2019 & 2032
- Table 165: Rest of Middle East and Africa Cooling Tower Market Revenue (Million) Forecast, by Application 2019 & 2032
- Table 166: Rest of Middle East and Africa Cooling Tower Market Volume (K Unit) Forecast, by Application 2019 & 2032
- Table 167: Global Cooling Tower Market Revenue Million Forecast, by Application 2019 & 2032
- Table 168: Global Cooling Tower Market Volume K Unit Forecast, by Application 2019 & 2032
- Table 169: Global Cooling Tower Market Revenue Million Forecast, by Flow Type 2019 & 2032
- Table 170: Global Cooling Tower Market Volume K Unit Forecast, by Flow Type 2019 & 2032
- Table 171: Global Cooling Tower Market Revenue Million Forecast, by Type 2019 & 2032
- Table 172: Global Cooling Tower Market Volume K Unit Forecast, by Type 2019 & 2032
- Table 173: Global Cooling Tower Market Revenue Million Forecast, by Country 2019 & 2032
- Table 174: Global Cooling Tower Market Volume K Unit Forecast, by Country 2019 & 2032
- Table 175: Brazil Cooling Tower Market Revenue (Million) Forecast, by Application 2019 & 2032
- Table 176: Brazil Cooling Tower Market Volume (K Unit) Forecast, by Application 2019 & 2032
- Table 177: Argentina Cooling Tower Market Revenue (Million) Forecast, by Application 2019 & 2032
- Table 178: Argentina Cooling Tower Market Volume (K Unit) Forecast, by Application 2019 & 2032
- Table 179: Columbia Cooling Tower Market Revenue (Million) Forecast, by Application 2019 & 2032
- Table 180: Columbia Cooling Tower Market Volume (K Unit) Forecast, by Application 2019 & 2032
- Table 181: Rest of South America Cooling Tower Market Revenue (Million) Forecast, by Application 2019 & 2032
- Table 182: Rest of South America Cooling Tower Market Volume (K Unit) Forecast, by Application 2019 & 2032
Frequently Asked Questions
1. What is the projected Compound Annual Growth Rate (CAGR) of the Cooling Tower Market?
The projected CAGR is approximately 5.00%.
2. Which companies are prominent players in the Cooling Tower Market?
Key companies in the market include Brentwood Industries Inc, Babcock and Wilcox Enterprises Inc, Johnson Control, Evapco Inc, Baltimore Aircoil Company Inc, Artech Cooling Towers Pvt Ltd, SPX Cooling Tech LLC, Hamon and CIE, Thermax Limited*List Not Exhaustive, Enexio Management Gmbh.
3. What are the main segments of the Cooling Tower Market?
The market segments include Application, Flow Type, Type.
4. Can you provide details about the market size?
The market size is estimated to be USD XX Million as of 2022.
5. What are some drivers contributing to market growth?
4.; Falling Costs of Green And Blue Hydrogen Generation4.; Rising Demand from The Automotive Sector.
6. What are the notable trends driving market growth?
Power Generation Expected to Witness Growth.
7. Are there any restraints impacting market growth?
4.; Competition for Alternative Energy Source.
8. Can you provide examples of recent developments in the market?
In February 2023, Baltimore Aircoil Company (BAC) revealed its new TrilliumSeries Adiabatic Cooler. This adiabatic cooling Tower is ideal for energy efficiency and limited water use applications. The design maximizes both water and energy efficiency, ultimately minimizing costs. In addition, the TrilliumSeries Cooler is designed to make installation and ongoing maintenance simple.
9. What pricing options are available for accessing the report?
Pricing options include single-user, multi-user, and enterprise licenses priced at USD 4750, USD 5250, and USD 8750 respectively.
10. Is the market size provided in terms of value or volume?
The market size is provided in terms of value, measured in Million and volume, measured in K Unit.
11. Are there any specific market keywords associated with the report?
Yes, the market keyword associated with the report is "Cooling Tower Market," which aids in identifying and referencing the specific market segment covered.
12. How do I determine which pricing option suits my needs best?
The pricing options vary based on user requirements and access needs. Individual users may opt for single-user licenses, while businesses requiring broader access may choose multi-user or enterprise licenses for cost-effective access to the report.
13. Are there any additional resources or data provided in the Cooling Tower Market report?
While the report offers comprehensive insights, it's advisable to review the specific contents or supplementary materials provided to ascertain if additional resources or data are available.
14. How can I stay updated on further developments or reports in the Cooling Tower Market?
To stay informed about further developments, trends, and reports in the Cooling Tower Market, consider subscribing to industry newsletters, following relevant companies and organizations, or regularly checking reputable industry news sources and publications.
Methodology
Step 1 - Identification of Relevant Samples Size from Population Database


Step 2 - Approaches for Defining Global Market Size (Value, Volume* & Price*)

Note*: In applicable scenarios
Step 3 - Data Sources
Primary Research
- Web Analytics
- Survey Reports
- Research Institute
- Latest Research Reports
- Opinion Leaders
Secondary Research
- Annual Reports
- White Paper
- Latest Press Release
- Industry Association
- Paid Database
- Investor Presentations

Step 4 - Data Triangulation
Involves using different sources of information in order to increase the validity of a study
These sources are likely to be stakeholders in a program - participants, other researchers, program staff, other community members, and so on.
Then we put all data in single framework & apply various statistical tools to find out the dynamic on the market.
During the analysis stage, feedback from the stakeholder groups would be compared to determine areas of agreement as well as areas of divergence


