
Key Insights
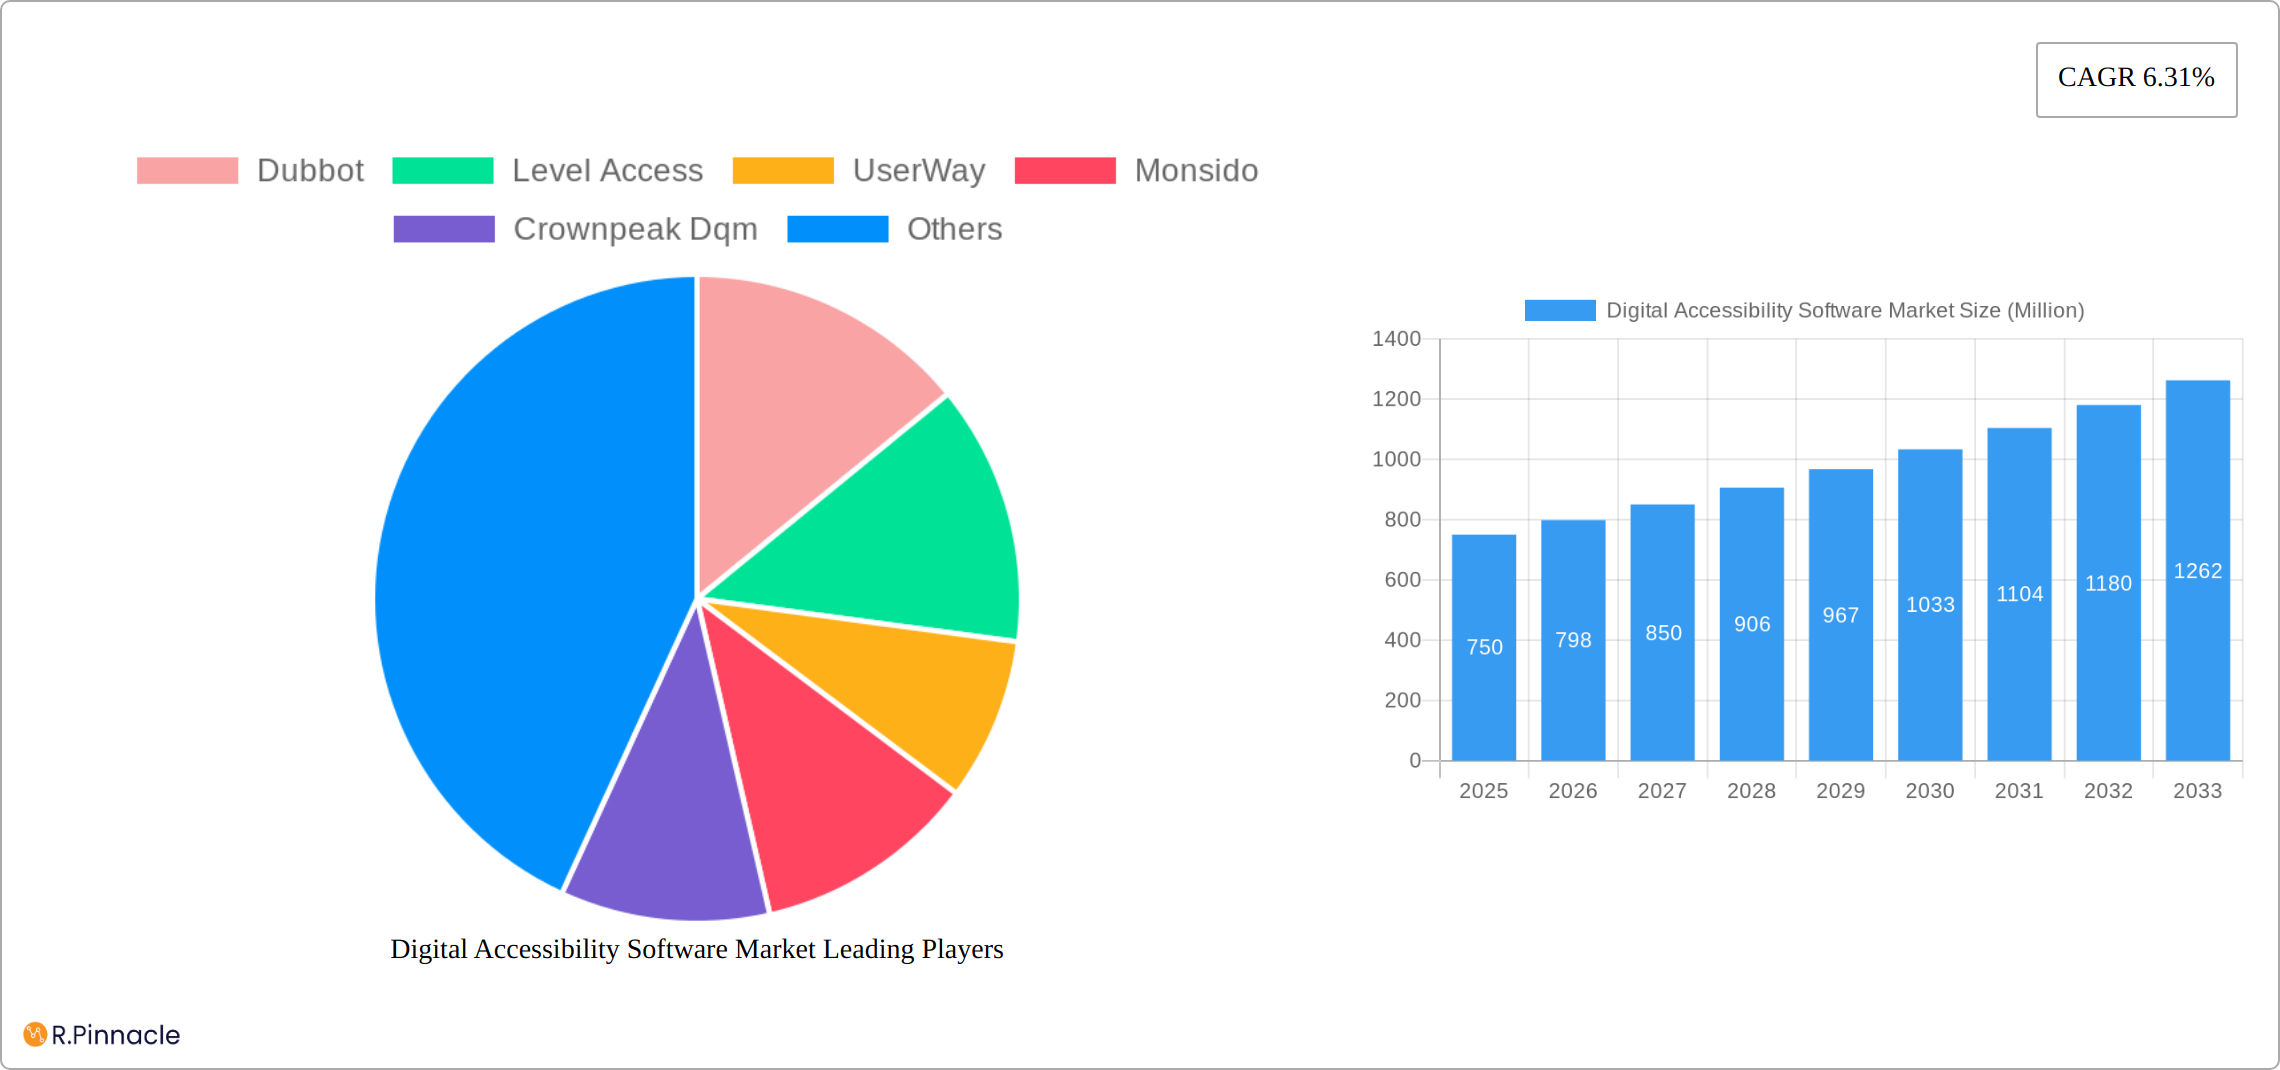
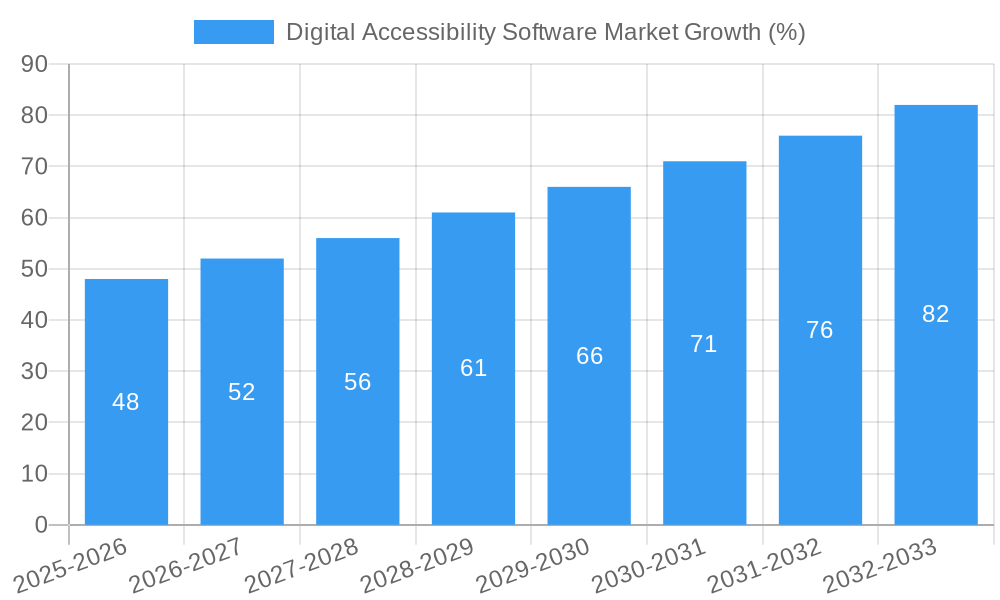
The Digital Accessibility Software market, currently valued at $750 million (estimated based on a 0.75 market size unit of millions in 2025), is experiencing robust growth, projected to expand at a Compound Annual Growth Rate (CAGR) of 6.31% from 2025 to 2033. This growth is fueled by several key factors. Increasing awareness and stringent regulatory compliance mandates, such as the Americans with Disabilities Act (ADA) and the Web Content Accessibility Guidelines (WCAG), are driving widespread adoption of accessibility software across diverse industries. Furthermore, the rising number of internet users and the growing demand for inclusive web experiences are contributing significantly to market expansion. The market is segmented by organization size (SMEs and large enterprises), with large enterprises currently representing a larger market share due to their greater resources and complex website structures requiring comprehensive accessibility solutions. The software types include color contrast checkers and broader website accessibility software, the latter demonstrating faster growth due to its all-encompassing nature. Competitive landscape analysis reveals several key players, including Dubbot, Level Access, UserWay, and others, constantly innovating to offer advanced features and cater to evolving user needs. The North American region currently holds a substantial market share, but regions like Europe and Asia-Pacific are expected to witness significant growth in the forecast period due to increasing digitalization and regulatory changes.
The market's growth trajectory will likely be influenced by the ongoing evolution of accessibility standards and technologies. Advancements in artificial intelligence (AI) and machine learning (ML) are expected to enhance the capabilities of accessibility software, leading to improved accuracy and efficiency in identifying and remediating accessibility issues. However, factors such as the high initial investment costs associated with implementing accessibility software and a potential skills gap in managing these solutions could act as restraints to some extent. The long-term outlook, however, remains positive, with a projected substantial market expansion driven by the undeniable importance of digital accessibility and the ongoing pressure for compliance with global accessibility standards. Strategic partnerships and acquisitions within the industry are also expected to play a role in shaping the competitive dynamics and accelerating market growth.
Digital Accessibility Software Market Report: 2019-2033
This comprehensive report provides an in-depth analysis of the Digital Accessibility Software Market, offering invaluable insights for industry professionals, investors, and stakeholders. Covering the period 2019-2033, with a focus on 2025, this report meticulously examines market dynamics, key players, and future growth potential. The market is projected to reach xx Million by 2033, exhibiting a robust CAGR of xx% during the forecast period (2025-2033).
Digital Accessibility Software Market Structure & Innovation Trends
The Digital Accessibility Software market is characterized by a moderate level of concentration, with several key players vying for market share. While a few dominant players exist, a significant number of smaller companies also contribute significantly to innovation and market competition. Market share data for 2025 estimates that Siteimprove holds approximately xx% market share, followed by UserWay at xx%, and Level Access at xx%. Other significant players include Dubbot, Monsido, Crownpeak DQM, UsableNet AQA, Chrome Len, Silktide, and Wave API. The market's structure is dynamic, influenced by frequent mergers and acquisitions (M&A) activities.
- Innovation Drivers: Increasing regulatory pressure to ensure digital accessibility for people with disabilities, coupled with advancements in Artificial Intelligence (AI) and automation technologies, are key drivers of innovation.
- Regulatory Frameworks: Compliance with regulations like the ADA (Americans with Disabilities Act), Section 508, AODA (Accessibility for Ontarians with Disabilities Act), EAA (European Accessibility Act), WCAG (Web Content Accessibility Guidelines) 2.2, and EN 301 549 significantly impacts market growth.
- M&A Activity: Recent significant M&A activity includes the Level Access acquisition of UserWay (January 2024), a deal valued at approximately xx Million, highlighting the strategic importance of consolidating market share and expanding technological capabilities. The total value of M&A deals in the market during the historical period (2019-2024) is estimated at xx Million.
- Product Substitutes: While dedicated digital accessibility software solutions offer comprehensive features, some basic functionalities might be achieved using individual tools or plugins. However, these often lack the integrated and automated capabilities provided by dedicated software.
Digital Accessibility Software Market Market Dynamics & Trends
The Digital Accessibility Software market is experiencing robust growth, propelled by a confluence of factors. The escalating integration of digital technologies across diverse industries inherently necessitates the adoption of robust accessibility solutions to ensure regulatory compliance and to effectively serve a significantly broader user base. A burgeoning awareness of inclusivity and the imperative of digital accessibility among businesses and organizations globally is a primary catalyst fueling this market expansion. Furthermore, rapid technological advancements, particularly the sophisticated integration of Artificial Intelligence (AI) and Machine Learning (ML) into accessibility tools, are dramatically enhancing efficiency and accuracy in the identification, analysis, and rectification of accessibility barriers. Consumer preference for intuitive, user-friendly, and genuinely inclusive digital experiences is also a pivotal driver of sustained market growth. The competitive landscape is characterized by intense innovation cycles, strategic partnerships aimed at expanding reach and capabilities, and strategic acquisitions that consolidate market share and foster continuous improvement in product offerings. The market demonstrates strong and expanding penetration across a multitude of sectors, with a projected market penetration rate of **xx%** by 2033.
Dominant Regions & Segments in Digital Accessibility Software Market
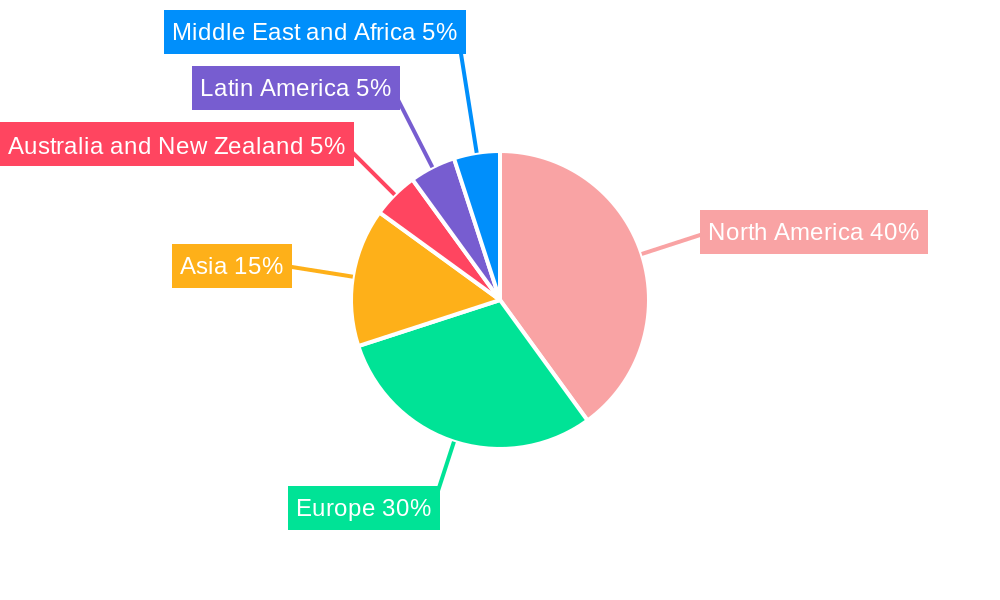
The North American region currently dominates the Digital Accessibility Software Market, driven by stringent regulatory frameworks and a high level of awareness concerning digital accessibility. Europe also holds a substantial market share, following a similar trend of increasing regulatory pressure and focus on inclusivity.
By Organisation Size:
- Large Enterprises: This segment is currently the largest, fueled by greater resources for compliance and the need to cater to diverse customer bases.
- Small and Medium Enterprises (SMEs): This segment shows significant growth potential, driven by increasing accessibility awareness and the availability of cost-effective solutions.
By Type:
- Website Accessibility Software: This segment dominates the market, reflecting the widespread need for comprehensive website accessibility audits and remediation.
- Color Contrast Checker Software: While a smaller segment, this continues to be important for ensuring basic visual accessibility.
Key drivers for regional dominance include robust economic growth, mature digital infrastructure, and proactive government regulations.
Digital Accessibility Software Market Product Innovations
The Digital Accessibility Software market is currently a hotbed of rapid innovation. New products are consistently emerging, boasting advanced features such as AI-powered automated testing that significantly reduces manual effort, real-time accessibility feedback mechanisms that empower developers to address issues as they arise, and seamlessly integrated remediation tools that streamline the entire correction process. These cutting-edge advancements collectively contribute to a significant reduction in both the costs and time investment required for comprehensive accessibility auditing and remediation. The market is also witnessing the strategic development of specialized solutions meticulously tailored to address the unique needs of specific industries and diverse user groups, underscoring a definitive trend towards more customized, efficient, and highly effective accessibility solutions. These innovations are pivotal in enhancing market fit by making sophisticated accessibility solutions more readily available, user-friendly, and easier to integrate seamlessly into existing development and operational workflows.
Report Scope & Segmentation Analysis
This comprehensive report meticulously segments the Digital Accessibility Software market, providing deep insights into key areas. The segmentation is organized by organization size, distinguishing between Small and Medium Enterprises (SMEs) and Large Enterprises, and by product type, categorizing solutions into Color Contrast Checker Software and Website Accessibility Software. The SME segment is anticipated to exhibit substantial growth throughout the forecast period, a trend fueled by increasing accessibility awareness coupled with the growing availability of cost-effective and user-friendly solutions. Conversely, the Large Enterprise segment is expected to maintain its market dominance, largely attributable to their more substantial budgets allocated for compliance initiatives and the inherently larger scale and complexity of their digital operations. Within the product types, the Website Accessibility Software segment is projected to dominate market share and grow at a Compound Annual Growth Rate (CAGR) of **xx%** during the forecast period. While smaller in comparison, the Color Contrast Checker Software segment is demonstrating steady and consistent growth as businesses increasingly prioritize foundational accessibility improvements. Competitive dynamics within each segment are significantly influenced by strategic pricing strategies, the breadth and depth of feature sets offered, and the quality of customer support services provided.
Key Drivers of Digital Accessibility Software Market Growth
Several factors drive the growth of the Digital Accessibility Software market. Stringent government regulations mandating website accessibility (like the ADA and WCAG) are a primary driver. Increased awareness of digital inclusion among businesses and their commitment to providing inclusive experiences for all users also plays a significant role. The market is also propelled by advancements in technology, particularly the increased use of AI and machine learning in accessibility testing and remediation. Finally, rising internet penetration and the expansion of e-commerce further contribute to this growth.
Challenges in the Digital Accessibility Software Market Sector
Despite the undeniable and significant growth potential, the Digital Accessibility Software market is not without its considerable challenges. The inherent complexity of evolving accessibility standards, coupled with the intricate task of ensuring complete and ongoing compliance, often presents substantial hurdles for businesses, particularly those with limited technical expertise. The initial cost of implementing comprehensive accessibility solutions can also act as a deterrent, especially for smaller enterprises with tighter budgetary constraints. Furthermore, the continuous evolution of accessibility standards necessitates perpetual updates, ongoing investments in software, and dedicated employee training, posing a significant challenge for long-term sustainability and strategic planning. The intensely competitive market environment and the unrelenting need for continuous innovation also add layers of complexity to market operations and strategic decision-making.
Emerging Opportunities in Digital Accessibility Software Market
The Digital Accessibility Software market presents substantial emerging opportunities. The expansion into new and emerging markets, particularly in developing economies with increasing internet penetration, offers significant growth potential. Advances in AI and machine learning, enabling more accurate and efficient accessibility testing, are creating new avenues for innovation. Furthermore, the growing demand for specialized accessibility solutions for specific industries like healthcare and education presents lucrative opportunities for market players. Finally, the development of integrated accessibility solutions that seamlessly integrate into existing workflows offers a significant advantage.
Leading Players in the Digital Accessibility Software Market Market
- Dubbot
- Level Access
- UserWay
- Monsido
- Crownpeak DQM
- UsableNet AQA
- Chrome Len
- Siteimprove
- Silktide
- Wave API
Key Developments in Digital Accessibility Software Market Industry
- October 2023: UserWay launched a comprehensive upgrade to its offerings, aligning with the W3C's adoption of WCAG 2.2.
- January 2024: Level Access announced its acquisition of UserWay, significantly impacting market consolidation.
These developments underscore the dynamic nature of the market and its focus on enhancing accessibility standards and technological capabilities.
Future Outlook for Digital Accessibility Software Market Market
The future trajectory of the Digital Accessibility Software market appears exceptionally promising, driven by a potent combination of accelerating trends. The pervasive and increasing adoption of digital technologies across an ever-expanding array of industries creates an imperative demand for sophisticated and improved accessibility solutions. Stringent regulatory frameworks being implemented globally and a heightened societal awareness of digital inclusion are also playing a pivotal and increasingly significant role in shaping market demand. Technological advancements, notably the continued integration and refinement of AI and Machine Learning capabilities, are actively streamlining the processes of accessibility testing, analysis, and remediation, making them more efficient and accessible than ever before. The market's future potential is substantial, propelled by sustained innovation, the expanding reach of global digitalization, and a growing recognition of accessibility as a core business imperative. This dynamic environment presents numerous strategic opportunities for forward-thinking companies to effectively capitalize on the escalating global demand for user-friendly, inclusive, and ethically designed digital experiences.
Digital Accessibility Software Market Segmentation
-
1. Type
- 1.1. Color Contrast Checker Software
- 1.2. Website Accessibility Software
-
2. Organisation Size
- 2.1. Small and Medium Enterprises
- 2.2. Large Enterprises
Digital Accessibility Software Market Segmentation By Geography
- 1. North America
- 2. Europe
- 3. Asia
- 4. Australia and New Zealand
- 5. Latin America
- 6. Middle East and Africa
Digital Accessibility Software Market REPORT HIGHLIGHTS
| Aspects | Details |
|---|---|
| Study Period | 2019-2033 |
| Base Year | 2024 |
| Estimated Year | 2025 |
| Forecast Period | 2025-2033 |
| Historical Period | 2019-2024 |
| Growth Rate | CAGR of 6.31% from 2019-2033 |
| Segmentation |
|
Table of Contents
- 1. Introduction
- 1.1. Research Scope
- 1.2. Market Segmentation
- 1.3. Research Methodology
- 1.4. Definitions and Assumptions
- 2. Executive Summary
- 2.1. Introduction
- 3. Market Dynamics
- 3.1. Introduction
- 3.2. Market Drivers
- 3.2.1 Due to embedded accessibility features Smartphones present a useful tool for persons with disabilities
- 3.2.2 will drive market; Government schemes for disabled people
- 3.3. Market Restrains
- 3.3.1. lack of awareness of mobile accessibility features and mobile internet are key barriers
- 3.4. Market Trends
- 3.4.1. Government policies and laws will drive the market further
- 4. Market Factor Analysis
- 4.1. Porters Five Forces
- 4.2. Supply/Value Chain
- 4.3. PESTEL analysis
- 4.4. Market Entropy
- 4.5. Patent/Trademark Analysis
- 5. Global Digital Accessibility Software Market Analysis, Insights and Forecast, 2019-2031
- 5.1. Market Analysis, Insights and Forecast - by Type
- 5.1.1. Color Contrast Checker Software
- 5.1.2. Website Accessibility Software
- 5.2. Market Analysis, Insights and Forecast - by Organisation Size
- 5.2.1. Small and Medium Enterprises
- 5.2.2. Large Enterprises
- 5.3. Market Analysis, Insights and Forecast - by Region
- 5.3.1. North America
- 5.3.2. Europe
- 5.3.3. Asia
- 5.3.4. Australia and New Zealand
- 5.3.5. Latin America
- 5.3.6. Middle East and Africa
- 5.1. Market Analysis, Insights and Forecast - by Type
- 6. North America Digital Accessibility Software Market Analysis, Insights and Forecast, 2019-2031
- 6.1. Market Analysis, Insights and Forecast - by Type
- 6.1.1. Color Contrast Checker Software
- 6.1.2. Website Accessibility Software
- 6.2. Market Analysis, Insights and Forecast - by Organisation Size
- 6.2.1. Small and Medium Enterprises
- 6.2.2. Large Enterprises
- 6.1. Market Analysis, Insights and Forecast - by Type
- 7. Europe Digital Accessibility Software Market Analysis, Insights and Forecast, 2019-2031
- 7.1. Market Analysis, Insights and Forecast - by Type
- 7.1.1. Color Contrast Checker Software
- 7.1.2. Website Accessibility Software
- 7.2. Market Analysis, Insights and Forecast - by Organisation Size
- 7.2.1. Small and Medium Enterprises
- 7.2.2. Large Enterprises
- 7.1. Market Analysis, Insights and Forecast - by Type
- 8. Asia Digital Accessibility Software Market Analysis, Insights and Forecast, 2019-2031
- 8.1. Market Analysis, Insights and Forecast - by Type
- 8.1.1. Color Contrast Checker Software
- 8.1.2. Website Accessibility Software
- 8.2. Market Analysis, Insights and Forecast - by Organisation Size
- 8.2.1. Small and Medium Enterprises
- 8.2.2. Large Enterprises
- 8.1. Market Analysis, Insights and Forecast - by Type
- 9. Australia and New Zealand Digital Accessibility Software Market Analysis, Insights and Forecast, 2019-2031
- 9.1. Market Analysis, Insights and Forecast - by Type
- 9.1.1. Color Contrast Checker Software
- 9.1.2. Website Accessibility Software
- 9.2. Market Analysis, Insights and Forecast - by Organisation Size
- 9.2.1. Small and Medium Enterprises
- 9.2.2. Large Enterprises
- 9.1. Market Analysis, Insights and Forecast - by Type
- 10. Latin America Digital Accessibility Software Market Analysis, Insights and Forecast, 2019-2031
- 10.1. Market Analysis, Insights and Forecast - by Type
- 10.1.1. Color Contrast Checker Software
- 10.1.2. Website Accessibility Software
- 10.2. Market Analysis, Insights and Forecast - by Organisation Size
- 10.2.1. Small and Medium Enterprises
- 10.2.2. Large Enterprises
- 10.1. Market Analysis, Insights and Forecast - by Type
- 11. Middle East and Africa Digital Accessibility Software Market Analysis, Insights and Forecast, 2019-2031
- 11.1. Market Analysis, Insights and Forecast - by Type
- 11.1.1. Color Contrast Checker Software
- 11.1.2. Website Accessibility Software
- 11.2. Market Analysis, Insights and Forecast - by Organisation Size
- 11.2.1. Small and Medium Enterprises
- 11.2.2. Large Enterprises
- 11.1. Market Analysis, Insights and Forecast - by Type
- 12. North America Digital Accessibility Software Market Analysis, Insights and Forecast, 2019-2031
- 12.1. Market Analysis, Insights and Forecast - By Country/Sub-region
- 12.1.1.
- 13. Europe Digital Accessibility Software Market Analysis, Insights and Forecast, 2019-2031
- 13.1. Market Analysis, Insights and Forecast - By Country/Sub-region
- 13.1.1.
- 14. Asia Digital Accessibility Software Market Analysis, Insights and Forecast, 2019-2031
- 14.1. Market Analysis, Insights and Forecast - By Country/Sub-region
- 14.1.1.
- 15. Australia and New Zealand Digital Accessibility Software Market Analysis, Insights and Forecast, 2019-2031
- 15.1. Market Analysis, Insights and Forecast - By Country/Sub-region
- 15.1.1.
- 16. Latin America Digital Accessibility Software Market Analysis, Insights and Forecast, 2019-2031
- 16.1. Market Analysis, Insights and Forecast - By Country/Sub-region
- 16.1.1.
- 17. Middle East and Africa Digital Accessibility Software Market Analysis, Insights and Forecast, 2019-2031
- 17.1. Market Analysis, Insights and Forecast - By Country/Sub-region
- 17.1.1.
- 18. Competitive Analysis
- 18.1. Global Market Share Analysis 2024
- 18.2. Company Profiles
- 18.2.1 Dubbot
- 18.2.1.1. Overview
- 18.2.1.2. Products
- 18.2.1.3. SWOT Analysis
- 18.2.1.4. Recent Developments
- 18.2.1.5. Financials (Based on Availability)
- 18.2.2 Level Access
- 18.2.2.1. Overview
- 18.2.2.2. Products
- 18.2.2.3. SWOT Analysis
- 18.2.2.4. Recent Developments
- 18.2.2.5. Financials (Based on Availability)
- 18.2.3 UserWay
- 18.2.3.1. Overview
- 18.2.3.2. Products
- 18.2.3.3. SWOT Analysis
- 18.2.3.4. Recent Developments
- 18.2.3.5. Financials (Based on Availability)
- 18.2.4 Monsido
- 18.2.4.1. Overview
- 18.2.4.2. Products
- 18.2.4.3. SWOT Analysis
- 18.2.4.4. Recent Developments
- 18.2.4.5. Financials (Based on Availability)
- 18.2.5 Crownpeak Dqm
- 18.2.5.1. Overview
- 18.2.5.2. Products
- 18.2.5.3. SWOT Analysis
- 18.2.5.4. Recent Developments
- 18.2.5.5. Financials (Based on Availability)
- 18.2.6 UsableNet AQA
- 18.2.6.1. Overview
- 18.2.6.2. Products
- 18.2.6.3. SWOT Analysis
- 18.2.6.4. Recent Developments
- 18.2.6.5. Financials (Based on Availability)
- 18.2.7 Chrome Len
- 18.2.7.1. Overview
- 18.2.7.2. Products
- 18.2.7.3. SWOT Analysis
- 18.2.7.4. Recent Developments
- 18.2.7.5. Financials (Based on Availability)
- 18.2.8 Siteimprove
- 18.2.8.1. Overview
- 18.2.8.2. Products
- 18.2.8.3. SWOT Analysis
- 18.2.8.4. Recent Developments
- 18.2.8.5. Financials (Based on Availability)
- 18.2.9 Silktide
- 18.2.9.1. Overview
- 18.2.9.2. Products
- 18.2.9.3. SWOT Analysis
- 18.2.9.4. Recent Developments
- 18.2.9.5. Financials (Based on Availability)
- 18.2.10 Wave API
- 18.2.10.1. Overview
- 18.2.10.2. Products
- 18.2.10.3. SWOT Analysis
- 18.2.10.4. Recent Developments
- 18.2.10.5. Financials (Based on Availability)
- 18.2.1 Dubbot
List of Figures
- Figure 1: Global Digital Accessibility Software Market Revenue Breakdown (Million, %) by Region 2024 & 2032
- Figure 2: North America Digital Accessibility Software Market Revenue (Million), by Country 2024 & 2032
- Figure 3: North America Digital Accessibility Software Market Revenue Share (%), by Country 2024 & 2032
- Figure 4: Europe Digital Accessibility Software Market Revenue (Million), by Country 2024 & 2032
- Figure 5: Europe Digital Accessibility Software Market Revenue Share (%), by Country 2024 & 2032
- Figure 6: Asia Digital Accessibility Software Market Revenue (Million), by Country 2024 & 2032
- Figure 7: Asia Digital Accessibility Software Market Revenue Share (%), by Country 2024 & 2032
- Figure 8: Australia and New Zealand Digital Accessibility Software Market Revenue (Million), by Country 2024 & 2032
- Figure 9: Australia and New Zealand Digital Accessibility Software Market Revenue Share (%), by Country 2024 & 2032
- Figure 10: Latin America Digital Accessibility Software Market Revenue (Million), by Country 2024 & 2032
- Figure 11: Latin America Digital Accessibility Software Market Revenue Share (%), by Country 2024 & 2032
- Figure 12: Middle East and Africa Digital Accessibility Software Market Revenue (Million), by Country 2024 & 2032
- Figure 13: Middle East and Africa Digital Accessibility Software Market Revenue Share (%), by Country 2024 & 2032
- Figure 14: North America Digital Accessibility Software Market Revenue (Million), by Type 2024 & 2032
- Figure 15: North America Digital Accessibility Software Market Revenue Share (%), by Type 2024 & 2032
- Figure 16: North America Digital Accessibility Software Market Revenue (Million), by Organisation Size 2024 & 2032
- Figure 17: North America Digital Accessibility Software Market Revenue Share (%), by Organisation Size 2024 & 2032
- Figure 18: North America Digital Accessibility Software Market Revenue (Million), by Country 2024 & 2032
- Figure 19: North America Digital Accessibility Software Market Revenue Share (%), by Country 2024 & 2032
- Figure 20: Europe Digital Accessibility Software Market Revenue (Million), by Type 2024 & 2032
- Figure 21: Europe Digital Accessibility Software Market Revenue Share (%), by Type 2024 & 2032
- Figure 22: Europe Digital Accessibility Software Market Revenue (Million), by Organisation Size 2024 & 2032
- Figure 23: Europe Digital Accessibility Software Market Revenue Share (%), by Organisation Size 2024 & 2032
- Figure 24: Europe Digital Accessibility Software Market Revenue (Million), by Country 2024 & 2032
- Figure 25: Europe Digital Accessibility Software Market Revenue Share (%), by Country 2024 & 2032
- Figure 26: Asia Digital Accessibility Software Market Revenue (Million), by Type 2024 & 2032
- Figure 27: Asia Digital Accessibility Software Market Revenue Share (%), by Type 2024 & 2032
- Figure 28: Asia Digital Accessibility Software Market Revenue (Million), by Organisation Size 2024 & 2032
- Figure 29: Asia Digital Accessibility Software Market Revenue Share (%), by Organisation Size 2024 & 2032
- Figure 30: Asia Digital Accessibility Software Market Revenue (Million), by Country 2024 & 2032
- Figure 31: Asia Digital Accessibility Software Market Revenue Share (%), by Country 2024 & 2032
- Figure 32: Australia and New Zealand Digital Accessibility Software Market Revenue (Million), by Type 2024 & 2032
- Figure 33: Australia and New Zealand Digital Accessibility Software Market Revenue Share (%), by Type 2024 & 2032
- Figure 34: Australia and New Zealand Digital Accessibility Software Market Revenue (Million), by Organisation Size 2024 & 2032
- Figure 35: Australia and New Zealand Digital Accessibility Software Market Revenue Share (%), by Organisation Size 2024 & 2032
- Figure 36: Australia and New Zealand Digital Accessibility Software Market Revenue (Million), by Country 2024 & 2032
- Figure 37: Australia and New Zealand Digital Accessibility Software Market Revenue Share (%), by Country 2024 & 2032
- Figure 38: Latin America Digital Accessibility Software Market Revenue (Million), by Type 2024 & 2032
- Figure 39: Latin America Digital Accessibility Software Market Revenue Share (%), by Type 2024 & 2032
- Figure 40: Latin America Digital Accessibility Software Market Revenue (Million), by Organisation Size 2024 & 2032
- Figure 41: Latin America Digital Accessibility Software Market Revenue Share (%), by Organisation Size 2024 & 2032
- Figure 42: Latin America Digital Accessibility Software Market Revenue (Million), by Country 2024 & 2032
- Figure 43: Latin America Digital Accessibility Software Market Revenue Share (%), by Country 2024 & 2032
- Figure 44: Middle East and Africa Digital Accessibility Software Market Revenue (Million), by Type 2024 & 2032
- Figure 45: Middle East and Africa Digital Accessibility Software Market Revenue Share (%), by Type 2024 & 2032
- Figure 46: Middle East and Africa Digital Accessibility Software Market Revenue (Million), by Organisation Size 2024 & 2032
- Figure 47: Middle East and Africa Digital Accessibility Software Market Revenue Share (%), by Organisation Size 2024 & 2032
- Figure 48: Middle East and Africa Digital Accessibility Software Market Revenue (Million), by Country 2024 & 2032
- Figure 49: Middle East and Africa Digital Accessibility Software Market Revenue Share (%), by Country 2024 & 2032
List of Tables
- Table 1: Global Digital Accessibility Software Market Revenue Million Forecast, by Region 2019 & 2032
- Table 2: Global Digital Accessibility Software Market Revenue Million Forecast, by Type 2019 & 2032
- Table 3: Global Digital Accessibility Software Market Revenue Million Forecast, by Organisation Size 2019 & 2032
- Table 4: Global Digital Accessibility Software Market Revenue Million Forecast, by Region 2019 & 2032
- Table 5: Global Digital Accessibility Software Market Revenue Million Forecast, by Country 2019 & 2032
- Table 6: Digital Accessibility Software Market Revenue (Million) Forecast, by Application 2019 & 2032
- Table 7: Global Digital Accessibility Software Market Revenue Million Forecast, by Country 2019 & 2032
- Table 8: Digital Accessibility Software Market Revenue (Million) Forecast, by Application 2019 & 2032
- Table 9: Global Digital Accessibility Software Market Revenue Million Forecast, by Country 2019 & 2032
- Table 10: Digital Accessibility Software Market Revenue (Million) Forecast, by Application 2019 & 2032
- Table 11: Global Digital Accessibility Software Market Revenue Million Forecast, by Country 2019 & 2032
- Table 12: Digital Accessibility Software Market Revenue (Million) Forecast, by Application 2019 & 2032
- Table 13: Global Digital Accessibility Software Market Revenue Million Forecast, by Country 2019 & 2032
- Table 14: Digital Accessibility Software Market Revenue (Million) Forecast, by Application 2019 & 2032
- Table 15: Global Digital Accessibility Software Market Revenue Million Forecast, by Country 2019 & 2032
- Table 16: Digital Accessibility Software Market Revenue (Million) Forecast, by Application 2019 & 2032
- Table 17: Global Digital Accessibility Software Market Revenue Million Forecast, by Type 2019 & 2032
- Table 18: Global Digital Accessibility Software Market Revenue Million Forecast, by Organisation Size 2019 & 2032
- Table 19: Global Digital Accessibility Software Market Revenue Million Forecast, by Country 2019 & 2032
- Table 20: Global Digital Accessibility Software Market Revenue Million Forecast, by Type 2019 & 2032
- Table 21: Global Digital Accessibility Software Market Revenue Million Forecast, by Organisation Size 2019 & 2032
- Table 22: Global Digital Accessibility Software Market Revenue Million Forecast, by Country 2019 & 2032
- Table 23: Global Digital Accessibility Software Market Revenue Million Forecast, by Type 2019 & 2032
- Table 24: Global Digital Accessibility Software Market Revenue Million Forecast, by Organisation Size 2019 & 2032
- Table 25: Global Digital Accessibility Software Market Revenue Million Forecast, by Country 2019 & 2032
- Table 26: Global Digital Accessibility Software Market Revenue Million Forecast, by Type 2019 & 2032
- Table 27: Global Digital Accessibility Software Market Revenue Million Forecast, by Organisation Size 2019 & 2032
- Table 28: Global Digital Accessibility Software Market Revenue Million Forecast, by Country 2019 & 2032
- Table 29: Global Digital Accessibility Software Market Revenue Million Forecast, by Type 2019 & 2032
- Table 30: Global Digital Accessibility Software Market Revenue Million Forecast, by Organisation Size 2019 & 2032
- Table 31: Global Digital Accessibility Software Market Revenue Million Forecast, by Country 2019 & 2032
- Table 32: Global Digital Accessibility Software Market Revenue Million Forecast, by Type 2019 & 2032
- Table 33: Global Digital Accessibility Software Market Revenue Million Forecast, by Organisation Size 2019 & 2032
- Table 34: Global Digital Accessibility Software Market Revenue Million Forecast, by Country 2019 & 2032
Frequently Asked Questions
1. What is the projected Compound Annual Growth Rate (CAGR) of the Digital Accessibility Software Market?
The projected CAGR is approximately 6.31%.
2. Which companies are prominent players in the Digital Accessibility Software Market?
Key companies in the market include Dubbot, Level Access, UserWay, Monsido, Crownpeak Dqm, UsableNet AQA, Chrome Len, Siteimprove, Silktide, Wave API.
3. What are the main segments of the Digital Accessibility Software Market?
The market segments include Type, Organisation Size.
4. Can you provide details about the market size?
The market size is estimated to be USD 0.75 Million as of 2022.
5. What are some drivers contributing to market growth?
Due to embedded accessibility features Smartphones present a useful tool for persons with disabilities. will drive market; Government schemes for disabled people.
6. What are the notable trends driving market growth?
Government policies and laws will drive the market further.
7. Are there any restraints impacting market growth?
lack of awareness of mobile accessibility features and mobile internet are key barriers.
8. Can you provide examples of recent developments in the market?
January 2024 - Level Access is poised to acquire UserWay, one of the leading innovators in digital accessibility. UserWay, a renowned provider of comprehensive digital accessibility software solutions, is the go-to choice for millions of websites globally, enhancing usability for individuals with disabilities. Leveraging cutting-edge AI technologies, UserWay empowers websites, apps, and digital documents to meet accessibility regulations, including the ADA, Section 508, AODA, and EAA, and global benchmarks like WCAG 2.2 and EN 301 549.
9. What pricing options are available for accessing the report?
Pricing options include single-user, multi-user, and enterprise licenses priced at USD 4750, USD 5250, and USD 8750 respectively.
10. Is the market size provided in terms of value or volume?
The market size is provided in terms of value, measured in Million.
11. Are there any specific market keywords associated with the report?
Yes, the market keyword associated with the report is "Digital Accessibility Software Market," which aids in identifying and referencing the specific market segment covered.
12. How do I determine which pricing option suits my needs best?
The pricing options vary based on user requirements and access needs. Individual users may opt for single-user licenses, while businesses requiring broader access may choose multi-user or enterprise licenses for cost-effective access to the report.
13. Are there any additional resources or data provided in the Digital Accessibility Software Market report?
While the report offers comprehensive insights, it's advisable to review the specific contents or supplementary materials provided to ascertain if additional resources or data are available.
14. How can I stay updated on further developments or reports in the Digital Accessibility Software Market?
To stay informed about further developments, trends, and reports in the Digital Accessibility Software Market, consider subscribing to industry newsletters, following relevant companies and organizations, or regularly checking reputable industry news sources and publications.
Methodology
Step 1 - Identification of Relevant Samples Size from Population Database


Step 2 - Approaches for Defining Global Market Size (Value, Volume* & Price*)

Note*: In applicable scenarios
Step 3 - Data Sources
Primary Research
- Web Analytics
- Survey Reports
- Research Institute
- Latest Research Reports
- Opinion Leaders
Secondary Research
- Annual Reports
- White Paper
- Latest Press Release
- Industry Association
- Paid Database
- Investor Presentations

Step 4 - Data Triangulation
Involves using different sources of information in order to increase the validity of a study
These sources are likely to be stakeholders in a program - participants, other researchers, program staff, other community members, and so on.
Then we put all data in single framework & apply various statistical tools to find out the dynamic on the market.
During the analysis stage, feedback from the stakeholder groups would be compared to determine areas of agreement as well as areas of divergence


