
Key Insights
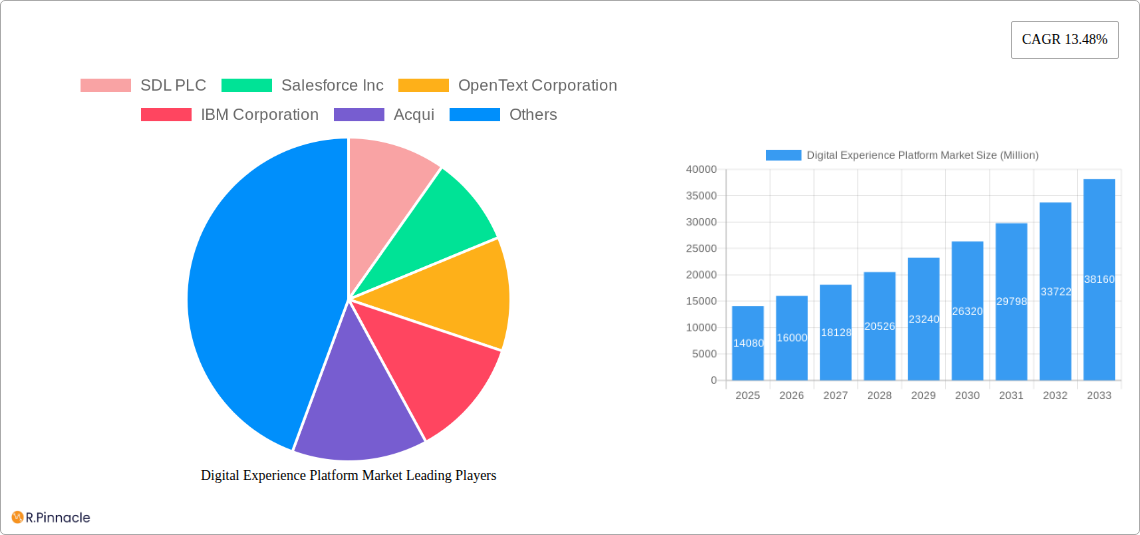
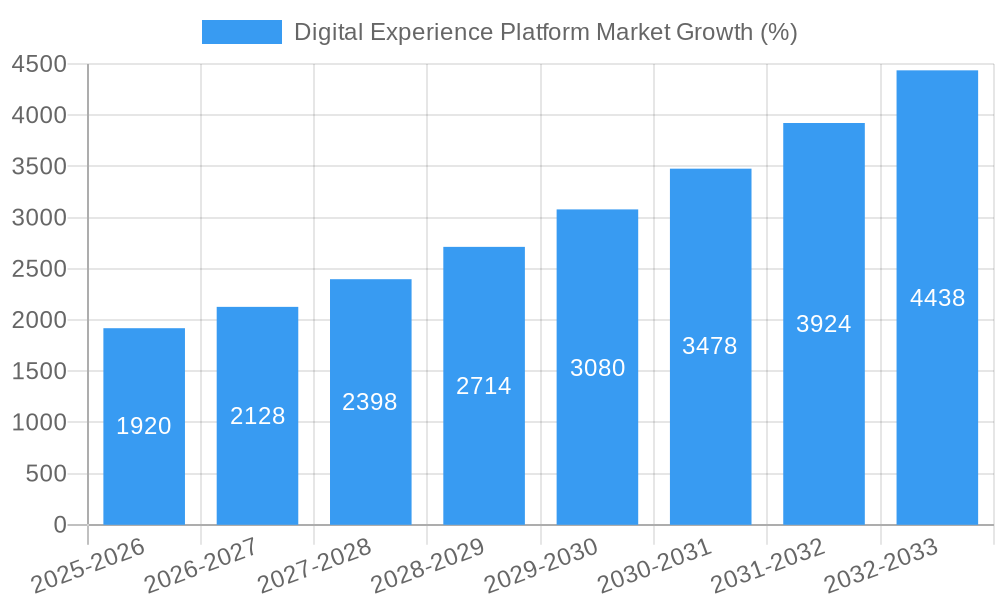
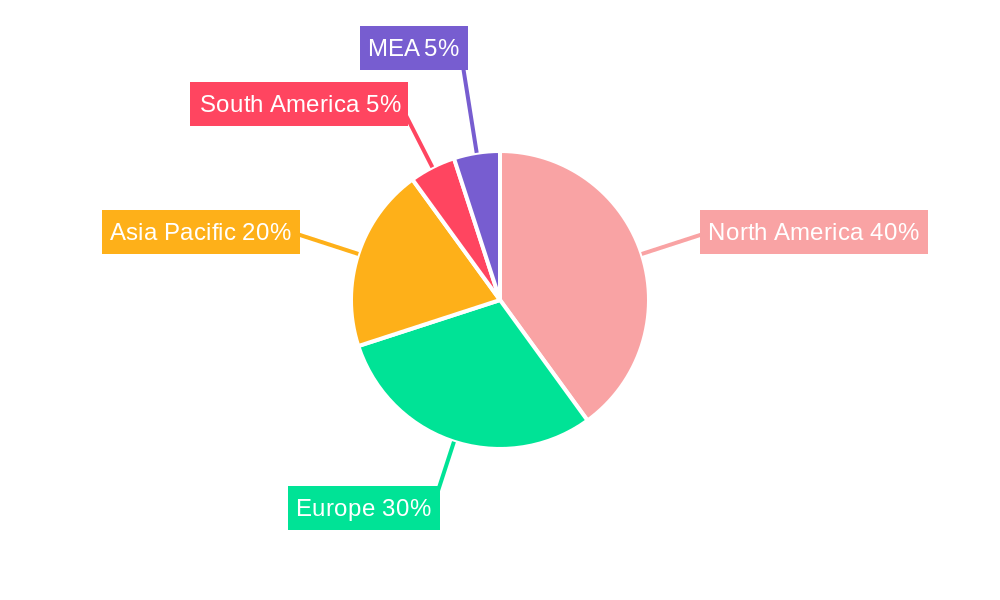
The Digital Experience Platform (DXP) market is experiencing robust growth, projected to reach \$14.08 billion in 2025 and exhibiting a Compound Annual Growth Rate (CAGR) of 13.48% from 2025 to 2033. This expansion is fueled by several key drivers. Firstly, the increasing need for businesses to deliver seamless and personalized digital experiences across all customer touchpoints is a major catalyst. Secondly, the rise of omnichannel strategies necessitates integrated platforms capable of managing content, commerce, and customer interactions across various channels. Thirdly, advancements in technologies like AI and machine learning are enhancing DXP capabilities, enabling advanced personalization and automation. The market is segmented by component (platform and services), deployment type (on-premise and cloud), and end-user industry (retail, IT and telecom, BFSI, healthcare, and others). The cloud deployment model is expected to dominate, driven by its scalability, flexibility, and cost-effectiveness. North America currently holds a significant market share due to early adoption and a mature technological landscape, but the Asia-Pacific region is poised for substantial growth fueled by increasing digitalization and rising internet penetration. Competition is fierce, with major players including SDL PLC, Salesforce, OpenText, IBM, Adobe, Oracle, Sitecore, and SAP vying for market dominance through innovation and strategic acquisitions.
The restraints on market growth primarily involve the complexities associated with DXP implementation and integration with existing systems. High initial investment costs and the need for specialized expertise can also hinder adoption, particularly for smaller businesses. However, the long-term benefits of improved customer engagement, increased operational efficiency, and enhanced brand loyalty are expected to outweigh these challenges, ensuring continued market expansion throughout the forecast period. The ongoing evolution of customer expectations and the emergence of new technologies will necessitate continuous innovation within the DXP space, further stimulating market growth and driving competition. The shift towards headless architectures and composable DXPs is another significant trend to watch, promising greater flexibility and customization.
Digital Experience Platform Market Report: 2019-2033
This comprehensive report provides an in-depth analysis of the Digital Experience Platform (DXP) market, offering invaluable insights for industry professionals, investors, and strategists. With a study period spanning 2019-2033, a base year of 2025, and a forecast period of 2025-2033, this report leverages historical data (2019-2024) to project future market trends and growth opportunities. The report segments the market by component (Platform, Services), deployment type (On-Premise, Cloud), and end-user (Retail, IT & Telecom, BFSI, Healthcare, Other). Key players analyzed include SDL PLC, Salesforce Inc, OpenText Corporation, IBM Corporation, Acqui, Microsoft Corporation, Adobe Inc, Oracle Corporation, Sitecore, and SAP SE. The market is projected to reach xx Million by 2033.
Digital Experience Platform Market Structure & Innovation Trends
This section analyzes the competitive landscape, innovation drivers, and regulatory influences shaping the DXP market. Market concentration is assessed, revealing the market share held by key players and highlighting potential for future consolidation. Innovation drivers, such as advancements in AI, cloud computing, and personalized experiences, are examined along with their impact on market growth. The regulatory framework and its influence on market dynamics are also analyzed, including any potential hurdles or opportunities presented by government policies. The report also explores the emergence of substitute products and their potential impact on market share. Furthermore, mergers and acquisitions (M&A) activities within the sector, including deal values and their strategic implications, are reviewed. For example, the predicted M&A activity in the next 5 years could lead to a xx% increase in market concentration.
Digital Experience Platform Market Dynamics & Trends
This section delves into the key factors driving market growth, including the increasing adoption of cloud-based DXPs, the growing demand for personalized customer experiences, and the rising need for businesses to enhance their digital transformation efforts. The report examines the impact of technological disruptions, such as the proliferation of mobile devices and the increasing adoption of IoT, on market dynamics. It also analyzes consumer preferences, highlighting the demand for seamless, intuitive, and personalized digital experiences. Competitive dynamics are explored, assessing the strategies employed by major players to gain market share and maintain a competitive edge. The report projects a Compound Annual Growth Rate (CAGR) of xx% for the forecast period, with market penetration expected to reach xx% by 2033.
Dominant Regions & Segments in Digital Experience Platform Market
This section identifies the leading regions and segments within the DXP market. It analyzes the factors contributing to the dominance of specific regions and segments, including economic policies, infrastructure development, and technological advancements. The analysis includes detailed discussions of:
- Leading Region: [Region Name], driven by [Key Drivers: e.g., strong government support for digital transformation, robust IT infrastructure].
- Leading Segment (Component): [Platform/Services], fueled by [Key Drivers: e.g., increased demand for integrated solutions, rising adoption of cloud-based platforms].
- Leading Segment (Deployment Type): [Cloud/On-Premise], owing to [Key Drivers: e.g., cost-effectiveness of cloud solutions, enhanced security concerns favoring on-premise deployments].
- Leading Segment (End-User): [Retail/IT & Telecom/BFSI/Healthcare/Other], due to [Key Drivers: e.g., increasing need for improved customer engagement, rising investment in digital transformation initiatives].
Digital Experience Platform Market Product Innovations
Recent product developments in the DXP market reflect a strong focus on AI-powered personalization, enhanced omnichannel capabilities, and improved security features. These innovations are designed to cater to the evolving needs of businesses and consumers alike, providing seamless and personalized digital experiences while addressing growing security concerns. The market's competitive landscape is characterized by continuous innovation, with companies striving to deliver unique value propositions to attract and retain customers.
Report Scope & Segmentation Analysis
This report segments the Digital Experience Platform market across several key parameters:
Component: Platform and Services. The Platform segment is projected to grow at a CAGR of xx% during the forecast period, driven by [brief explanation of growth drivers]. The Services segment is expected to grow at a CAGR of xx%, driven by [brief explanation of growth drivers].
Deployment Type: On-Premise and Cloud. The Cloud segment is expected to dominate the market due to [brief explanation of dominance factors]. The On-Premise segment will also see growth, driven by [brief explanation of growth drivers].
End-Users: Retail, IT and Telecom, BFSI, Healthcare, and Other End-Users. Each segment is expected to experience significant growth during the forecast period, driven by [brief explanation of growth factors for each segment]. Competitive dynamics vary across segments, with specific players holding stronger positions in certain areas.
Key Drivers of Digital Experience Platform Market Growth
The DXP market is experiencing robust growth, driven by several key factors. The increasing need for personalized customer experiences is a major catalyst, pushing businesses to invest in advanced DXP solutions. Furthermore, technological advancements like AI, machine learning, and cloud computing are enabling the development of more sophisticated and efficient DXPs. Government initiatives promoting digital transformation across various sectors are further fueling market expansion. Finally, the growing adoption of omnichannel strategies, enabling businesses to engage customers seamlessly across multiple touchpoints, is a significant driver of market growth.
Challenges in the Digital Experience Platform Market Sector
Despite significant growth, the DXP market faces challenges. The high cost of implementation and maintenance of DXP solutions can be a barrier for smaller businesses. Integration complexities with existing systems can also hinder adoption. Furthermore, ensuring data security and privacy in a rapidly evolving digital landscape presents significant challenges, necessitating robust security measures. Finally, the competitive landscape, with numerous established and emerging players, creates intense competition, requiring continuous innovation and adaptation to maintain a competitive edge.
Emerging Opportunities in Digital Experience Platform Market
The DXP market presents significant opportunities for growth. The rising adoption of headless architectures offers greater flexibility and scalability, presenting new avenues for innovation. The integration of emerging technologies like AI and AR/VR can create immersive and engaging customer experiences. Furthermore, expanding into untapped markets in developing economies presents significant potential for growth. Finally, the increasing focus on sustainability and responsible technology provides an opportunity for DXPs that are designed with environmental and social considerations in mind.
Leading Players in the Digital Experience Platform Market Market
- SDL PLC
- Salesforce Inc
- OpenText Corporation
- IBM Corporation
- Acqui
- Microsoft Corporation
- Adobe Inc
- Oracle Corporation
- Sitecore
- SAP SE
Key Developments in Digital Experience Platform Market Industry
- December 2022: The Bank of Thailand (BOT) adopted Oracle Fusion Cloud HCM, enhancing employee experience and streamlining HR processes.
- December 2022: Oracle launched a new cloud region in Chicago, expanding its global infrastructure and providing enhanced services to US Midwest customers.
- September 2022: KeyBank partnered with Oracle to modernize its consumer lending processes, improving efficiency and customer service.
Future Outlook for Digital Experience Platform Market Market
The future of the DXP market is bright, with continued growth driven by several factors. The increasing adoption of cloud-based solutions, coupled with advancements in AI and personalization technologies, will further fuel market expansion. The growing demand for seamless omnichannel experiences across various industries will create significant opportunities for DXP providers. Furthermore, the emergence of new technologies, such as the metaverse and Web3, will present exciting opportunities for DXP innovation and expansion into new markets. The market is expected to experience sustained growth, driven by these factors, and will continue to be a significant area of investment and technological advancement.
Digital Experience Platform Market Segmentation
-
1. Component
- 1.1. Platform
- 1.2. Services
-
2. Deployment Type
- 2.1. On-Premise
- 2.2. Cloud
-
3. End Users
- 3.1. Retail
- 3.2. IT and Telecom
- 3.3. BFSI
- 3.4. Healthcare
- 3.5. Other End Users
Digital Experience Platform Market Segmentation By Geography
- 1. North America
- 2. Europe
- 3. Asia
- 4. Australia and New Zealand
- 5. Latin America
- 6. Middle East and Africa
Digital Experience Platform Market REPORT HIGHLIGHTS
| Aspects | Details |
|---|---|
| Study Period | 2019-2033 |
| Base Year | 2024 |
| Estimated Year | 2025 |
| Forecast Period | 2025-2033 |
| Historical Period | 2019-2024 |
| Growth Rate | CAGR of 13.48% from 2019-2033 |
| Segmentation |
|
Table of Contents
- 1. Introduction
- 1.1. Research Scope
- 1.2. Market Segmentation
- 1.3. Research Methodology
- 1.4. Definitions and Assumptions
- 2. Executive Summary
- 2.1. Introduction
- 3. Market Dynamics
- 3.1. Introduction
- 3.2. Market Drivers
- 3.2.1. Growing Deployment of Cloud-Based Solutions; Rising Demand for big Data Analytics
- 3.3. Market Restrains
- 3.3.1. Privacy and Data Security Issues
- 3.4. Market Trends
- 3.4.1. On Cloud Deployment to Drive the Market Growth
- 4. Market Factor Analysis
- 4.1. Porters Five Forces
- 4.2. Supply/Value Chain
- 4.3. PESTEL analysis
- 4.4. Market Entropy
- 4.5. Patent/Trademark Analysis
- 5. Global Digital Experience Platform Market Analysis, Insights and Forecast, 2019-2031
- 5.1. Market Analysis, Insights and Forecast - by Component
- 5.1.1. Platform
- 5.1.2. Services
- 5.2. Market Analysis, Insights and Forecast - by Deployment Type
- 5.2.1. On-Premise
- 5.2.2. Cloud
- 5.3. Market Analysis, Insights and Forecast - by End Users
- 5.3.1. Retail
- 5.3.2. IT and Telecom
- 5.3.3. BFSI
- 5.3.4. Healthcare
- 5.3.5. Other End Users
- 5.4. Market Analysis, Insights and Forecast - by Region
- 5.4.1. North America
- 5.4.2. Europe
- 5.4.3. Asia
- 5.4.4. Australia and New Zealand
- 5.4.5. Latin America
- 5.4.6. Middle East and Africa
- 5.1. Market Analysis, Insights and Forecast - by Component
- 6. North America Digital Experience Platform Market Analysis, Insights and Forecast, 2019-2031
- 6.1. Market Analysis, Insights and Forecast - by Component
- 6.1.1. Platform
- 6.1.2. Services
- 6.2. Market Analysis, Insights and Forecast - by Deployment Type
- 6.2.1. On-Premise
- 6.2.2. Cloud
- 6.3. Market Analysis, Insights and Forecast - by End Users
- 6.3.1. Retail
- 6.3.2. IT and Telecom
- 6.3.3. BFSI
- 6.3.4. Healthcare
- 6.3.5. Other End Users
- 6.1. Market Analysis, Insights and Forecast - by Component
- 7. Europe Digital Experience Platform Market Analysis, Insights and Forecast, 2019-2031
- 7.1. Market Analysis, Insights and Forecast - by Component
- 7.1.1. Platform
- 7.1.2. Services
- 7.2. Market Analysis, Insights and Forecast - by Deployment Type
- 7.2.1. On-Premise
- 7.2.2. Cloud
- 7.3. Market Analysis, Insights and Forecast - by End Users
- 7.3.1. Retail
- 7.3.2. IT and Telecom
- 7.3.3. BFSI
- 7.3.4. Healthcare
- 7.3.5. Other End Users
- 7.1. Market Analysis, Insights and Forecast - by Component
- 8. Asia Digital Experience Platform Market Analysis, Insights and Forecast, 2019-2031
- 8.1. Market Analysis, Insights and Forecast - by Component
- 8.1.1. Platform
- 8.1.2. Services
- 8.2. Market Analysis, Insights and Forecast - by Deployment Type
- 8.2.1. On-Premise
- 8.2.2. Cloud
- 8.3. Market Analysis, Insights and Forecast - by End Users
- 8.3.1. Retail
- 8.3.2. IT and Telecom
- 8.3.3. BFSI
- 8.3.4. Healthcare
- 8.3.5. Other End Users
- 8.1. Market Analysis, Insights and Forecast - by Component
- 9. Australia and New Zealand Digital Experience Platform Market Analysis, Insights and Forecast, 2019-2031
- 9.1. Market Analysis, Insights and Forecast - by Component
- 9.1.1. Platform
- 9.1.2. Services
- 9.2. Market Analysis, Insights and Forecast - by Deployment Type
- 9.2.1. On-Premise
- 9.2.2. Cloud
- 9.3. Market Analysis, Insights and Forecast - by End Users
- 9.3.1. Retail
- 9.3.2. IT and Telecom
- 9.3.3. BFSI
- 9.3.4. Healthcare
- 9.3.5. Other End Users
- 9.1. Market Analysis, Insights and Forecast - by Component
- 10. Latin America Digital Experience Platform Market Analysis, Insights and Forecast, 2019-2031
- 10.1. Market Analysis, Insights and Forecast - by Component
- 10.1.1. Platform
- 10.1.2. Services
- 10.2. Market Analysis, Insights and Forecast - by Deployment Type
- 10.2.1. On-Premise
- 10.2.2. Cloud
- 10.3. Market Analysis, Insights and Forecast - by End Users
- 10.3.1. Retail
- 10.3.2. IT and Telecom
- 10.3.3. BFSI
- 10.3.4. Healthcare
- 10.3.5. Other End Users
- 10.1. Market Analysis, Insights and Forecast - by Component
- 11. Middle East and Africa Digital Experience Platform Market Analysis, Insights and Forecast, 2019-2031
- 11.1. Market Analysis, Insights and Forecast - by Component
- 11.1.1. Platform
- 11.1.2. Services
- 11.2. Market Analysis, Insights and Forecast - by Deployment Type
- 11.2.1. On-Premise
- 11.2.2. Cloud
- 11.3. Market Analysis, Insights and Forecast - by End Users
- 11.3.1. Retail
- 11.3.2. IT and Telecom
- 11.3.3. BFSI
- 11.3.4. Healthcare
- 11.3.5. Other End Users
- 11.1. Market Analysis, Insights and Forecast - by Component
- 12. North America Digital Experience Platform Market Analysis, Insights and Forecast, 2019-2031
- 12.1. Market Analysis, Insights and Forecast - By Country/Sub-region
- 12.1.1 United States
- 12.1.2 Canada
- 12.1.3 Mexico
- 13. Europe Digital Experience Platform Market Analysis, Insights and Forecast, 2019-2031
- 13.1. Market Analysis, Insights and Forecast - By Country/Sub-region
- 13.1.1 Germany
- 13.1.2 United Kingdom
- 13.1.3 France
- 13.1.4 Spain
- 13.1.5 Italy
- 13.1.6 Spain
- 13.1.7 Belgium
- 13.1.8 Netherland
- 13.1.9 Nordics
- 13.1.10 Rest of Europe
- 14. Asia Pacific Digital Experience Platform Market Analysis, Insights and Forecast, 2019-2031
- 14.1. Market Analysis, Insights and Forecast - By Country/Sub-region
- 14.1.1 China
- 14.1.2 Japan
- 14.1.3 India
- 14.1.4 South Korea
- 14.1.5 Southeast Asia
- 14.1.6 Australia
- 14.1.7 Indonesia
- 14.1.8 Phillipes
- 14.1.9 Singapore
- 14.1.10 Thailandc
- 14.1.11 Rest of Asia Pacific
- 15. South America Digital Experience Platform Market Analysis, Insights and Forecast, 2019-2031
- 15.1. Market Analysis, Insights and Forecast - By Country/Sub-region
- 15.1.1 Brazil
- 15.1.2 Argentina
- 15.1.3 Peru
- 15.1.4 Chile
- 15.1.5 Colombia
- 15.1.6 Ecuador
- 15.1.7 Venezuela
- 15.1.8 Rest of South America
- 16. North America Digital Experience Platform Market Analysis, Insights and Forecast, 2019-2031
- 16.1. Market Analysis, Insights and Forecast - By Country/Sub-region
- 16.1.1 United States
- 16.1.2 Canada
- 16.1.3 Mexico
- 17. MEA Digital Experience Platform Market Analysis, Insights and Forecast, 2019-2031
- 17.1. Market Analysis, Insights and Forecast - By Country/Sub-region
- 17.1.1 United Arab Emirates
- 17.1.2 Saudi Arabia
- 17.1.3 South Africa
- 17.1.4 Rest of Middle East and Africa
- 18. Competitive Analysis
- 18.1. Global Market Share Analysis 2024
- 18.2. Company Profiles
- 18.2.1 SDL PLC
- 18.2.1.1. Overview
- 18.2.1.2. Products
- 18.2.1.3. SWOT Analysis
- 18.2.1.4. Recent Developments
- 18.2.1.5. Financials (Based on Availability)
- 18.2.2 Salesforce Inc
- 18.2.2.1. Overview
- 18.2.2.2. Products
- 18.2.2.3. SWOT Analysis
- 18.2.2.4. Recent Developments
- 18.2.2.5. Financials (Based on Availability)
- 18.2.3 OpenText Corporation
- 18.2.3.1. Overview
- 18.2.3.2. Products
- 18.2.3.3. SWOT Analysis
- 18.2.3.4. Recent Developments
- 18.2.3.5. Financials (Based on Availability)
- 18.2.4 IBM Corporation
- 18.2.4.1. Overview
- 18.2.4.2. Products
- 18.2.4.3. SWOT Analysis
- 18.2.4.4. Recent Developments
- 18.2.4.5. Financials (Based on Availability)
- 18.2.5 Acqui
- 18.2.5.1. Overview
- 18.2.5.2. Products
- 18.2.5.3. SWOT Analysis
- 18.2.5.4. Recent Developments
- 18.2.5.5. Financials (Based on Availability)
- 18.2.6 Microsoft Corporation
- 18.2.6.1. Overview
- 18.2.6.2. Products
- 18.2.6.3. SWOT Analysis
- 18.2.6.4. Recent Developments
- 18.2.6.5. Financials (Based on Availability)
- 18.2.7 Adobe Inc
- 18.2.7.1. Overview
- 18.2.7.2. Products
- 18.2.7.3. SWOT Analysis
- 18.2.7.4. Recent Developments
- 18.2.7.5. Financials (Based on Availability)
- 18.2.8 Oracle Corporation
- 18.2.8.1. Overview
- 18.2.8.2. Products
- 18.2.8.3. SWOT Analysis
- 18.2.8.4. Recent Developments
- 18.2.8.5. Financials (Based on Availability)
- 18.2.9 Sitecore
- 18.2.9.1. Overview
- 18.2.9.2. Products
- 18.2.9.3. SWOT Analysis
- 18.2.9.4. Recent Developments
- 18.2.9.5. Financials (Based on Availability)
- 18.2.10 SAP SE
- 18.2.10.1. Overview
- 18.2.10.2. Products
- 18.2.10.3. SWOT Analysis
- 18.2.10.4. Recent Developments
- 18.2.10.5. Financials (Based on Availability)
- 18.2.1 SDL PLC
List of Figures
- Figure 1: Global Digital Experience Platform Market Revenue Breakdown (Million, %) by Region 2024 & 2032
- Figure 2: Global Digital Experience Platform Market Volume Breakdown (K Unit, %) by Region 2024 & 2032
- Figure 3: North America Digital Experience Platform Market Revenue (Million), by Country 2024 & 2032
- Figure 4: North America Digital Experience Platform Market Volume (K Unit), by Country 2024 & 2032
- Figure 5: North America Digital Experience Platform Market Revenue Share (%), by Country 2024 & 2032
- Figure 6: North America Digital Experience Platform Market Volume Share (%), by Country 2024 & 2032
- Figure 7: Europe Digital Experience Platform Market Revenue (Million), by Country 2024 & 2032
- Figure 8: Europe Digital Experience Platform Market Volume (K Unit), by Country 2024 & 2032
- Figure 9: Europe Digital Experience Platform Market Revenue Share (%), by Country 2024 & 2032
- Figure 10: Europe Digital Experience Platform Market Volume Share (%), by Country 2024 & 2032
- Figure 11: Asia Pacific Digital Experience Platform Market Revenue (Million), by Country 2024 & 2032
- Figure 12: Asia Pacific Digital Experience Platform Market Volume (K Unit), by Country 2024 & 2032
- Figure 13: Asia Pacific Digital Experience Platform Market Revenue Share (%), by Country 2024 & 2032
- Figure 14: Asia Pacific Digital Experience Platform Market Volume Share (%), by Country 2024 & 2032
- Figure 15: South America Digital Experience Platform Market Revenue (Million), by Country 2024 & 2032
- Figure 16: South America Digital Experience Platform Market Volume (K Unit), by Country 2024 & 2032
- Figure 17: South America Digital Experience Platform Market Revenue Share (%), by Country 2024 & 2032
- Figure 18: South America Digital Experience Platform Market Volume Share (%), by Country 2024 & 2032
- Figure 19: North America Digital Experience Platform Market Revenue (Million), by Country 2024 & 2032
- Figure 20: North America Digital Experience Platform Market Volume (K Unit), by Country 2024 & 2032
- Figure 21: North America Digital Experience Platform Market Revenue Share (%), by Country 2024 & 2032
- Figure 22: North America Digital Experience Platform Market Volume Share (%), by Country 2024 & 2032
- Figure 23: MEA Digital Experience Platform Market Revenue (Million), by Country 2024 & 2032
- Figure 24: MEA Digital Experience Platform Market Volume (K Unit), by Country 2024 & 2032
- Figure 25: MEA Digital Experience Platform Market Revenue Share (%), by Country 2024 & 2032
- Figure 26: MEA Digital Experience Platform Market Volume Share (%), by Country 2024 & 2032
- Figure 27: North America Digital Experience Platform Market Revenue (Million), by Component 2024 & 2032
- Figure 28: North America Digital Experience Platform Market Volume (K Unit), by Component 2024 & 2032
- Figure 29: North America Digital Experience Platform Market Revenue Share (%), by Component 2024 & 2032
- Figure 30: North America Digital Experience Platform Market Volume Share (%), by Component 2024 & 2032
- Figure 31: North America Digital Experience Platform Market Revenue (Million), by Deployment Type 2024 & 2032
- Figure 32: North America Digital Experience Platform Market Volume (K Unit), by Deployment Type 2024 & 2032
- Figure 33: North America Digital Experience Platform Market Revenue Share (%), by Deployment Type 2024 & 2032
- Figure 34: North America Digital Experience Platform Market Volume Share (%), by Deployment Type 2024 & 2032
- Figure 35: North America Digital Experience Platform Market Revenue (Million), by End Users 2024 & 2032
- Figure 36: North America Digital Experience Platform Market Volume (K Unit), by End Users 2024 & 2032
- Figure 37: North America Digital Experience Platform Market Revenue Share (%), by End Users 2024 & 2032
- Figure 38: North America Digital Experience Platform Market Volume Share (%), by End Users 2024 & 2032
- Figure 39: North America Digital Experience Platform Market Revenue (Million), by Country 2024 & 2032
- Figure 40: North America Digital Experience Platform Market Volume (K Unit), by Country 2024 & 2032
- Figure 41: North America Digital Experience Platform Market Revenue Share (%), by Country 2024 & 2032
- Figure 42: North America Digital Experience Platform Market Volume Share (%), by Country 2024 & 2032
- Figure 43: Europe Digital Experience Platform Market Revenue (Million), by Component 2024 & 2032
- Figure 44: Europe Digital Experience Platform Market Volume (K Unit), by Component 2024 & 2032
- Figure 45: Europe Digital Experience Platform Market Revenue Share (%), by Component 2024 & 2032
- Figure 46: Europe Digital Experience Platform Market Volume Share (%), by Component 2024 & 2032
- Figure 47: Europe Digital Experience Platform Market Revenue (Million), by Deployment Type 2024 & 2032
- Figure 48: Europe Digital Experience Platform Market Volume (K Unit), by Deployment Type 2024 & 2032
- Figure 49: Europe Digital Experience Platform Market Revenue Share (%), by Deployment Type 2024 & 2032
- Figure 50: Europe Digital Experience Platform Market Volume Share (%), by Deployment Type 2024 & 2032
- Figure 51: Europe Digital Experience Platform Market Revenue (Million), by End Users 2024 & 2032
- Figure 52: Europe Digital Experience Platform Market Volume (K Unit), by End Users 2024 & 2032
- Figure 53: Europe Digital Experience Platform Market Revenue Share (%), by End Users 2024 & 2032
- Figure 54: Europe Digital Experience Platform Market Volume Share (%), by End Users 2024 & 2032
- Figure 55: Europe Digital Experience Platform Market Revenue (Million), by Country 2024 & 2032
- Figure 56: Europe Digital Experience Platform Market Volume (K Unit), by Country 2024 & 2032
- Figure 57: Europe Digital Experience Platform Market Revenue Share (%), by Country 2024 & 2032
- Figure 58: Europe Digital Experience Platform Market Volume Share (%), by Country 2024 & 2032
- Figure 59: Asia Digital Experience Platform Market Revenue (Million), by Component 2024 & 2032
- Figure 60: Asia Digital Experience Platform Market Volume (K Unit), by Component 2024 & 2032
- Figure 61: Asia Digital Experience Platform Market Revenue Share (%), by Component 2024 & 2032
- Figure 62: Asia Digital Experience Platform Market Volume Share (%), by Component 2024 & 2032
- Figure 63: Asia Digital Experience Platform Market Revenue (Million), by Deployment Type 2024 & 2032
- Figure 64: Asia Digital Experience Platform Market Volume (K Unit), by Deployment Type 2024 & 2032
- Figure 65: Asia Digital Experience Platform Market Revenue Share (%), by Deployment Type 2024 & 2032
- Figure 66: Asia Digital Experience Platform Market Volume Share (%), by Deployment Type 2024 & 2032
- Figure 67: Asia Digital Experience Platform Market Revenue (Million), by End Users 2024 & 2032
- Figure 68: Asia Digital Experience Platform Market Volume (K Unit), by End Users 2024 & 2032
- Figure 69: Asia Digital Experience Platform Market Revenue Share (%), by End Users 2024 & 2032
- Figure 70: Asia Digital Experience Platform Market Volume Share (%), by End Users 2024 & 2032
- Figure 71: Asia Digital Experience Platform Market Revenue (Million), by Country 2024 & 2032
- Figure 72: Asia Digital Experience Platform Market Volume (K Unit), by Country 2024 & 2032
- Figure 73: Asia Digital Experience Platform Market Revenue Share (%), by Country 2024 & 2032
- Figure 74: Asia Digital Experience Platform Market Volume Share (%), by Country 2024 & 2032
- Figure 75: Australia and New Zealand Digital Experience Platform Market Revenue (Million), by Component 2024 & 2032
- Figure 76: Australia and New Zealand Digital Experience Platform Market Volume (K Unit), by Component 2024 & 2032
- Figure 77: Australia and New Zealand Digital Experience Platform Market Revenue Share (%), by Component 2024 & 2032
- Figure 78: Australia and New Zealand Digital Experience Platform Market Volume Share (%), by Component 2024 & 2032
- Figure 79: Australia and New Zealand Digital Experience Platform Market Revenue (Million), by Deployment Type 2024 & 2032
- Figure 80: Australia and New Zealand Digital Experience Platform Market Volume (K Unit), by Deployment Type 2024 & 2032
- Figure 81: Australia and New Zealand Digital Experience Platform Market Revenue Share (%), by Deployment Type 2024 & 2032
- Figure 82: Australia and New Zealand Digital Experience Platform Market Volume Share (%), by Deployment Type 2024 & 2032
- Figure 83: Australia and New Zealand Digital Experience Platform Market Revenue (Million), by End Users 2024 & 2032
- Figure 84: Australia and New Zealand Digital Experience Platform Market Volume (K Unit), by End Users 2024 & 2032
- Figure 85: Australia and New Zealand Digital Experience Platform Market Revenue Share (%), by End Users 2024 & 2032
- Figure 86: Australia and New Zealand Digital Experience Platform Market Volume Share (%), by End Users 2024 & 2032
- Figure 87: Australia and New Zealand Digital Experience Platform Market Revenue (Million), by Country 2024 & 2032
- Figure 88: Australia and New Zealand Digital Experience Platform Market Volume (K Unit), by Country 2024 & 2032
- Figure 89: Australia and New Zealand Digital Experience Platform Market Revenue Share (%), by Country 2024 & 2032
- Figure 90: Australia and New Zealand Digital Experience Platform Market Volume Share (%), by Country 2024 & 2032
- Figure 91: Latin America Digital Experience Platform Market Revenue (Million), by Component 2024 & 2032
- Figure 92: Latin America Digital Experience Platform Market Volume (K Unit), by Component 2024 & 2032
- Figure 93: Latin America Digital Experience Platform Market Revenue Share (%), by Component 2024 & 2032
- Figure 94: Latin America Digital Experience Platform Market Volume Share (%), by Component 2024 & 2032
- Figure 95: Latin America Digital Experience Platform Market Revenue (Million), by Deployment Type 2024 & 2032
- Figure 96: Latin America Digital Experience Platform Market Volume (K Unit), by Deployment Type 2024 & 2032
- Figure 97: Latin America Digital Experience Platform Market Revenue Share (%), by Deployment Type 2024 & 2032
- Figure 98: Latin America Digital Experience Platform Market Volume Share (%), by Deployment Type 2024 & 2032
- Figure 99: Latin America Digital Experience Platform Market Revenue (Million), by End Users 2024 & 2032
- Figure 100: Latin America Digital Experience Platform Market Volume (K Unit), by End Users 2024 & 2032
- Figure 101: Latin America Digital Experience Platform Market Revenue Share (%), by End Users 2024 & 2032
- Figure 102: Latin America Digital Experience Platform Market Volume Share (%), by End Users 2024 & 2032
- Figure 103: Latin America Digital Experience Platform Market Revenue (Million), by Country 2024 & 2032
- Figure 104: Latin America Digital Experience Platform Market Volume (K Unit), by Country 2024 & 2032
- Figure 105: Latin America Digital Experience Platform Market Revenue Share (%), by Country 2024 & 2032
- Figure 106: Latin America Digital Experience Platform Market Volume Share (%), by Country 2024 & 2032
- Figure 107: Middle East and Africa Digital Experience Platform Market Revenue (Million), by Component 2024 & 2032
- Figure 108: Middle East and Africa Digital Experience Platform Market Volume (K Unit), by Component 2024 & 2032
- Figure 109: Middle East and Africa Digital Experience Platform Market Revenue Share (%), by Component 2024 & 2032
- Figure 110: Middle East and Africa Digital Experience Platform Market Volume Share (%), by Component 2024 & 2032
- Figure 111: Middle East and Africa Digital Experience Platform Market Revenue (Million), by Deployment Type 2024 & 2032
- Figure 112: Middle East and Africa Digital Experience Platform Market Volume (K Unit), by Deployment Type 2024 & 2032
- Figure 113: Middle East and Africa Digital Experience Platform Market Revenue Share (%), by Deployment Type 2024 & 2032
- Figure 114: Middle East and Africa Digital Experience Platform Market Volume Share (%), by Deployment Type 2024 & 2032
- Figure 115: Middle East and Africa Digital Experience Platform Market Revenue (Million), by End Users 2024 & 2032
- Figure 116: Middle East and Africa Digital Experience Platform Market Volume (K Unit), by End Users 2024 & 2032
- Figure 117: Middle East and Africa Digital Experience Platform Market Revenue Share (%), by End Users 2024 & 2032
- Figure 118: Middle East and Africa Digital Experience Platform Market Volume Share (%), by End Users 2024 & 2032
- Figure 119: Middle East and Africa Digital Experience Platform Market Revenue (Million), by Country 2024 & 2032
- Figure 120: Middle East and Africa Digital Experience Platform Market Volume (K Unit), by Country 2024 & 2032
- Figure 121: Middle East and Africa Digital Experience Platform Market Revenue Share (%), by Country 2024 & 2032
- Figure 122: Middle East and Africa Digital Experience Platform Market Volume Share (%), by Country 2024 & 2032
List of Tables
- Table 1: Global Digital Experience Platform Market Revenue Million Forecast, by Region 2019 & 2032
- Table 2: Global Digital Experience Platform Market Volume K Unit Forecast, by Region 2019 & 2032
- Table 3: Global Digital Experience Platform Market Revenue Million Forecast, by Component 2019 & 2032
- Table 4: Global Digital Experience Platform Market Volume K Unit Forecast, by Component 2019 & 2032
- Table 5: Global Digital Experience Platform Market Revenue Million Forecast, by Deployment Type 2019 & 2032
- Table 6: Global Digital Experience Platform Market Volume K Unit Forecast, by Deployment Type 2019 & 2032
- Table 7: Global Digital Experience Platform Market Revenue Million Forecast, by End Users 2019 & 2032
- Table 8: Global Digital Experience Platform Market Volume K Unit Forecast, by End Users 2019 & 2032
- Table 9: Global Digital Experience Platform Market Revenue Million Forecast, by Region 2019 & 2032
- Table 10: Global Digital Experience Platform Market Volume K Unit Forecast, by Region 2019 & 2032
- Table 11: Global Digital Experience Platform Market Revenue Million Forecast, by Country 2019 & 2032
- Table 12: Global Digital Experience Platform Market Volume K Unit Forecast, by Country 2019 & 2032
- Table 13: United States Digital Experience Platform Market Revenue (Million) Forecast, by Application 2019 & 2032
- Table 14: United States Digital Experience Platform Market Volume (K Unit) Forecast, by Application 2019 & 2032
- Table 15: Canada Digital Experience Platform Market Revenue (Million) Forecast, by Application 2019 & 2032
- Table 16: Canada Digital Experience Platform Market Volume (K Unit) Forecast, by Application 2019 & 2032
- Table 17: Mexico Digital Experience Platform Market Revenue (Million) Forecast, by Application 2019 & 2032
- Table 18: Mexico Digital Experience Platform Market Volume (K Unit) Forecast, by Application 2019 & 2032
- Table 19: Global Digital Experience Platform Market Revenue Million Forecast, by Country 2019 & 2032
- Table 20: Global Digital Experience Platform Market Volume K Unit Forecast, by Country 2019 & 2032
- Table 21: Germany Digital Experience Platform Market Revenue (Million) Forecast, by Application 2019 & 2032
- Table 22: Germany Digital Experience Platform Market Volume (K Unit) Forecast, by Application 2019 & 2032
- Table 23: United Kingdom Digital Experience Platform Market Revenue (Million) Forecast, by Application 2019 & 2032
- Table 24: United Kingdom Digital Experience Platform Market Volume (K Unit) Forecast, by Application 2019 & 2032
- Table 25: France Digital Experience Platform Market Revenue (Million) Forecast, by Application 2019 & 2032
- Table 26: France Digital Experience Platform Market Volume (K Unit) Forecast, by Application 2019 & 2032
- Table 27: Spain Digital Experience Platform Market Revenue (Million) Forecast, by Application 2019 & 2032
- Table 28: Spain Digital Experience Platform Market Volume (K Unit) Forecast, by Application 2019 & 2032
- Table 29: Italy Digital Experience Platform Market Revenue (Million) Forecast, by Application 2019 & 2032
- Table 30: Italy Digital Experience Platform Market Volume (K Unit) Forecast, by Application 2019 & 2032
- Table 31: Spain Digital Experience Platform Market Revenue (Million) Forecast, by Application 2019 & 2032
- Table 32: Spain Digital Experience Platform Market Volume (K Unit) Forecast, by Application 2019 & 2032
- Table 33: Belgium Digital Experience Platform Market Revenue (Million) Forecast, by Application 2019 & 2032
- Table 34: Belgium Digital Experience Platform Market Volume (K Unit) Forecast, by Application 2019 & 2032
- Table 35: Netherland Digital Experience Platform Market Revenue (Million) Forecast, by Application 2019 & 2032
- Table 36: Netherland Digital Experience Platform Market Volume (K Unit) Forecast, by Application 2019 & 2032
- Table 37: Nordics Digital Experience Platform Market Revenue (Million) Forecast, by Application 2019 & 2032
- Table 38: Nordics Digital Experience Platform Market Volume (K Unit) Forecast, by Application 2019 & 2032
- Table 39: Rest of Europe Digital Experience Platform Market Revenue (Million) Forecast, by Application 2019 & 2032
- Table 40: Rest of Europe Digital Experience Platform Market Volume (K Unit) Forecast, by Application 2019 & 2032
- Table 41: Global Digital Experience Platform Market Revenue Million Forecast, by Country 2019 & 2032
- Table 42: Global Digital Experience Platform Market Volume K Unit Forecast, by Country 2019 & 2032
- Table 43: China Digital Experience Platform Market Revenue (Million) Forecast, by Application 2019 & 2032
- Table 44: China Digital Experience Platform Market Volume (K Unit) Forecast, by Application 2019 & 2032
- Table 45: Japan Digital Experience Platform Market Revenue (Million) Forecast, by Application 2019 & 2032
- Table 46: Japan Digital Experience Platform Market Volume (K Unit) Forecast, by Application 2019 & 2032
- Table 47: India Digital Experience Platform Market Revenue (Million) Forecast, by Application 2019 & 2032
- Table 48: India Digital Experience Platform Market Volume (K Unit) Forecast, by Application 2019 & 2032
- Table 49: South Korea Digital Experience Platform Market Revenue (Million) Forecast, by Application 2019 & 2032
- Table 50: South Korea Digital Experience Platform Market Volume (K Unit) Forecast, by Application 2019 & 2032
- Table 51: Southeast Asia Digital Experience Platform Market Revenue (Million) Forecast, by Application 2019 & 2032
- Table 52: Southeast Asia Digital Experience Platform Market Volume (K Unit) Forecast, by Application 2019 & 2032
- Table 53: Australia Digital Experience Platform Market Revenue (Million) Forecast, by Application 2019 & 2032
- Table 54: Australia Digital Experience Platform Market Volume (K Unit) Forecast, by Application 2019 & 2032
- Table 55: Indonesia Digital Experience Platform Market Revenue (Million) Forecast, by Application 2019 & 2032
- Table 56: Indonesia Digital Experience Platform Market Volume (K Unit) Forecast, by Application 2019 & 2032
- Table 57: Phillipes Digital Experience Platform Market Revenue (Million) Forecast, by Application 2019 & 2032
- Table 58: Phillipes Digital Experience Platform Market Volume (K Unit) Forecast, by Application 2019 & 2032
- Table 59: Singapore Digital Experience Platform Market Revenue (Million) Forecast, by Application 2019 & 2032
- Table 60: Singapore Digital Experience Platform Market Volume (K Unit) Forecast, by Application 2019 & 2032
- Table 61: Thailandc Digital Experience Platform Market Revenue (Million) Forecast, by Application 2019 & 2032
- Table 62: Thailandc Digital Experience Platform Market Volume (K Unit) Forecast, by Application 2019 & 2032
- Table 63: Rest of Asia Pacific Digital Experience Platform Market Revenue (Million) Forecast, by Application 2019 & 2032
- Table 64: Rest of Asia Pacific Digital Experience Platform Market Volume (K Unit) Forecast, by Application 2019 & 2032
- Table 65: Global Digital Experience Platform Market Revenue Million Forecast, by Country 2019 & 2032
- Table 66: Global Digital Experience Platform Market Volume K Unit Forecast, by Country 2019 & 2032
- Table 67: Brazil Digital Experience Platform Market Revenue (Million) Forecast, by Application 2019 & 2032
- Table 68: Brazil Digital Experience Platform Market Volume (K Unit) Forecast, by Application 2019 & 2032
- Table 69: Argentina Digital Experience Platform Market Revenue (Million) Forecast, by Application 2019 & 2032
- Table 70: Argentina Digital Experience Platform Market Volume (K Unit) Forecast, by Application 2019 & 2032
- Table 71: Peru Digital Experience Platform Market Revenue (Million) Forecast, by Application 2019 & 2032
- Table 72: Peru Digital Experience Platform Market Volume (K Unit) Forecast, by Application 2019 & 2032
- Table 73: Chile Digital Experience Platform Market Revenue (Million) Forecast, by Application 2019 & 2032
- Table 74: Chile Digital Experience Platform Market Volume (K Unit) Forecast, by Application 2019 & 2032
- Table 75: Colombia Digital Experience Platform Market Revenue (Million) Forecast, by Application 2019 & 2032
- Table 76: Colombia Digital Experience Platform Market Volume (K Unit) Forecast, by Application 2019 & 2032
- Table 77: Ecuador Digital Experience Platform Market Revenue (Million) Forecast, by Application 2019 & 2032
- Table 78: Ecuador Digital Experience Platform Market Volume (K Unit) Forecast, by Application 2019 & 2032
- Table 79: Venezuela Digital Experience Platform Market Revenue (Million) Forecast, by Application 2019 & 2032
- Table 80: Venezuela Digital Experience Platform Market Volume (K Unit) Forecast, by Application 2019 & 2032
- Table 81: Rest of South America Digital Experience Platform Market Revenue (Million) Forecast, by Application 2019 & 2032
- Table 82: Rest of South America Digital Experience Platform Market Volume (K Unit) Forecast, by Application 2019 & 2032
- Table 83: Global Digital Experience Platform Market Revenue Million Forecast, by Country 2019 & 2032
- Table 84: Global Digital Experience Platform Market Volume K Unit Forecast, by Country 2019 & 2032
- Table 85: United States Digital Experience Platform Market Revenue (Million) Forecast, by Application 2019 & 2032
- Table 86: United States Digital Experience Platform Market Volume (K Unit) Forecast, by Application 2019 & 2032
- Table 87: Canada Digital Experience Platform Market Revenue (Million) Forecast, by Application 2019 & 2032
- Table 88: Canada Digital Experience Platform Market Volume (K Unit) Forecast, by Application 2019 & 2032
- Table 89: Mexico Digital Experience Platform Market Revenue (Million) Forecast, by Application 2019 & 2032
- Table 90: Mexico Digital Experience Platform Market Volume (K Unit) Forecast, by Application 2019 & 2032
- Table 91: Global Digital Experience Platform Market Revenue Million Forecast, by Country 2019 & 2032
- Table 92: Global Digital Experience Platform Market Volume K Unit Forecast, by Country 2019 & 2032
- Table 93: United Arab Emirates Digital Experience Platform Market Revenue (Million) Forecast, by Application 2019 & 2032
- Table 94: United Arab Emirates Digital Experience Platform Market Volume (K Unit) Forecast, by Application 2019 & 2032
- Table 95: Saudi Arabia Digital Experience Platform Market Revenue (Million) Forecast, by Application 2019 & 2032
- Table 96: Saudi Arabia Digital Experience Platform Market Volume (K Unit) Forecast, by Application 2019 & 2032
- Table 97: South Africa Digital Experience Platform Market Revenue (Million) Forecast, by Application 2019 & 2032
- Table 98: South Africa Digital Experience Platform Market Volume (K Unit) Forecast, by Application 2019 & 2032
- Table 99: Rest of Middle East and Africa Digital Experience Platform Market Revenue (Million) Forecast, by Application 2019 & 2032
- Table 100: Rest of Middle East and Africa Digital Experience Platform Market Volume (K Unit) Forecast, by Application 2019 & 2032
- Table 101: Global Digital Experience Platform Market Revenue Million Forecast, by Component 2019 & 2032
- Table 102: Global Digital Experience Platform Market Volume K Unit Forecast, by Component 2019 & 2032
- Table 103: Global Digital Experience Platform Market Revenue Million Forecast, by Deployment Type 2019 & 2032
- Table 104: Global Digital Experience Platform Market Volume K Unit Forecast, by Deployment Type 2019 & 2032
- Table 105: Global Digital Experience Platform Market Revenue Million Forecast, by End Users 2019 & 2032
- Table 106: Global Digital Experience Platform Market Volume K Unit Forecast, by End Users 2019 & 2032
- Table 107: Global Digital Experience Platform Market Revenue Million Forecast, by Country 2019 & 2032
- Table 108: Global Digital Experience Platform Market Volume K Unit Forecast, by Country 2019 & 2032
- Table 109: Global Digital Experience Platform Market Revenue Million Forecast, by Component 2019 & 2032
- Table 110: Global Digital Experience Platform Market Volume K Unit Forecast, by Component 2019 & 2032
- Table 111: Global Digital Experience Platform Market Revenue Million Forecast, by Deployment Type 2019 & 2032
- Table 112: Global Digital Experience Platform Market Volume K Unit Forecast, by Deployment Type 2019 & 2032
- Table 113: Global Digital Experience Platform Market Revenue Million Forecast, by End Users 2019 & 2032
- Table 114: Global Digital Experience Platform Market Volume K Unit Forecast, by End Users 2019 & 2032
- Table 115: Global Digital Experience Platform Market Revenue Million Forecast, by Country 2019 & 2032
- Table 116: Global Digital Experience Platform Market Volume K Unit Forecast, by Country 2019 & 2032
- Table 117: Global Digital Experience Platform Market Revenue Million Forecast, by Component 2019 & 2032
- Table 118: Global Digital Experience Platform Market Volume K Unit Forecast, by Component 2019 & 2032
- Table 119: Global Digital Experience Platform Market Revenue Million Forecast, by Deployment Type 2019 & 2032
- Table 120: Global Digital Experience Platform Market Volume K Unit Forecast, by Deployment Type 2019 & 2032
- Table 121: Global Digital Experience Platform Market Revenue Million Forecast, by End Users 2019 & 2032
- Table 122: Global Digital Experience Platform Market Volume K Unit Forecast, by End Users 2019 & 2032
- Table 123: Global Digital Experience Platform Market Revenue Million Forecast, by Country 2019 & 2032
- Table 124: Global Digital Experience Platform Market Volume K Unit Forecast, by Country 2019 & 2032
- Table 125: Global Digital Experience Platform Market Revenue Million Forecast, by Component 2019 & 2032
- Table 126: Global Digital Experience Platform Market Volume K Unit Forecast, by Component 2019 & 2032
- Table 127: Global Digital Experience Platform Market Revenue Million Forecast, by Deployment Type 2019 & 2032
- Table 128: Global Digital Experience Platform Market Volume K Unit Forecast, by Deployment Type 2019 & 2032
- Table 129: Global Digital Experience Platform Market Revenue Million Forecast, by End Users 2019 & 2032
- Table 130: Global Digital Experience Platform Market Volume K Unit Forecast, by End Users 2019 & 2032
- Table 131: Global Digital Experience Platform Market Revenue Million Forecast, by Country 2019 & 2032
- Table 132: Global Digital Experience Platform Market Volume K Unit Forecast, by Country 2019 & 2032
- Table 133: Global Digital Experience Platform Market Revenue Million Forecast, by Component 2019 & 2032
- Table 134: Global Digital Experience Platform Market Volume K Unit Forecast, by Component 2019 & 2032
- Table 135: Global Digital Experience Platform Market Revenue Million Forecast, by Deployment Type 2019 & 2032
- Table 136: Global Digital Experience Platform Market Volume K Unit Forecast, by Deployment Type 2019 & 2032
- Table 137: Global Digital Experience Platform Market Revenue Million Forecast, by End Users 2019 & 2032
- Table 138: Global Digital Experience Platform Market Volume K Unit Forecast, by End Users 2019 & 2032
- Table 139: Global Digital Experience Platform Market Revenue Million Forecast, by Country 2019 & 2032
- Table 140: Global Digital Experience Platform Market Volume K Unit Forecast, by Country 2019 & 2032
- Table 141: Global Digital Experience Platform Market Revenue Million Forecast, by Component 2019 & 2032
- Table 142: Global Digital Experience Platform Market Volume K Unit Forecast, by Component 2019 & 2032
- Table 143: Global Digital Experience Platform Market Revenue Million Forecast, by Deployment Type 2019 & 2032
- Table 144: Global Digital Experience Platform Market Volume K Unit Forecast, by Deployment Type 2019 & 2032
- Table 145: Global Digital Experience Platform Market Revenue Million Forecast, by End Users 2019 & 2032
- Table 146: Global Digital Experience Platform Market Volume K Unit Forecast, by End Users 2019 & 2032
- Table 147: Global Digital Experience Platform Market Revenue Million Forecast, by Country 2019 & 2032
- Table 148: Global Digital Experience Platform Market Volume K Unit Forecast, by Country 2019 & 2032
Frequently Asked Questions
1. What is the projected Compound Annual Growth Rate (CAGR) of the Digital Experience Platform Market?
The projected CAGR is approximately 13.48%.
2. Which companies are prominent players in the Digital Experience Platform Market?
Key companies in the market include SDL PLC, Salesforce Inc, OpenText Corporation, IBM Corporation, Acqui, Microsoft Corporation, Adobe Inc, Oracle Corporation, Sitecore, SAP SE.
3. What are the main segments of the Digital Experience Platform Market?
The market segments include Component, Deployment Type, End Users.
4. Can you provide details about the market size?
The market size is estimated to be USD 14.08 Million as of 2022.
5. What are some drivers contributing to market growth?
Growing Deployment of Cloud-Based Solutions; Rising Demand for big Data Analytics.
6. What are the notable trends driving market growth?
On Cloud Deployment to Drive the Market Growth.
7. Are there any restraints impacting market growth?
Privacy and Data Security Issues.
8. Can you provide examples of recent developments in the market?
December 2022- The Bank of Thailand (BOT) has chosen Oracle Fusion Cloud Human Capital Management (HCM), a comprehensive HR system, to promote a digital workforce with a better employee experience. The BOT can reduce manual processes and improve workflows with Oracle Cloud HCM.
9. What pricing options are available for accessing the report?
Pricing options include single-user, multi-user, and enterprise licenses priced at USD 4750, USD 5250, and USD 8750 respectively.
10. Is the market size provided in terms of value or volume?
The market size is provided in terms of value, measured in Million and volume, measured in K Unit.
11. Are there any specific market keywords associated with the report?
Yes, the market keyword associated with the report is "Digital Experience Platform Market," which aids in identifying and referencing the specific market segment covered.
12. How do I determine which pricing option suits my needs best?
The pricing options vary based on user requirements and access needs. Individual users may opt for single-user licenses, while businesses requiring broader access may choose multi-user or enterprise licenses for cost-effective access to the report.
13. Are there any additional resources or data provided in the Digital Experience Platform Market report?
While the report offers comprehensive insights, it's advisable to review the specific contents or supplementary materials provided to ascertain if additional resources or data are available.
14. How can I stay updated on further developments or reports in the Digital Experience Platform Market?
To stay informed about further developments, trends, and reports in the Digital Experience Platform Market, consider subscribing to industry newsletters, following relevant companies and organizations, or regularly checking reputable industry news sources and publications.
Methodology
Step 1 - Identification of Relevant Samples Size from Population Database


Step 2 - Approaches for Defining Global Market Size (Value, Volume* & Price*)

Note*: In applicable scenarios
Step 3 - Data Sources
Primary Research
- Web Analytics
- Survey Reports
- Research Institute
- Latest Research Reports
- Opinion Leaders
Secondary Research
- Annual Reports
- White Paper
- Latest Press Release
- Industry Association
- Paid Database
- Investor Presentations

Step 4 - Data Triangulation
Involves using different sources of information in order to increase the validity of a study
These sources are likely to be stakeholders in a program - participants, other researchers, program staff, other community members, and so on.
Then we put all data in single framework & apply various statistical tools to find out the dynamic on the market.
During the analysis stage, feedback from the stakeholder groups would be compared to determine areas of agreement as well as areas of divergence


