
Key Insights
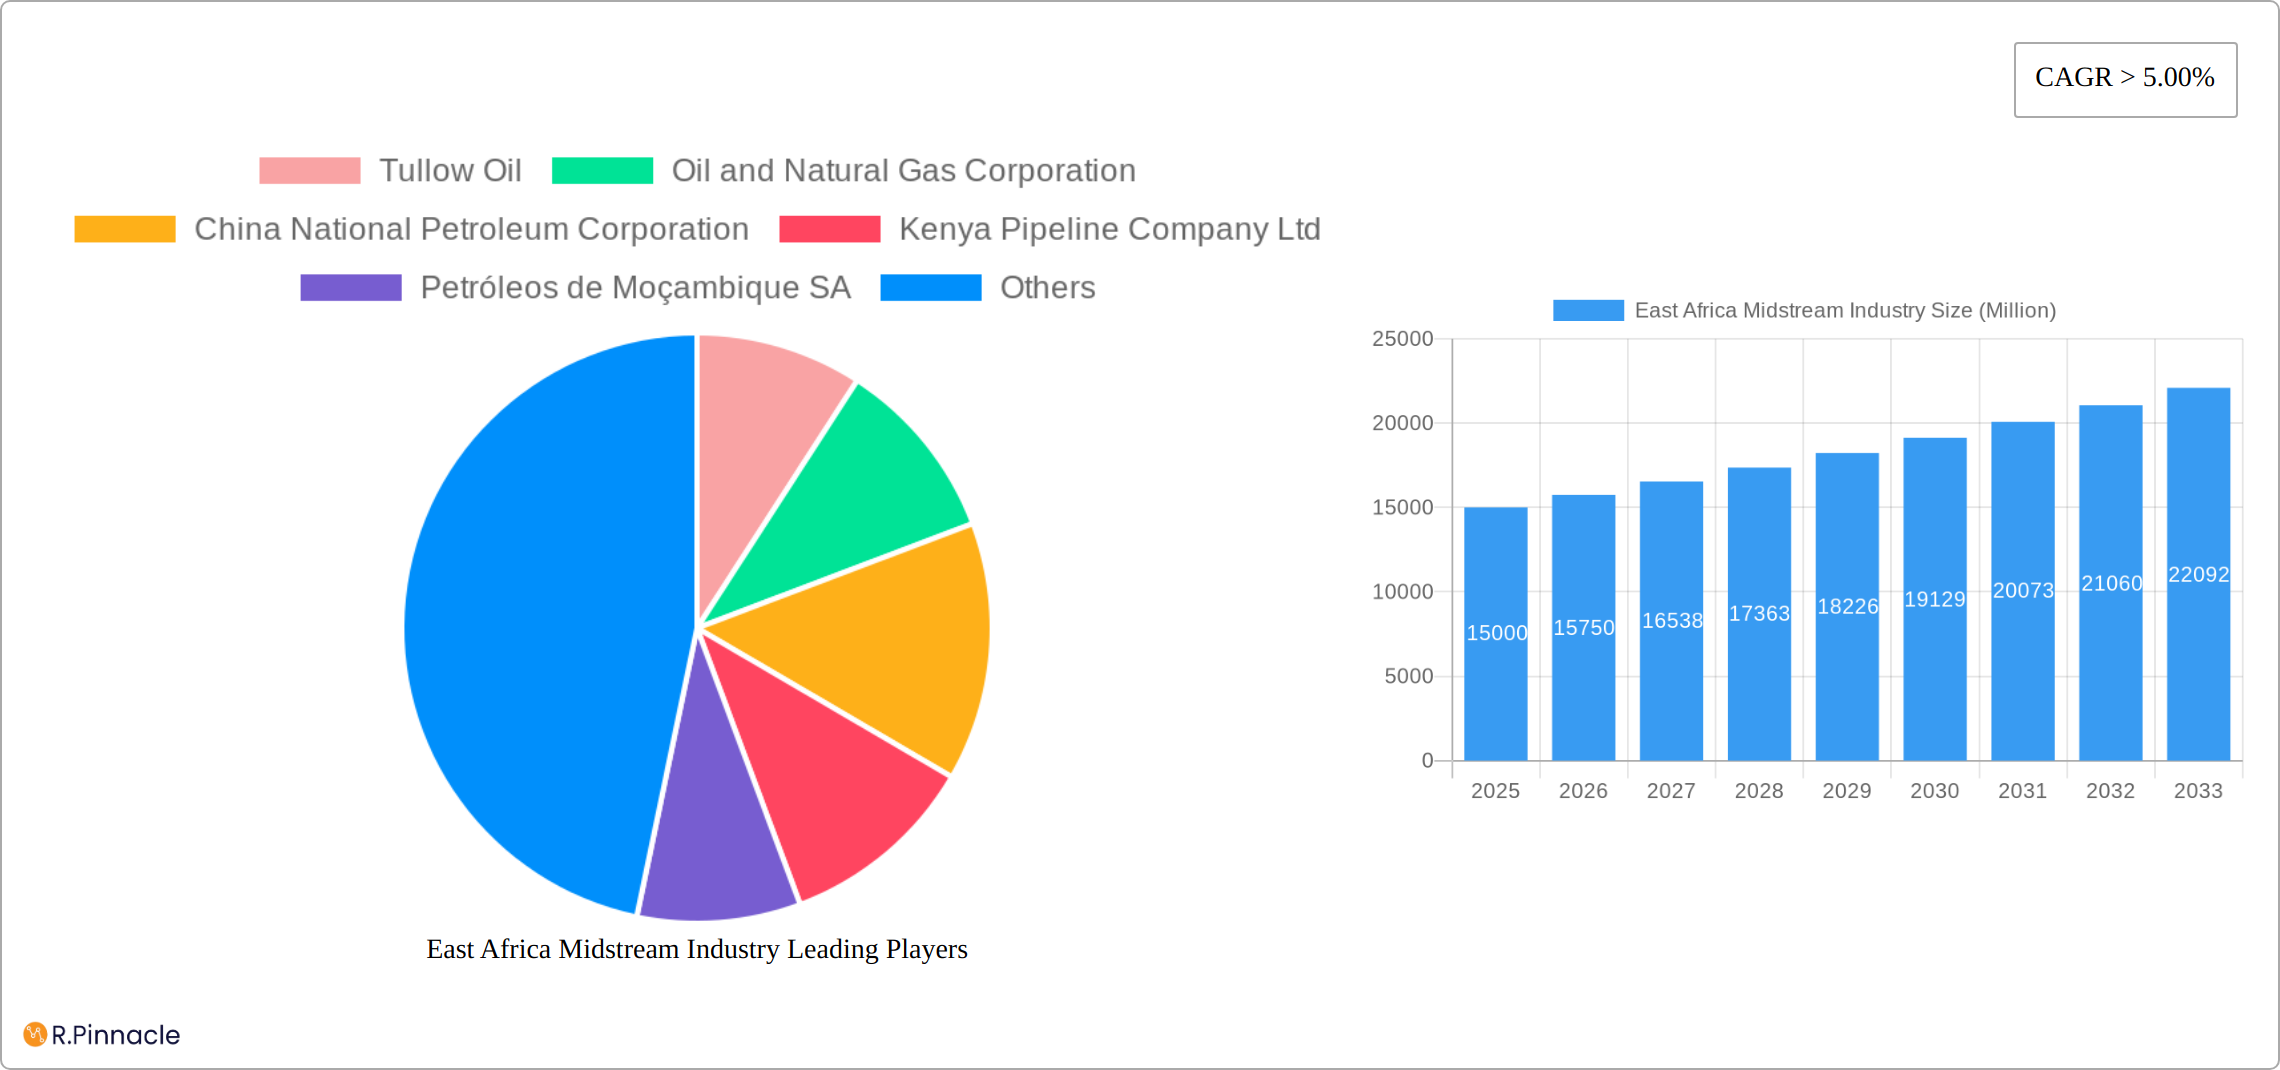
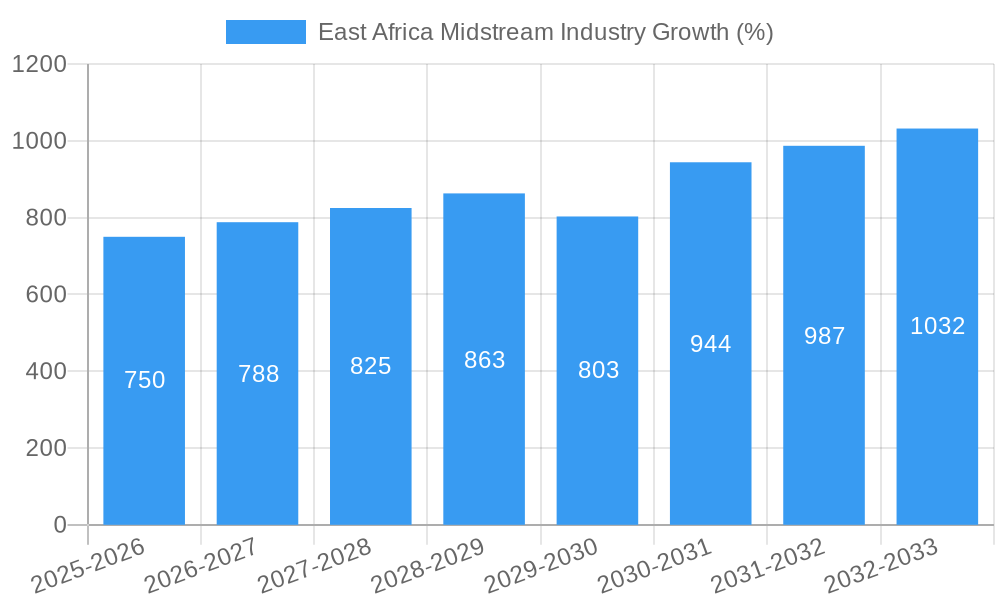
The East African midstream oil and gas industry is experiencing robust growth, driven by increasing domestic energy demand and significant upstream exploration successes across the region. A compound annual growth rate (CAGR) exceeding 5% from 2019 to 2033, points to a substantial market expansion. Key drivers include burgeoning industrialization, particularly in Kenya, Tanzania, and Uganda, coupled with growing transportation sectors reliant on petroleum products. The development of major pipeline infrastructure projects, crucial for transporting crude oil and refined products, is further fueling this growth. While regulatory complexities and infrastructure limitations in some countries present challenges, the overall outlook remains positive. The market is segmented by product (oil, natural gas, refined products) and application (power generation, industrial, transportation). Major players like Tullow Oil, Oil and Natural Gas Corporation, and TotalEnergies are actively shaping the industry landscape, while regional players such as Kenya Pipeline Company Ltd and Petróleos de Moçambique SA are contributing to the local market dynamics. The Rest of Africa segment likely accounts for a significant share due to its larger population and industrial capacity but needs detailed data for an accurate assessment.
Significant opportunities exist for investment in pipeline expansion, refinery modernization, and the development of related infrastructure. The increasing focus on regional energy security and the potential for gas monetization through liquefied natural gas (LNG) projects further enhance the long-term prospects of the East African midstream sector. However, consistent regulatory frameworks, sustainable environmental practices, and strong international collaborations will be crucial for ensuring sustained and responsible growth. The successful execution of large-scale projects, coupled with effective risk management strategies, will be vital for attracting further investment and mitigating potential delays. The sector will also require significant investments in human capital development to support the ongoing expansion and operational needs.
East Africa Midstream Industry Report: 2019-2033
This comprehensive report provides an in-depth analysis of the East Africa midstream industry, offering invaluable insights for industry professionals, investors, and strategic planners. Covering the period 2019-2033, with a base year of 2025 and a forecast period of 2025-2033, this report delivers actionable intelligence on market structure, dynamics, and future growth potential. The report focuses on key segments including Oil, Natural Gas, and Refined Products, across applications like Power Generation, Industrial, and Transportation.
East Africa Midstream Industry Market Structure & Innovation Trends
This section analyzes the competitive landscape of the East Africa midstream industry, including market concentration, innovation drivers, regulatory frameworks, and M&A activities. The study period (2019-2024) reveals a moderately concentrated market with key players such as Tullow Oil, Oil and Natural Gas Corporation (ONGC), China National Petroleum Corporation (CNPC), TotalEnergies, and Eni S.p.A holding significant market share (estimated at xx% collectively in 2025). Innovation is driven by the need for efficient pipeline infrastructure and the adoption of advanced technologies for enhanced oil recovery and transportation. The regulatory environment varies across East African countries, influencing investment decisions. The total M&A deal value in the midstream sector during the historical period (2019-2024) is estimated at $xx Million, with an average deal size of $xx Million.
- Market Concentration: Moderately concentrated, with top 5 players holding xx% market share in 2025.
- Innovation Drivers: Improved pipeline infrastructure, technology for enhanced oil recovery, and efficient transportation.
- Regulatory Frameworks: Vary across East African nations, impacting investment decisions.
- Product Substitutes: Limited substitutes exist for crude oil and natural gas in the midstream sector.
- End-User Demographics: Primarily industrial and power generation sectors, with growing transportation demand.
- M&A Activities: Total M&A deal value (2019-2024): $xx Million; Average deal size: $xx Million
East Africa Midstream Industry Market Dynamics & Trends
This section explores the key drivers and trends shaping the East Africa midstream market. The market is experiencing substantial growth, driven by increasing energy demand, particularly for power generation and industrial applications. Technological advancements, such as pipeline optimization and automation, are further boosting efficiency. The CAGR for the forecast period (2025-2033) is projected at xx%, with market penetration increasing from xx% in 2025 to xx% in 2033. Competitive dynamics are influenced by factors such as government policies, infrastructure development, and access to capital. Consumer preference shifts towards cleaner energy sources are also impacting the market, though currently only marginally.
Dominant Regions & Segments in East Africa Midstream Industry
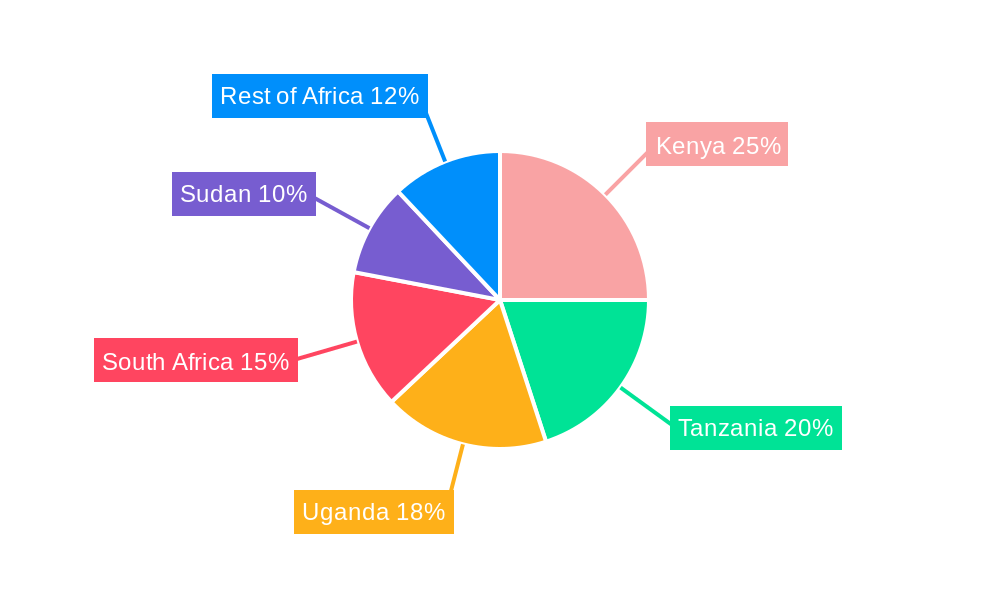
The East African midstream industry is characterized by a dynamic landscape of dominant regions and segments, propelled by substantial infrastructure development and a growing demand for energy. Currently, **Kenya and Tanzania** stand out as the leading hubs. This dominance is attributed to their existing robust pipeline networks, strategic geographical positions facilitating regional trade, and the active progression of numerous high-impact energy projects. Within the industry segments, the **Oil segment** commands the largest market share. This is primarily fueled by the escalating demand from the power generation sector, which relies heavily on refined oil products, as well as the expanding industrial base and transportation needs across the region.
- Key Drivers for Kenya: A well-established pipeline infrastructure, its pivotal role as a regional logistics and trade gateway, and strong governmental commitment to fostering energy project development are the primary drivers for Kenya's midstream prominence.
- Key Drivers for Tanzania: Tanzania's strategic location as a transit point for energy resources to neighboring landlocked countries, coupled with ambitious ongoing pipeline projects and a rapidly expanding industrial and commercial sector, are key to its growth.
- Oil Segment Dominance: The overwhelming demand from the power generation sector, which is critical for both industrial output and residential use, along with the burgeoning industrial and transportation fuel needs, firmly establishes the Oil segment's leading position.
- Natural Gas Segment: While currently smaller in market share, the Natural Gas segment exhibits significant growth potential. This is largely due to the commissioning of new pipeline projects and the increasing utilization of gas for power generation and industrial feedstock, positioning it as a crucial energy source for the future.
- Refined Products Segment: Growth in the Refined Products segment is directly correlated with the increasing demand for fuels in the transportation sector (automotive, aviation, and marine) and the evolving needs of the industrial sector for specialized refined products.
East Africa Midstream Industry Product Innovations
In the realm of product innovations, the East African midstream industry is witnessing a significant shift towards enhancing operational efficiency, bolstering safety protocols, and improving environmental stewardship. Key advancements include the widespread adoption of state-of-the-art pipeline monitoring systems that provide real-time data on flow, pressure, and integrity. Furthermore, sophisticated leak detection technologies are being deployed to minimize product loss and environmental impact. The industry is also prioritizing the use of advanced and sustainable pipeline construction materials that offer greater durability, corrosion resistance, and reduced carbon footprints. These innovations collectively aim to significantly reduce operational expenditures, mitigate environmental risks, and elevate safety standards across the board. The market trend clearly favors technologically advanced solutions that promise enhanced efficiency, reduced operational risks, and a commitment to sustainability.
Report Scope & Segmentation Analysis
This report segments the East Africa midstream market by product (Oil, Natural Gas, Refined Products) and application (Power Generation, Industrial, Transportation). Each segment presents unique growth opportunities and competitive dynamics.
- Oil: xx Million in 2025, projected to reach xx Million by 2033. High growth driven by increasing energy demand.
- Natural Gas: xx Million in 2025, projected to reach xx Million by 2033. Growth linked to new pipeline projects.
- Refined Products: xx Million in 2025, projected to reach xx Million by 2033. Growth driven by transportation and industrial sectors.
- Power Generation: xx Million in 2025, projected to reach xx Million by 2033. Strong growth due to increased electricity demand.
- Industrial: xx Million in 2025, projected to reach xx Million by 2033. Growth driven by industrial expansion.
- Transportation: xx Million in 2025, projected to reach xx Million by 2033. Growth driven by increasing vehicle ownership.
Key Drivers of East Africa Midstream Industry Growth
The East African midstream industry is experiencing robust growth, propelled by a confluence of critical factors. A fundamental driver is the ever-increasing energy demand across all sectors – residential, commercial, and industrial – as economies expand and populations grow. This surge in demand necessitates the expansion and modernization of energy infrastructure. Government initiatives play a pivotal role, with many East African nations actively promoting infrastructure development through policy frameworks, incentives, and direct investment in new pipeline projects. The ongoing and planned investments in extensive pipeline networks, crucial for transporting crude oil, natural gas, and refined products, are directly fueling this growth. Moreover, the accelerating pace of industrialization and urbanization across the region further intensifies the need for reliable and efficient energy supply chains, thereby stimulating the midstream sector.
Challenges in the East Africa Midstream Industry Sector
Significant challenges exist, including the need for substantial investment in infrastructure development, navigating complex regulatory landscapes across different countries, and ensuring the security and stability of pipeline operations. Geopolitical factors and supply chain vulnerabilities also present ongoing hurdles.
Emerging Opportunities in East Africa Midstream Industry
Opportunities lie in developing new pipeline infrastructure, expanding into renewable energy sources (e.g., integrating renewable gas into existing pipelines), and embracing technological innovations to improve efficiency and sustainability. Regional cooperation to facilitate cross-border energy trade presents a crucial opportunity for growth.
Leading Players in the East Africa Midstream Industry Market
- Tullow Oil
- Oil and Natural Gas Corporation (ONGC)
- China National Petroleum Corporation (CNPC)
- Kenya Pipeline Company Ltd (KPC)
- Petróleos de Moçambique SA (Petromoc)
- TotalEnergies
- Eni S.p.A
- Tanzania Petroleum Development Corporation (TPDC)
- Uganda National Oil Company (UNOC)
- National Oil Corporation of Kenya (NOCK)
- Vitol
- Glencore
Key Developments in East Africa Midstream Industry Industry
- The East African Crude Oil Pipeline (EACOP): This flagship project, currently under advanced development with an anticipated completion date in Q4 2024, is set to revolutionize oil export capacity for the landlocked oil reserves of Uganda and potentially other neighboring countries, significantly enhancing regional trade and economic integration.
- The Tanzania-Zambia Natural Gas Pipeline: This crucial cross-border project, slated for completion by Q2 2025, is designed to facilitate the secure and efficient transmission of natural gas, unlocking new opportunities for power generation and industrial use in both Tanzania and Zambia, and fostering regional energy security.
- The Kampala-Mombasa Refined Products Pipeline: Successfully completed in Q1 2023, this vital infrastructure upgrade has substantially improved the speed, safety, and efficiency of transporting refined petroleum products from the Kenyan coast to Uganda, ensuring a more reliable fuel supply for both nations.
- Expansion of Port Infrastructure in Mombasa and Dar es Salaam: Ongoing investments in deepening harbors and expanding berthing facilities at key coastal ports are crucial for handling larger volumes of crude oil and refined products, supporting the growing midstream activities and international trade.
- Development of Inland Fuel Terminals: Strategic construction and expansion of fuel storage and distribution terminals in key inland locations are enhancing supply chain resilience and reducing transit times for fuel delivery to end-users across landlocked East African countries.
Future Outlook for East Africa Midstream Industry Market
The East Africa midstream market is poised for significant growth, driven by sustained energy demand, ongoing infrastructure projects, and technological advancements. Strategic partnerships and investments in sustainable practices will be crucial for long-term success within the industry.
East Africa Midstream Industry Segmentation
- 1. Transportation
- 2. Storage
- 3. LNG Terminals
-
4. Geography
- 4.1. Kenya
- 4.2. Mozambique
- 4.3. Tanzania
- 4.4. Rest of East Africa
East Africa Midstream Industry Segmentation By Geography
- 1. Kenya
- 2. Mozambique
- 3. Tanzania
- 4. Rest of East Africa
East Africa Midstream Industry REPORT HIGHLIGHTS
| Aspects | Details |
|---|---|
| Study Period | 2019-2033 |
| Base Year | 2024 |
| Estimated Year | 2025 |
| Forecast Period | 2025-2033 |
| Historical Period | 2019-2024 |
| Growth Rate | CAGR of > 5.00% from 2019-2033 |
| Segmentation |
|
Table of Contents
- 1. Introduction
- 1.1. Research Scope
- 1.2. Market Segmentation
- 1.3. Research Methodology
- 1.4. Definitions and Assumptions
- 2. Executive Summary
- 2.1. Introduction
- 3. Market Dynamics
- 3.1. Introduction
- 3.2. Market Drivers
- 3.2.1. 4.; Increasing Electricity Demand4.; Rsing Investments in the Coal Industry
- 3.3. Market Restrains
- 3.3.1. 4.; Increasing Installation of Renewable Energy Sources
- 3.4. Market Trends
- 3.4.1. Transportation Sector to Witness Growth
- 4. Market Factor Analysis
- 4.1. Porters Five Forces
- 4.2. Supply/Value Chain
- 4.3. PESTEL analysis
- 4.4. Market Entropy
- 4.5. Patent/Trademark Analysis
- 5. East Africa Midstream Industry Analysis, Insights and Forecast, 2019-2031
- 5.1. Market Analysis, Insights and Forecast - by Transportation
- 5.2. Market Analysis, Insights and Forecast - by Storage
- 5.3. Market Analysis, Insights and Forecast - by LNG Terminals
- 5.4. Market Analysis, Insights and Forecast - by Geography
- 5.4.1. Kenya
- 5.4.2. Mozambique
- 5.4.3. Tanzania
- 5.4.4. Rest of East Africa
- 5.5. Market Analysis, Insights and Forecast - by Region
- 5.5.1. Kenya
- 5.5.2. Mozambique
- 5.5.3. Tanzania
- 5.5.4. Rest of East Africa
- 5.1. Market Analysis, Insights and Forecast - by Transportation
- 6. Kenya East Africa Midstream Industry Analysis, Insights and Forecast, 2019-2031
- 6.1. Market Analysis, Insights and Forecast - by Transportation
- 6.2. Market Analysis, Insights and Forecast - by Storage
- 6.3. Market Analysis, Insights and Forecast - by LNG Terminals
- 6.4. Market Analysis, Insights and Forecast - by Geography
- 6.4.1. Kenya
- 6.4.2. Mozambique
- 6.4.3. Tanzania
- 6.4.4. Rest of East Africa
- 6.1. Market Analysis, Insights and Forecast - by Transportation
- 7. Mozambique East Africa Midstream Industry Analysis, Insights and Forecast, 2019-2031
- 7.1. Market Analysis, Insights and Forecast - by Transportation
- 7.2. Market Analysis, Insights and Forecast - by Storage
- 7.3. Market Analysis, Insights and Forecast - by LNG Terminals
- 7.4. Market Analysis, Insights and Forecast - by Geography
- 7.4.1. Kenya
- 7.4.2. Mozambique
- 7.4.3. Tanzania
- 7.4.4. Rest of East Africa
- 7.1. Market Analysis, Insights and Forecast - by Transportation
- 8. Tanzania East Africa Midstream Industry Analysis, Insights and Forecast, 2019-2031
- 8.1. Market Analysis, Insights and Forecast - by Transportation
- 8.2. Market Analysis, Insights and Forecast - by Storage
- 8.3. Market Analysis, Insights and Forecast - by LNG Terminals
- 8.4. Market Analysis, Insights and Forecast - by Geography
- 8.4.1. Kenya
- 8.4.2. Mozambique
- 8.4.3. Tanzania
- 8.4.4. Rest of East Africa
- 8.1. Market Analysis, Insights and Forecast - by Transportation
- 9. Rest of East Africa East Africa Midstream Industry Analysis, Insights and Forecast, 2019-2031
- 9.1. Market Analysis, Insights and Forecast - by Transportation
- 9.2. Market Analysis, Insights and Forecast - by Storage
- 9.3. Market Analysis, Insights and Forecast - by LNG Terminals
- 9.4. Market Analysis, Insights and Forecast - by Geography
- 9.4.1. Kenya
- 9.4.2. Mozambique
- 9.4.3. Tanzania
- 9.4.4. Rest of East Africa
- 9.1. Market Analysis, Insights and Forecast - by Transportation
- 10. South Africa East Africa Midstream Industry Analysis, Insights and Forecast, 2019-2031
- 11. Sudan East Africa Midstream Industry Analysis, Insights and Forecast, 2019-2031
- 12. Uganda East Africa Midstream Industry Analysis, Insights and Forecast, 2019-2031
- 13. Tanzania East Africa Midstream Industry Analysis, Insights and Forecast, 2019-2031
- 14. Kenya East Africa Midstream Industry Analysis, Insights and Forecast, 2019-2031
- 15. Rest of Africa East Africa Midstream Industry Analysis, Insights and Forecast, 2019-2031
- 16. Competitive Analysis
- 16.1. Market Share Analysis 2024
- 16.2. Company Profiles
- 16.2.1 Tullow Oil
- 16.2.1.1. Overview
- 16.2.1.2. Products
- 16.2.1.3. SWOT Analysis
- 16.2.1.4. Recent Developments
- 16.2.1.5. Financials (Based on Availability)
- 16.2.2 Oil and Natural Gas Corporation
- 16.2.2.1. Overview
- 16.2.2.2. Products
- 16.2.2.3. SWOT Analysis
- 16.2.2.4. Recent Developments
- 16.2.2.5. Financials (Based on Availability)
- 16.2.3 China National Petroleum Corporation
- 16.2.3.1. Overview
- 16.2.3.2. Products
- 16.2.3.3. SWOT Analysis
- 16.2.3.4. Recent Developments
- 16.2.3.5. Financials (Based on Availability)
- 16.2.4 Kenya Pipeline Company Ltd
- 16.2.4.1. Overview
- 16.2.4.2. Products
- 16.2.4.3. SWOT Analysis
- 16.2.4.4. Recent Developments
- 16.2.4.5. Financials (Based on Availability)
- 16.2.5 Petróleos de Moçambique SA
- 16.2.5.1. Overview
- 16.2.5.2. Products
- 16.2.5.3. SWOT Analysis
- 16.2.5.4. Recent Developments
- 16.2.5.5. Financials (Based on Availability)
- 16.2.6 Total S A
- 16.2.6.1. Overview
- 16.2.6.2. Products
- 16.2.6.3. SWOT Analysis
- 16.2.6.4. Recent Developments
- 16.2.6.5. Financials (Based on Availability)
- 16.2.7 Eni S p A *List Not Exhaustive
- 16.2.7.1. Overview
- 16.2.7.2. Products
- 16.2.7.3. SWOT Analysis
- 16.2.7.4. Recent Developments
- 16.2.7.5. Financials (Based on Availability)
- 16.2.8 TotalEnergies
- 16.2.8.1. Overview
- 16.2.8.2. Products
- 16.2.8.3. SWOT Analysis
- 16.2.8.4. Recent Developments
- 16.2.8.5. Financials (Based on Availability)
- 16.2.9 Tanzania Petroleum Development Corporation (TPDC)
- 16.2.9.1. Overview
- 16.2.9.2. Products
- 16.2.9.3. SWOT Analysis
- 16.2.9.4. Recent Developments
- 16.2.9.5. Financials (Based on Availability)
- 16.2.10 Uganda National Oil Company (UNOC)
- 16.2.10.1. Overview
- 16.2.10.2. Products
- 16.2.10.3. SWOT Analysis
- 16.2.10.4. Recent Developments
- 16.2.10.5. Financials (Based on Availability)
- 16.2.1 Tullow Oil
List of Figures
- Figure 1: East Africa Midstream Industry Revenue Breakdown (Million, %) by Product 2024 & 2032
- Figure 2: East Africa Midstream Industry Share (%) by Company 2024
List of Tables
- Table 1: East Africa Midstream Industry Revenue Million Forecast, by Region 2019 & 2032
- Table 2: East Africa Midstream Industry Volume K Tons Forecast, by Region 2019 & 2032
- Table 3: East Africa Midstream Industry Revenue Million Forecast, by Transportation 2019 & 2032
- Table 4: East Africa Midstream Industry Volume K Tons Forecast, by Transportation 2019 & 2032
- Table 5: East Africa Midstream Industry Revenue Million Forecast, by Storage 2019 & 2032
- Table 6: East Africa Midstream Industry Volume K Tons Forecast, by Storage 2019 & 2032
- Table 7: East Africa Midstream Industry Revenue Million Forecast, by LNG Terminals 2019 & 2032
- Table 8: East Africa Midstream Industry Volume K Tons Forecast, by LNG Terminals 2019 & 2032
- Table 9: East Africa Midstream Industry Revenue Million Forecast, by Geography 2019 & 2032
- Table 10: East Africa Midstream Industry Volume K Tons Forecast, by Geography 2019 & 2032
- Table 11: East Africa Midstream Industry Revenue Million Forecast, by Region 2019 & 2032
- Table 12: East Africa Midstream Industry Volume K Tons Forecast, by Region 2019 & 2032
- Table 13: East Africa Midstream Industry Revenue Million Forecast, by Country 2019 & 2032
- Table 14: East Africa Midstream Industry Volume K Tons Forecast, by Country 2019 & 2032
- Table 15: South Africa East Africa Midstream Industry Revenue (Million) Forecast, by Application 2019 & 2032
- Table 16: South Africa East Africa Midstream Industry Volume (K Tons) Forecast, by Application 2019 & 2032
- Table 17: Sudan East Africa Midstream Industry Revenue (Million) Forecast, by Application 2019 & 2032
- Table 18: Sudan East Africa Midstream Industry Volume (K Tons) Forecast, by Application 2019 & 2032
- Table 19: Uganda East Africa Midstream Industry Revenue (Million) Forecast, by Application 2019 & 2032
- Table 20: Uganda East Africa Midstream Industry Volume (K Tons) Forecast, by Application 2019 & 2032
- Table 21: Tanzania East Africa Midstream Industry Revenue (Million) Forecast, by Application 2019 & 2032
- Table 22: Tanzania East Africa Midstream Industry Volume (K Tons) Forecast, by Application 2019 & 2032
- Table 23: Kenya East Africa Midstream Industry Revenue (Million) Forecast, by Application 2019 & 2032
- Table 24: Kenya East Africa Midstream Industry Volume (K Tons) Forecast, by Application 2019 & 2032
- Table 25: Rest of Africa East Africa Midstream Industry Revenue (Million) Forecast, by Application 2019 & 2032
- Table 26: Rest of Africa East Africa Midstream Industry Volume (K Tons) Forecast, by Application 2019 & 2032
- Table 27: East Africa Midstream Industry Revenue Million Forecast, by Transportation 2019 & 2032
- Table 28: East Africa Midstream Industry Volume K Tons Forecast, by Transportation 2019 & 2032
- Table 29: East Africa Midstream Industry Revenue Million Forecast, by Storage 2019 & 2032
- Table 30: East Africa Midstream Industry Volume K Tons Forecast, by Storage 2019 & 2032
- Table 31: East Africa Midstream Industry Revenue Million Forecast, by LNG Terminals 2019 & 2032
- Table 32: East Africa Midstream Industry Volume K Tons Forecast, by LNG Terminals 2019 & 2032
- Table 33: East Africa Midstream Industry Revenue Million Forecast, by Geography 2019 & 2032
- Table 34: East Africa Midstream Industry Volume K Tons Forecast, by Geography 2019 & 2032
- Table 35: East Africa Midstream Industry Revenue Million Forecast, by Country 2019 & 2032
- Table 36: East Africa Midstream Industry Volume K Tons Forecast, by Country 2019 & 2032
- Table 37: East Africa Midstream Industry Revenue Million Forecast, by Transportation 2019 & 2032
- Table 38: East Africa Midstream Industry Volume K Tons Forecast, by Transportation 2019 & 2032
- Table 39: East Africa Midstream Industry Revenue Million Forecast, by Storage 2019 & 2032
- Table 40: East Africa Midstream Industry Volume K Tons Forecast, by Storage 2019 & 2032
- Table 41: East Africa Midstream Industry Revenue Million Forecast, by LNG Terminals 2019 & 2032
- Table 42: East Africa Midstream Industry Volume K Tons Forecast, by LNG Terminals 2019 & 2032
- Table 43: East Africa Midstream Industry Revenue Million Forecast, by Geography 2019 & 2032
- Table 44: East Africa Midstream Industry Volume K Tons Forecast, by Geography 2019 & 2032
- Table 45: East Africa Midstream Industry Revenue Million Forecast, by Country 2019 & 2032
- Table 46: East Africa Midstream Industry Volume K Tons Forecast, by Country 2019 & 2032
- Table 47: East Africa Midstream Industry Revenue Million Forecast, by Transportation 2019 & 2032
- Table 48: East Africa Midstream Industry Volume K Tons Forecast, by Transportation 2019 & 2032
- Table 49: East Africa Midstream Industry Revenue Million Forecast, by Storage 2019 & 2032
- Table 50: East Africa Midstream Industry Volume K Tons Forecast, by Storage 2019 & 2032
- Table 51: East Africa Midstream Industry Revenue Million Forecast, by LNG Terminals 2019 & 2032
- Table 52: East Africa Midstream Industry Volume K Tons Forecast, by LNG Terminals 2019 & 2032
- Table 53: East Africa Midstream Industry Revenue Million Forecast, by Geography 2019 & 2032
- Table 54: East Africa Midstream Industry Volume K Tons Forecast, by Geography 2019 & 2032
- Table 55: East Africa Midstream Industry Revenue Million Forecast, by Country 2019 & 2032
- Table 56: East Africa Midstream Industry Volume K Tons Forecast, by Country 2019 & 2032
- Table 57: East Africa Midstream Industry Revenue Million Forecast, by Transportation 2019 & 2032
- Table 58: East Africa Midstream Industry Volume K Tons Forecast, by Transportation 2019 & 2032
- Table 59: East Africa Midstream Industry Revenue Million Forecast, by Storage 2019 & 2032
- Table 60: East Africa Midstream Industry Volume K Tons Forecast, by Storage 2019 & 2032
- Table 61: East Africa Midstream Industry Revenue Million Forecast, by LNG Terminals 2019 & 2032
- Table 62: East Africa Midstream Industry Volume K Tons Forecast, by LNG Terminals 2019 & 2032
- Table 63: East Africa Midstream Industry Revenue Million Forecast, by Geography 2019 & 2032
- Table 64: East Africa Midstream Industry Volume K Tons Forecast, by Geography 2019 & 2032
- Table 65: East Africa Midstream Industry Revenue Million Forecast, by Country 2019 & 2032
- Table 66: East Africa Midstream Industry Volume K Tons Forecast, by Country 2019 & 2032
Frequently Asked Questions
1. What is the projected Compound Annual Growth Rate (CAGR) of the East Africa Midstream Industry?
The projected CAGR is approximately > 5.00%.
2. Which companies are prominent players in the East Africa Midstream Industry?
Key companies in the market include Tullow Oil, Oil and Natural Gas Corporation, China National Petroleum Corporation, Kenya Pipeline Company Ltd, Petróleos de Moçambique SA, Total S A, Eni S p A *List Not Exhaustive, TotalEnergies , Tanzania Petroleum Development Corporation (TPDC) , Uganda National Oil Company (UNOC).
3. What are the main segments of the East Africa Midstream Industry?
The market segments include Transportation, Storage, LNG Terminals, Geography.
4. Can you provide details about the market size?
The market size is estimated to be USD XX Million as of 2022.
5. What are some drivers contributing to market growth?
4.; Increasing Electricity Demand4.; Rsing Investments in the Coal Industry.
6. What are the notable trends driving market growth?
Transportation Sector to Witness Growth.
7. Are there any restraints impacting market growth?
4.; Increasing Installation of Renewable Energy Sources.
8. Can you provide examples of recent developments in the market?
The development of the East Africa Crude Oil Pipeline
9. What pricing options are available for accessing the report?
Pricing options include single-user, multi-user, and enterprise licenses priced at USD 4750, USD 5250, and USD 8750 respectively.
10. Is the market size provided in terms of value or volume?
The market size is provided in terms of value, measured in Million and volume, measured in K Tons.
11. Are there any specific market keywords associated with the report?
Yes, the market keyword associated with the report is "East Africa Midstream Industry," which aids in identifying and referencing the specific market segment covered.
12. How do I determine which pricing option suits my needs best?
The pricing options vary based on user requirements and access needs. Individual users may opt for single-user licenses, while businesses requiring broader access may choose multi-user or enterprise licenses for cost-effective access to the report.
13. Are there any additional resources or data provided in the East Africa Midstream Industry report?
While the report offers comprehensive insights, it's advisable to review the specific contents or supplementary materials provided to ascertain if additional resources or data are available.
14. How can I stay updated on further developments or reports in the East Africa Midstream Industry?
To stay informed about further developments, trends, and reports in the East Africa Midstream Industry, consider subscribing to industry newsletters, following relevant companies and organizations, or regularly checking reputable industry news sources and publications.
Methodology
Step 1 - Identification of Relevant Samples Size from Population Database


Step 2 - Approaches for Defining Global Market Size (Value, Volume* & Price*)

Note*: In applicable scenarios
Step 3 - Data Sources
Primary Research
- Web Analytics
- Survey Reports
- Research Institute
- Latest Research Reports
- Opinion Leaders
Secondary Research
- Annual Reports
- White Paper
- Latest Press Release
- Industry Association
- Paid Database
- Investor Presentations

Step 4 - Data Triangulation
Involves using different sources of information in order to increase the validity of a study
These sources are likely to be stakeholders in a program - participants, other researchers, program staff, other community members, and so on.
Then we put all data in single framework & apply various statistical tools to find out the dynamic on the market.
During the analysis stage, feedback from the stakeholder groups would be compared to determine areas of agreement as well as areas of divergence


