
Key Insights
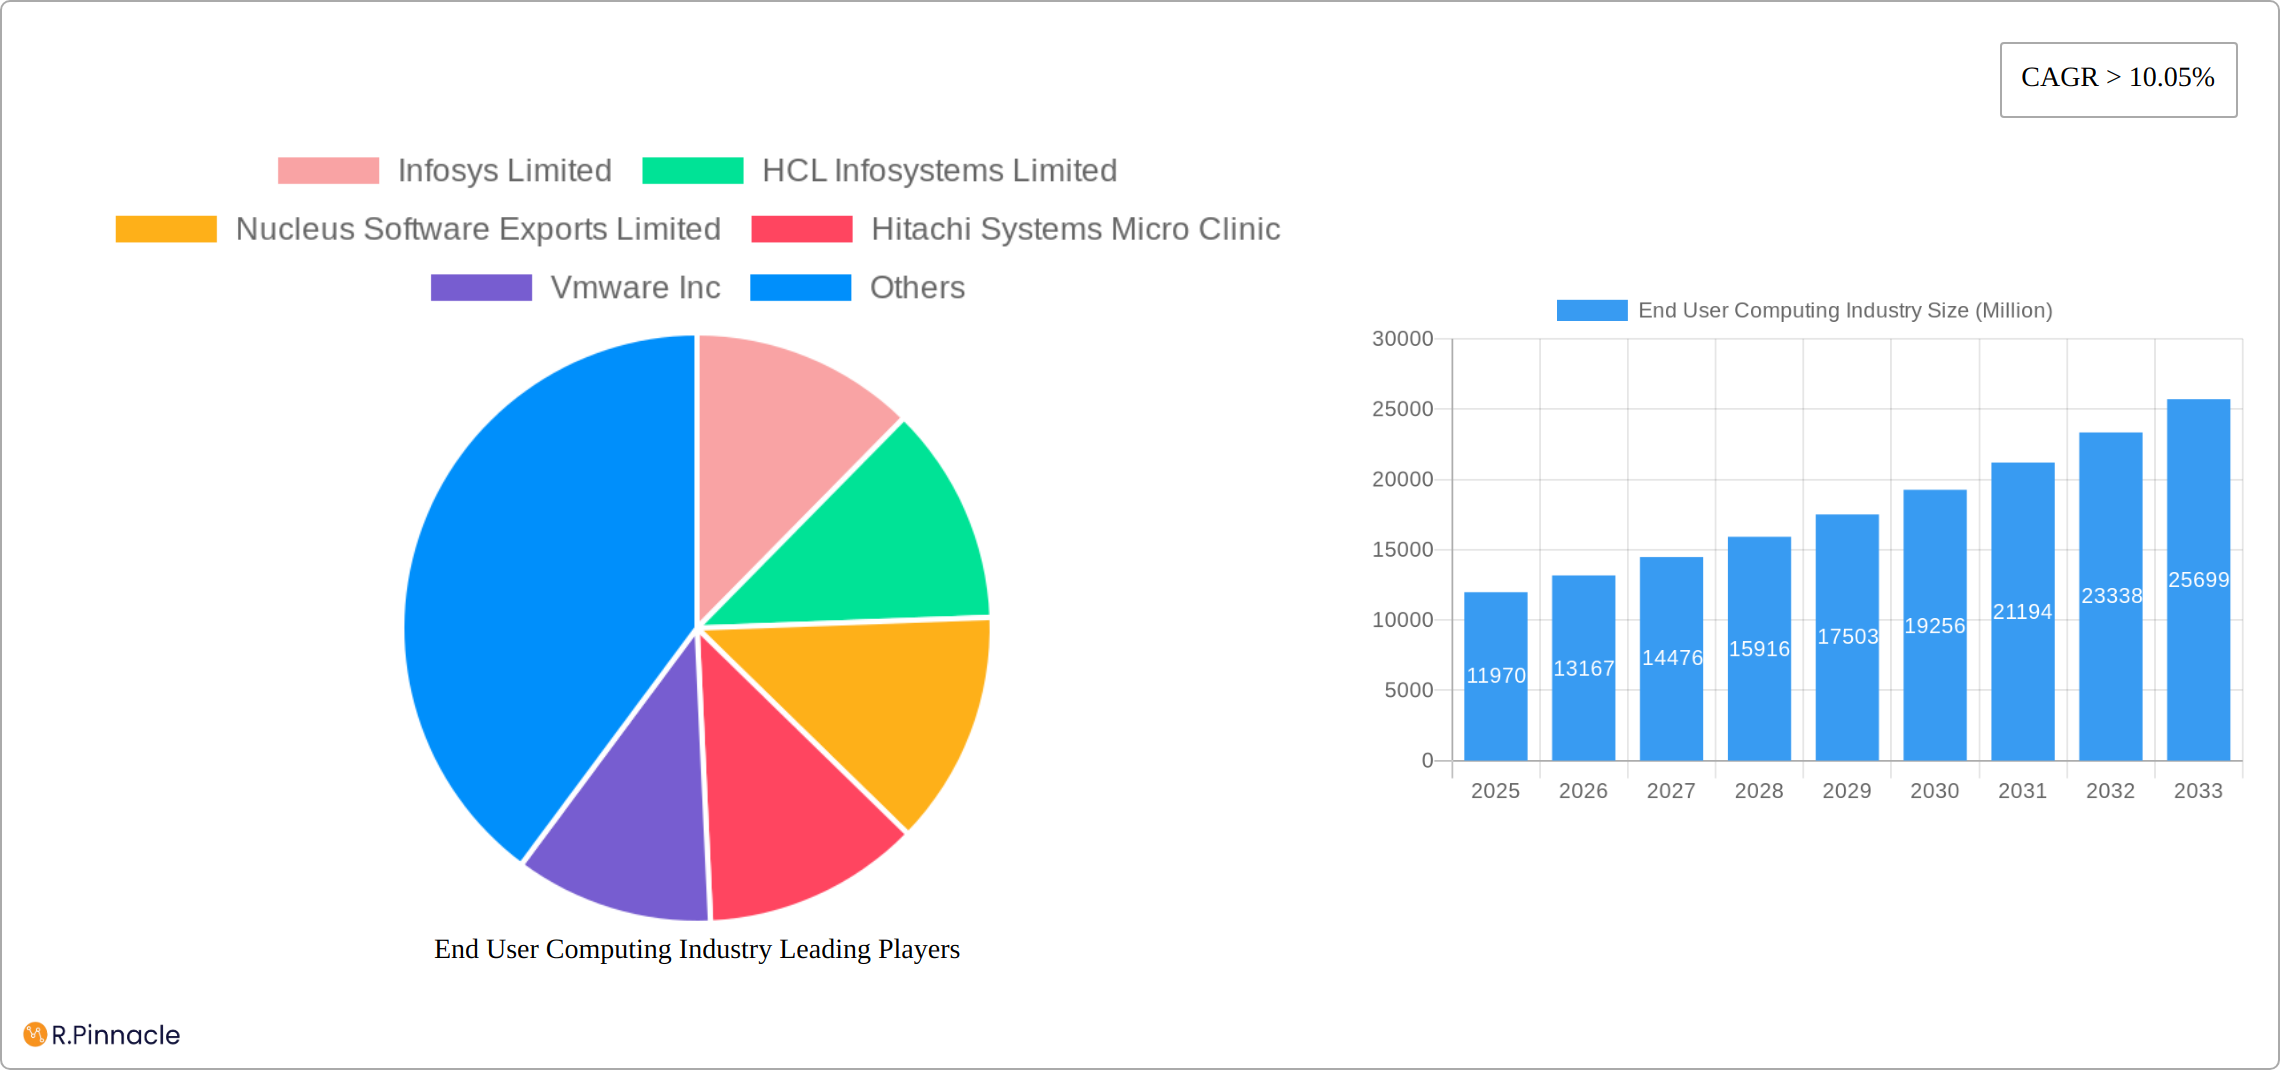
The End User Computing (EUC) market, valued at $11.97 billion in 2025, is experiencing robust growth, projected to expand at a Compound Annual Growth Rate (CAGR) exceeding 10.05% from 2025 to 2033. This expansion is driven by several key factors. The increasing adoption of cloud-based solutions is significantly impacting the market, offering businesses scalability, cost-effectiveness, and improved accessibility. Furthermore, the burgeoning demand for enhanced security measures and streamlined workflows within organizations of all sizes is fueling the growth of EUC solutions. The shift towards remote work models accelerated by recent global events has also contributed significantly, pushing organizations to invest heavily in solutions enabling seamless collaboration and productivity from anywhere. Large enterprises are leading the adoption, followed by a rapidly growing segment of Small and Medium Enterprises (SMEs) embracing EUC to bridge the productivity gap and enhance operational efficiency. Specific segments like IT and Telecom, Banking, Financial Services and Insurance (BFSI), and Healthcare are exhibiting particularly strong growth, driven by their inherent need for robust and secure computing infrastructure.
The market segmentation reveals a dynamic landscape. While on-premise solutions still hold a significant share, the cloud segment demonstrates exceptional growth potential, projected to surpass on-premise deployments within the next few years. Service offerings, including unified communication and software asset management, are gaining traction as organizations increasingly prioritize comprehensive management of their EUC environments. Competition is fierce, with established players like Infosys, HCL, VMware, and Fujitsu alongside emerging technology providers such as Nutanix and NetApp vying for market share. Geographic distribution shows North America and Europe as mature markets, while the Asia-Pacific region presents significant untapped potential with substantial growth opportunities expected in the coming years due to rising digital adoption and increasing technological advancements. The restraints to growth primarily involve concerns surrounding data security and integration complexities, as well as potential skill gaps in managing and maintaining sophisticated EUC environments. However, innovative solutions and strategic partnerships are continuously mitigating these challenges.
End User Computing (EUC) Industry Report: 2019-2033 Forecast
This comprehensive report provides a detailed analysis of the End User Computing industry, offering actionable insights for industry professionals, investors, and strategists. Covering the period 2019-2033, with a focus on 2025, this report examines market dynamics, innovation trends, key players, and future growth prospects. The global End User Computing market is projected to reach xx Million by 2033, exhibiting a robust CAGR of xx% during the forecast period (2025-2033).
End User Computing Industry Market Structure & Innovation Trends
The End User Computing (EUC) market presents a moderately concentrated structure with several key players holding substantial market share. While precise figures fluctuate across segments, industry leaders such as VMware, Citrix, and Amazon Web Services command a significant portion, with their combined market share estimated at [Insert Updated Market Share Figure with Source] in 2025. However, considerable fragmentation exists, especially among smaller, niche providers specializing in specific solutions or industries. This competitive landscape fosters innovation and drives the need for differentiation.
Innovation within the EUC sector is largely driven by advancements in cloud computing, artificial intelligence (AI), and cybersecurity. Stringent regulatory frameworks, including GDPR and CCPA, significantly influence product development, demanding robust data privacy and security features. Legacy on-premise systems are gradually losing ground due to the cost-effectiveness and scalability of cloud-based SaaS solutions. The end-user demographic continues to expand across all sectors, with a notable surge in demand from Small and Medium-sized Enterprises (SMEs) adopting cloud-based EUC solutions for enhanced agility and efficiency. Mergers and acquisitions (M&A) activity remains robust, reflecting a consolidation trend among solution providers. Recent notable examples include the IBM-VMware partnership (August 2022) focusing on hybrid cloud solutions and the CRISIL-Apparity partnership (February 2022) aiming to improve EUC risk management in financial services. This M&A activity is expected to continue shaping the market landscape in the coming years.
End User Computing Industry Market Dynamics & Trends
The EUC market exhibits robust growth, fueled by the expanding adoption of cloud-based solutions, the increasing demand for remote work capabilities, and the proliferation of mobile devices. This growth is primarily driven by the need for enhanced productivity, seamless collaboration, and secure access to corporate resources from any location. The integration of AI-powered solutions further accelerates growth, providing functionalities like intelligent automation, predictive analytics, and personalized user experiences. However, challenges persist, including security concerns, stringent data privacy regulations (e.g., GDPR, CCPA), and the integration complexities associated with legacy systems. The market shows a clear shift towards cloud-based solutions, with an estimated market penetration of [Insert Updated Market Penetration Percentage with Source] in 2025, projected to reach [Insert Updated Projection with Source] by 2033. This transition is largely driven by the cost efficiencies, scalability, and flexibility offered by cloud deployments. The competitive dynamics remain intense, with companies focusing on developing innovative solutions, forging strategic partnerships, and providing robust customer support to retain their market positions and gain a competitive edge.
Dominant Regions & Segments in End User Computing Industry
North America currently holds the largest market share in the EUC industry, driven by high technological adoption, strong economic growth, and a mature IT infrastructure.
Key Drivers in North America: Robust venture capital investment, early adoption of new technologies, and a large pool of skilled IT professionals.
Other Regions: Europe, Asia-Pacific, and other regions are experiencing significant growth, though at varying paces, driven by factors like government initiatives and increasing digital transformation in respective regions.
Segment Dominance:
- Type: Solution segment dominates the market, with a projected market value of xx Million in 2025. The services segment, encompassing unified communication and software asset management, is experiencing strong growth due to increasing demand for specialized expertise.
- Organization Size: Large enterprises currently represent the largest segment, however SMEs are showing rapid growth in cloud-based EUC adoption.
- Deployment Mode: Cloud deployment is rapidly gaining traction, surpassing on-premise solutions due to cost effectiveness and accessibility.
- End-User Industry: The Banking, Financial Services, and Insurance (BFSI) sector, followed by the IT and Telecom sector, currently lead in EUC spending due to stringent regulatory requirements and the need for robust security. Healthcare and Retail sectors are also showing promising growth potential.
End User Computing Industry Product Innovations
Recent innovations in EUC focus on enhancing user experience, improving security, and integrating AI capabilities. This includes advancements in virtual desktop infrastructure (VDI), cloud-based workspaces, and secure access service edge (SASE) solutions. These solutions address challenges related to remote work, data security, and the increasing complexity of modern IT environments. The market fit for these innovations is strong, driven by the rising demand for flexible, scalable, and secure EUC solutions.
Report Scope & Segmentation Analysis
This report segments the EUC market based on type (solution, services), organization size (large enterprises, SMEs), deployment mode (on-premise, cloud), and end-user industry (IT & Telecom, BFSI, Healthcare, Retail, Others). Each segment's growth projections, market size estimations, and competitive dynamics are analyzed in detail.
Key Drivers of End User Computing Industry Growth
The EUC industry's growth is primarily driven by several factors:
- Technological Advancements: Cloud computing, AI, and 5G are transforming EUC.
- Economic Factors: Increasing IT spending by organizations and growing adoption of digital technologies.
- Regulatory Compliance: Stringent data privacy regulations are pushing organizations to adopt secure EUC solutions.
Challenges in the End User Computing Industry Sector
The EUC industry faces several key challenges:
- Evolving Security Threats: Sophisticated cyberattacks and data breaches pose constant and increasingly complex risks, requiring continuous adaptation and investment in robust security measures.
- Integration Complexity and Legacy System Constraints: Integrating legacy systems with modern EUC solutions can be complex, costly, and time-consuming, often requiring significant planning and resources.
- Cost of Implementation and Ongoing Maintenance: High initial investment and substantial ongoing costs associated with deploying and maintaining EUC solutions necessitate careful cost-benefit analysis and efficient resource allocation.
- Skills Gap and Talent Acquisition: The industry faces a shortage of skilled professionals capable of managing and securing complex EUC environments, impacting the overall efficiency and security posture.
Emerging Opportunities in End User Computing Industry
Several compelling opportunities are emerging within the EUC industry:
- Growth in Emerging Markets: Rapid digitalization in developing economies presents significant untapped potential for EUC solution providers.
- Expansion in Niche Industries: Specialized EUC solutions tailored to specific industry needs (e.g., healthcare, education, government) are witnessing increasing demand.
- Advancements in AI and Machine Learning: AI and ML are enabling enhanced security features, improved user experiences, and increased automation capabilities, opening new avenues for innovation.
- Hyperautomation and Robotic Process Automation (RPA): Automating repetitive tasks and workflows within EUC environments is increasing efficiency and reducing operational costs.
Leading Players in the End User Computing Industry Market
- Infosys Limited
- HCL Infosystems Limited
- Nucleus Software Exports Limited
- Hitachi Systems Micro Clinic
- VMware Inc
- Fujitsu Ltd
- Genpact
- Nutanix Inc
- NetApp Inc
- IGEL Technology
- Mindtree Limited
- Tech Mahindra Limited
- Amazon Web Service
- Citrix Systems Inc
- Dell Technologies
Key Developments in End User Computing Industry
- November 2023: Fujitsu Ltd. launched a new technology optimizing CPU and GPU resource allocation for enhanced performance in AI and Deep Learning applications.
- August 2022: IBM partnered with VMware to offer hybrid cloud solutions for businesses in healthcare, financial services, and the public sector.
- February 2022: CRISIL and Apparity LLC partnered to provide comprehensive EUC and model-risk solutions for financial institutions.
Future Outlook for End User Computing Industry Market
The future of the EUC market looks bright, driven by ongoing technological advancements, increasing digital transformation across industries, and the growing need for secure and flexible workplace solutions. Strategic partnerships, innovative product development, and a focus on customer experience will be crucial for success in this dynamic and competitive market. The market is poised for substantial growth, driven by the continued adoption of cloud-based solutions, the rise of AI-powered tools, and the increasing demand for secure and efficient remote work capabilities.
End User Computing Industry Segmentation
-
1. Type
-
1.1. Solution
- 1.1.1. Virtual Desktop Infrastructure
- 1.1.2. Device Management
- 1.1.3. Other So
- 1.2. Services
-
1.1. Solution
-
2. Organization Size
- 2.1. Large Enterprises
- 2.2. Small & Medium Enterprises
-
3. Deployment Mode
- 3.1. On Premise
- 3.2. Cloud
-
4. End user Industry
- 4.1. IT and Telecom
- 4.2. Banking, Financial Services, and Insurance
- 4.3. Healthcare
- 4.4. Retail
- 4.5. Other E
End User Computing Industry Segmentation By Geography
- 1. North America
- 2. Europe
- 3. Asia Pacific
- 4. Latin America
- 5. Middle East and Africa

End User Computing Industry REPORT HIGHLIGHTS
| Aspects | Details |
|---|---|
| Study Period | 2019-2033 |
| Base Year | 2024 |
| Estimated Year | 2025 |
| Forecast Period | 2025-2033 |
| Historical Period | 2019-2024 |
| Growth Rate | CAGR of > 10.05% from 2019-2033 |
| Segmentation |
|
Table of Contents
- 1. Introduction
- 1.1. Research Scope
- 1.2. Market Segmentation
- 1.3. Research Methodology
- 1.4. Definitions and Assumptions
- 2. Executive Summary
- 2.1. Introduction
- 3. Market Dynamics
- 3.1. Introduction
- 3.2. Market Drivers
- 3.2.1. Drive to Increase the Productivity of Employees with Technology; Increasing Use of Cloud
- 3.3. Market Restrains
- 3.3.1. Issues Associated with Transformation and Integration of Processes By Organizations
- 3.4. Market Trends
- 3.4.1. Increasing Use of Cloud is Expected to Drive the End User Computing Market Growth
- 4. Market Factor Analysis
- 4.1. Porters Five Forces
- 4.2. Supply/Value Chain
- 4.3. PESTEL analysis
- 4.4. Market Entropy
- 4.5. Patent/Trademark Analysis
- 5. Global End User Computing Industry Analysis, Insights and Forecast, 2019-2031
- 5.1. Market Analysis, Insights and Forecast - by Type
- 5.1.1. Solution
- 5.1.1.1. Virtual Desktop Infrastructure
- 5.1.1.2. Device Management
- 5.1.1.3. Other So
- 5.1.2. Services
- 5.1.1. Solution
- 5.2. Market Analysis, Insights and Forecast - by Organization Size
- 5.2.1. Large Enterprises
- 5.2.2. Small & Medium Enterprises
- 5.3. Market Analysis, Insights and Forecast - by Deployment Mode
- 5.3.1. On Premise
- 5.3.2. Cloud
- 5.4. Market Analysis, Insights and Forecast - by End user Industry
- 5.4.1. IT and Telecom
- 5.4.2. Banking, Financial Services, and Insurance
- 5.4.3. Healthcare
- 5.4.4. Retail
- 5.4.5. Other E
- 5.5. Market Analysis, Insights and Forecast - by Region
- 5.5.1. North America
- 5.5.2. Europe
- 5.5.3. Asia Pacific
- 5.5.4. Latin America
- 5.5.5. Middle East and Africa
- 5.1. Market Analysis, Insights and Forecast - by Type
- 6. North America End User Computing Industry Analysis, Insights and Forecast, 2019-2031
- 6.1. Market Analysis, Insights and Forecast - by Type
- 6.1.1. Solution
- 6.1.1.1. Virtual Desktop Infrastructure
- 6.1.1.2. Device Management
- 6.1.1.3. Other So
- 6.1.2. Services
- 6.1.1. Solution
- 6.2. Market Analysis, Insights and Forecast - by Organization Size
- 6.2.1. Large Enterprises
- 6.2.2. Small & Medium Enterprises
- 6.3. Market Analysis, Insights and Forecast - by Deployment Mode
- 6.3.1. On Premise
- 6.3.2. Cloud
- 6.4. Market Analysis, Insights and Forecast - by End user Industry
- 6.4.1. IT and Telecom
- 6.4.2. Banking, Financial Services, and Insurance
- 6.4.3. Healthcare
- 6.4.4. Retail
- 6.4.5. Other E
- 6.1. Market Analysis, Insights and Forecast - by Type
- 7. Europe End User Computing Industry Analysis, Insights and Forecast, 2019-2031
- 7.1. Market Analysis, Insights and Forecast - by Type
- 7.1.1. Solution
- 7.1.1.1. Virtual Desktop Infrastructure
- 7.1.1.2. Device Management
- 7.1.1.3. Other So
- 7.1.2. Services
- 7.1.1. Solution
- 7.2. Market Analysis, Insights and Forecast - by Organization Size
- 7.2.1. Large Enterprises
- 7.2.2. Small & Medium Enterprises
- 7.3. Market Analysis, Insights and Forecast - by Deployment Mode
- 7.3.1. On Premise
- 7.3.2. Cloud
- 7.4. Market Analysis, Insights and Forecast - by End user Industry
- 7.4.1. IT and Telecom
- 7.4.2. Banking, Financial Services, and Insurance
- 7.4.3. Healthcare
- 7.4.4. Retail
- 7.4.5. Other E
- 7.1. Market Analysis, Insights and Forecast - by Type
- 8. Asia Pacific End User Computing Industry Analysis, Insights and Forecast, 2019-2031
- 8.1. Market Analysis, Insights and Forecast - by Type
- 8.1.1. Solution
- 8.1.1.1. Virtual Desktop Infrastructure
- 8.1.1.2. Device Management
- 8.1.1.3. Other So
- 8.1.2. Services
- 8.1.1. Solution
- 8.2. Market Analysis, Insights and Forecast - by Organization Size
- 8.2.1. Large Enterprises
- 8.2.2. Small & Medium Enterprises
- 8.3. Market Analysis, Insights and Forecast - by Deployment Mode
- 8.3.1. On Premise
- 8.3.2. Cloud
- 8.4. Market Analysis, Insights and Forecast - by End user Industry
- 8.4.1. IT and Telecom
- 8.4.2. Banking, Financial Services, and Insurance
- 8.4.3. Healthcare
- 8.4.4. Retail
- 8.4.5. Other E
- 8.1. Market Analysis, Insights and Forecast - by Type
- 9. Latin America End User Computing Industry Analysis, Insights and Forecast, 2019-2031
- 9.1. Market Analysis, Insights and Forecast - by Type
- 9.1.1. Solution
- 9.1.1.1. Virtual Desktop Infrastructure
- 9.1.1.2. Device Management
- 9.1.1.3. Other So
- 9.1.2. Services
- 9.1.1. Solution
- 9.2. Market Analysis, Insights and Forecast - by Organization Size
- 9.2.1. Large Enterprises
- 9.2.2. Small & Medium Enterprises
- 9.3. Market Analysis, Insights and Forecast - by Deployment Mode
- 9.3.1. On Premise
- 9.3.2. Cloud
- 9.4. Market Analysis, Insights and Forecast - by End user Industry
- 9.4.1. IT and Telecom
- 9.4.2. Banking, Financial Services, and Insurance
- 9.4.3. Healthcare
- 9.4.4. Retail
- 9.4.5. Other E
- 9.1. Market Analysis, Insights and Forecast - by Type
- 10. Middle East and Africa End User Computing Industry Analysis, Insights and Forecast, 2019-2031
- 10.1. Market Analysis, Insights and Forecast - by Type
- 10.1.1. Solution
- 10.1.1.1. Virtual Desktop Infrastructure
- 10.1.1.2. Device Management
- 10.1.1.3. Other So
- 10.1.2. Services
- 10.1.1. Solution
- 10.2. Market Analysis, Insights and Forecast - by Organization Size
- 10.2.1. Large Enterprises
- 10.2.2. Small & Medium Enterprises
- 10.3. Market Analysis, Insights and Forecast - by Deployment Mode
- 10.3.1. On Premise
- 10.3.2. Cloud
- 10.4. Market Analysis, Insights and Forecast - by End user Industry
- 10.4.1. IT and Telecom
- 10.4.2. Banking, Financial Services, and Insurance
- 10.4.3. Healthcare
- 10.4.4. Retail
- 10.4.5. Other E
- 10.1. Market Analysis, Insights and Forecast - by Type
- 11. North America End User Computing Industry Analysis, Insights and Forecast, 2019-2031
- 11.1. Market Analysis, Insights and Forecast - By Country/Sub-region
- 11.1.1.
- 12. Europe End User Computing Industry Analysis, Insights and Forecast, 2019-2031
- 12.1. Market Analysis, Insights and Forecast - By Country/Sub-region
- 12.1.1.
- 13. Asia Pacific End User Computing Industry Analysis, Insights and Forecast, 2019-2031
- 13.1. Market Analysis, Insights and Forecast - By Country/Sub-region
- 13.1.1.
- 14. Latin America End User Computing Industry Analysis, Insights and Forecast, 2019-2031
- 14.1. Market Analysis, Insights and Forecast - By Country/Sub-region
- 14.1.1.
- 15. Middle East and Africa End User Computing Industry Analysis, Insights and Forecast, 2019-2031
- 15.1. Market Analysis, Insights and Forecast - By Country/Sub-region
- 15.1.1.
- 16. Competitive Analysis
- 16.1. Global Market Share Analysis 2024
- 16.2. Company Profiles
- 16.2.1 Infosys Limited
- 16.2.1.1. Overview
- 16.2.1.2. Products
- 16.2.1.3. SWOT Analysis
- 16.2.1.4. Recent Developments
- 16.2.1.5. Financials (Based on Availability)
- 16.2.2 HCL Infosystems Limited
- 16.2.2.1. Overview
- 16.2.2.2. Products
- 16.2.2.3. SWOT Analysis
- 16.2.2.4. Recent Developments
- 16.2.2.5. Financials (Based on Availability)
- 16.2.3 Nucleus Software Exports Limited
- 16.2.3.1. Overview
- 16.2.3.2. Products
- 16.2.3.3. SWOT Analysis
- 16.2.3.4. Recent Developments
- 16.2.3.5. Financials (Based on Availability)
- 16.2.4 Hitachi Systems Micro Clinic
- 16.2.4.1. Overview
- 16.2.4.2. Products
- 16.2.4.3. SWOT Analysis
- 16.2.4.4. Recent Developments
- 16.2.4.5. Financials (Based on Availability)
- 16.2.5 Vmware Inc
- 16.2.5.1. Overview
- 16.2.5.2. Products
- 16.2.5.3. SWOT Analysis
- 16.2.5.4. Recent Developments
- 16.2.5.5. Financials (Based on Availability)
- 16.2.6 Fujitsu Ltd
- 16.2.6.1. Overview
- 16.2.6.2. Products
- 16.2.6.3. SWOT Analysis
- 16.2.6.4. Recent Developments
- 16.2.6.5. Financials (Based on Availability)
- 16.2.7 Genpact
- 16.2.7.1. Overview
- 16.2.7.2. Products
- 16.2.7.3. SWOT Analysis
- 16.2.7.4. Recent Developments
- 16.2.7.5. Financials (Based on Availability)
- 16.2.8 Nutanix Inc
- 16.2.8.1. Overview
- 16.2.8.2. Products
- 16.2.8.3. SWOT Analysis
- 16.2.8.4. Recent Developments
- 16.2.8.5. Financials (Based on Availability)
- 16.2.9 NetApp Inc
- 16.2.9.1. Overview
- 16.2.9.2. Products
- 16.2.9.3. SWOT Analysis
- 16.2.9.4. Recent Developments
- 16.2.9.5. Financials (Based on Availability)
- 16.2.10 IGEL Technology
- 16.2.10.1. Overview
- 16.2.10.2. Products
- 16.2.10.3. SWOT Analysis
- 16.2.10.4. Recent Developments
- 16.2.10.5. Financials (Based on Availability)
- 16.2.11 Mindtree Limited
- 16.2.11.1. Overview
- 16.2.11.2. Products
- 16.2.11.3. SWOT Analysis
- 16.2.11.4. Recent Developments
- 16.2.11.5. Financials (Based on Availability)
- 16.2.12 Tech Mahindra Limited
- 16.2.12.1. Overview
- 16.2.12.2. Products
- 16.2.12.3. SWOT Analysis
- 16.2.12.4. Recent Developments
- 16.2.12.5. Financials (Based on Availability)
- 16.2.13 Amazon Web Service
- 16.2.13.1. Overview
- 16.2.13.2. Products
- 16.2.13.3. SWOT Analysis
- 16.2.13.4. Recent Developments
- 16.2.13.5. Financials (Based on Availability)
- 16.2.14 Citrix Systems Inc
- 16.2.14.1. Overview
- 16.2.14.2. Products
- 16.2.14.3. SWOT Analysis
- 16.2.14.4. Recent Developments
- 16.2.14.5. Financials (Based on Availability)
- 16.2.15 Dell Technologies
- 16.2.15.1. Overview
- 16.2.15.2. Products
- 16.2.15.3. SWOT Analysis
- 16.2.15.4. Recent Developments
- 16.2.15.5. Financials (Based on Availability)
- 16.2.1 Infosys Limited
List of Figures
- Figure 1: Global End User Computing Industry Revenue Breakdown (Million, %) by Region 2024 & 2032
- Figure 2: North America End User Computing Industry Revenue (Million), by Country 2024 & 2032
- Figure 3: North America End User Computing Industry Revenue Share (%), by Country 2024 & 2032
- Figure 4: Europe End User Computing Industry Revenue (Million), by Country 2024 & 2032
- Figure 5: Europe End User Computing Industry Revenue Share (%), by Country 2024 & 2032
- Figure 6: Asia Pacific End User Computing Industry Revenue (Million), by Country 2024 & 2032
- Figure 7: Asia Pacific End User Computing Industry Revenue Share (%), by Country 2024 & 2032
- Figure 8: Latin America End User Computing Industry Revenue (Million), by Country 2024 & 2032
- Figure 9: Latin America End User Computing Industry Revenue Share (%), by Country 2024 & 2032
- Figure 10: Middle East and Africa End User Computing Industry Revenue (Million), by Country 2024 & 2032
- Figure 11: Middle East and Africa End User Computing Industry Revenue Share (%), by Country 2024 & 2032
- Figure 12: North America End User Computing Industry Revenue (Million), by Type 2024 & 2032
- Figure 13: North America End User Computing Industry Revenue Share (%), by Type 2024 & 2032
- Figure 14: North America End User Computing Industry Revenue (Million), by Organization Size 2024 & 2032
- Figure 15: North America End User Computing Industry Revenue Share (%), by Organization Size 2024 & 2032
- Figure 16: North America End User Computing Industry Revenue (Million), by Deployment Mode 2024 & 2032
- Figure 17: North America End User Computing Industry Revenue Share (%), by Deployment Mode 2024 & 2032
- Figure 18: North America End User Computing Industry Revenue (Million), by End user Industry 2024 & 2032
- Figure 19: North America End User Computing Industry Revenue Share (%), by End user Industry 2024 & 2032
- Figure 20: North America End User Computing Industry Revenue (Million), by Country 2024 & 2032
- Figure 21: North America End User Computing Industry Revenue Share (%), by Country 2024 & 2032
- Figure 22: Europe End User Computing Industry Revenue (Million), by Type 2024 & 2032
- Figure 23: Europe End User Computing Industry Revenue Share (%), by Type 2024 & 2032
- Figure 24: Europe End User Computing Industry Revenue (Million), by Organization Size 2024 & 2032
- Figure 25: Europe End User Computing Industry Revenue Share (%), by Organization Size 2024 & 2032
- Figure 26: Europe End User Computing Industry Revenue (Million), by Deployment Mode 2024 & 2032
- Figure 27: Europe End User Computing Industry Revenue Share (%), by Deployment Mode 2024 & 2032
- Figure 28: Europe End User Computing Industry Revenue (Million), by End user Industry 2024 & 2032
- Figure 29: Europe End User Computing Industry Revenue Share (%), by End user Industry 2024 & 2032
- Figure 30: Europe End User Computing Industry Revenue (Million), by Country 2024 & 2032
- Figure 31: Europe End User Computing Industry Revenue Share (%), by Country 2024 & 2032
- Figure 32: Asia Pacific End User Computing Industry Revenue (Million), by Type 2024 & 2032
- Figure 33: Asia Pacific End User Computing Industry Revenue Share (%), by Type 2024 & 2032
- Figure 34: Asia Pacific End User Computing Industry Revenue (Million), by Organization Size 2024 & 2032
- Figure 35: Asia Pacific End User Computing Industry Revenue Share (%), by Organization Size 2024 & 2032
- Figure 36: Asia Pacific End User Computing Industry Revenue (Million), by Deployment Mode 2024 & 2032
- Figure 37: Asia Pacific End User Computing Industry Revenue Share (%), by Deployment Mode 2024 & 2032
- Figure 38: Asia Pacific End User Computing Industry Revenue (Million), by End user Industry 2024 & 2032
- Figure 39: Asia Pacific End User Computing Industry Revenue Share (%), by End user Industry 2024 & 2032
- Figure 40: Asia Pacific End User Computing Industry Revenue (Million), by Country 2024 & 2032
- Figure 41: Asia Pacific End User Computing Industry Revenue Share (%), by Country 2024 & 2032
- Figure 42: Latin America End User Computing Industry Revenue (Million), by Type 2024 & 2032
- Figure 43: Latin America End User Computing Industry Revenue Share (%), by Type 2024 & 2032
- Figure 44: Latin America End User Computing Industry Revenue (Million), by Organization Size 2024 & 2032
- Figure 45: Latin America End User Computing Industry Revenue Share (%), by Organization Size 2024 & 2032
- Figure 46: Latin America End User Computing Industry Revenue (Million), by Deployment Mode 2024 & 2032
- Figure 47: Latin America End User Computing Industry Revenue Share (%), by Deployment Mode 2024 & 2032
- Figure 48: Latin America End User Computing Industry Revenue (Million), by End user Industry 2024 & 2032
- Figure 49: Latin America End User Computing Industry Revenue Share (%), by End user Industry 2024 & 2032
- Figure 50: Latin America End User Computing Industry Revenue (Million), by Country 2024 & 2032
- Figure 51: Latin America End User Computing Industry Revenue Share (%), by Country 2024 & 2032
- Figure 52: Middle East and Africa End User Computing Industry Revenue (Million), by Type 2024 & 2032
- Figure 53: Middle East and Africa End User Computing Industry Revenue Share (%), by Type 2024 & 2032
- Figure 54: Middle East and Africa End User Computing Industry Revenue (Million), by Organization Size 2024 & 2032
- Figure 55: Middle East and Africa End User Computing Industry Revenue Share (%), by Organization Size 2024 & 2032
- Figure 56: Middle East and Africa End User Computing Industry Revenue (Million), by Deployment Mode 2024 & 2032
- Figure 57: Middle East and Africa End User Computing Industry Revenue Share (%), by Deployment Mode 2024 & 2032
- Figure 58: Middle East and Africa End User Computing Industry Revenue (Million), by End user Industry 2024 & 2032
- Figure 59: Middle East and Africa End User Computing Industry Revenue Share (%), by End user Industry 2024 & 2032
- Figure 60: Middle East and Africa End User Computing Industry Revenue (Million), by Country 2024 & 2032
- Figure 61: Middle East and Africa End User Computing Industry Revenue Share (%), by Country 2024 & 2032
List of Tables
- Table 1: Global End User Computing Industry Revenue Million Forecast, by Region 2019 & 2032
- Table 2: Global End User Computing Industry Revenue Million Forecast, by Type 2019 & 2032
- Table 3: Global End User Computing Industry Revenue Million Forecast, by Organization Size 2019 & 2032
- Table 4: Global End User Computing Industry Revenue Million Forecast, by Deployment Mode 2019 & 2032
- Table 5: Global End User Computing Industry Revenue Million Forecast, by End user Industry 2019 & 2032
- Table 6: Global End User Computing Industry Revenue Million Forecast, by Region 2019 & 2032
- Table 7: Global End User Computing Industry Revenue Million Forecast, by Country 2019 & 2032
- Table 8: End User Computing Industry Revenue (Million) Forecast, by Application 2019 & 2032
- Table 9: Global End User Computing Industry Revenue Million Forecast, by Country 2019 & 2032
- Table 10: End User Computing Industry Revenue (Million) Forecast, by Application 2019 & 2032
- Table 11: Global End User Computing Industry Revenue Million Forecast, by Country 2019 & 2032
- Table 12: End User Computing Industry Revenue (Million) Forecast, by Application 2019 & 2032
- Table 13: Global End User Computing Industry Revenue Million Forecast, by Country 2019 & 2032
- Table 14: End User Computing Industry Revenue (Million) Forecast, by Application 2019 & 2032
- Table 15: Global End User Computing Industry Revenue Million Forecast, by Country 2019 & 2032
- Table 16: End User Computing Industry Revenue (Million) Forecast, by Application 2019 & 2032
- Table 17: Global End User Computing Industry Revenue Million Forecast, by Type 2019 & 2032
- Table 18: Global End User Computing Industry Revenue Million Forecast, by Organization Size 2019 & 2032
- Table 19: Global End User Computing Industry Revenue Million Forecast, by Deployment Mode 2019 & 2032
- Table 20: Global End User Computing Industry Revenue Million Forecast, by End user Industry 2019 & 2032
- Table 21: Global End User Computing Industry Revenue Million Forecast, by Country 2019 & 2032
- Table 22: Global End User Computing Industry Revenue Million Forecast, by Type 2019 & 2032
- Table 23: Global End User Computing Industry Revenue Million Forecast, by Organization Size 2019 & 2032
- Table 24: Global End User Computing Industry Revenue Million Forecast, by Deployment Mode 2019 & 2032
- Table 25: Global End User Computing Industry Revenue Million Forecast, by End user Industry 2019 & 2032
- Table 26: Global End User Computing Industry Revenue Million Forecast, by Country 2019 & 2032
- Table 27: Global End User Computing Industry Revenue Million Forecast, by Type 2019 & 2032
- Table 28: Global End User Computing Industry Revenue Million Forecast, by Organization Size 2019 & 2032
- Table 29: Global End User Computing Industry Revenue Million Forecast, by Deployment Mode 2019 & 2032
- Table 30: Global End User Computing Industry Revenue Million Forecast, by End user Industry 2019 & 2032
- Table 31: Global End User Computing Industry Revenue Million Forecast, by Country 2019 & 2032
- Table 32: Global End User Computing Industry Revenue Million Forecast, by Type 2019 & 2032
- Table 33: Global End User Computing Industry Revenue Million Forecast, by Organization Size 2019 & 2032
- Table 34: Global End User Computing Industry Revenue Million Forecast, by Deployment Mode 2019 & 2032
- Table 35: Global End User Computing Industry Revenue Million Forecast, by End user Industry 2019 & 2032
- Table 36: Global End User Computing Industry Revenue Million Forecast, by Country 2019 & 2032
- Table 37: Global End User Computing Industry Revenue Million Forecast, by Type 2019 & 2032
- Table 38: Global End User Computing Industry Revenue Million Forecast, by Organization Size 2019 & 2032
- Table 39: Global End User Computing Industry Revenue Million Forecast, by Deployment Mode 2019 & 2032
- Table 40: Global End User Computing Industry Revenue Million Forecast, by End user Industry 2019 & 2032
- Table 41: Global End User Computing Industry Revenue Million Forecast, by Country 2019 & 2032
Frequently Asked Questions
1. What is the projected Compound Annual Growth Rate (CAGR) of the End User Computing Industry?
The projected CAGR is approximately > 10.05%.
2. Which companies are prominent players in the End User Computing Industry?
Key companies in the market include Infosys Limited, HCL Infosystems Limited, Nucleus Software Exports Limited, Hitachi Systems Micro Clinic, Vmware Inc, Fujitsu Ltd, Genpact, Nutanix Inc, NetApp Inc, IGEL Technology, Mindtree Limited, Tech Mahindra Limited, Amazon Web Service, Citrix Systems Inc, Dell Technologies.
3. What are the main segments of the End User Computing Industry?
The market segments include Type, Organization Size, Deployment Mode, End user Industry.
4. Can you provide details about the market size?
The market size is estimated to be USD 11.97 Million as of 2022.
5. What are some drivers contributing to market growth?
Drive to Increase the Productivity of Employees with Technology; Increasing Use of Cloud.
6. What are the notable trends driving market growth?
Increasing Use of Cloud is Expected to Drive the End User Computing Market Growth.
7. Are there any restraints impacting market growth?
Issues Associated with Transformation and Integration of Processes By Organizations.
8. Can you provide examples of recent developments in the market?
November 2023 - Fujitsu Ltd Technology for the optimization of the use of CPUs and GPUs by allocating resources on a real-time basis to prioritize processes with high performance prioritise processes with high performance, even when running programs using GPUs. For the worldwide shortage of GPUs, which has been triggered by a growing demand for intelligent Artificial Intelligence, Deep Learning, and more applications, Fujitsu developed a new technology that optimizes user computing resources.
9. What pricing options are available for accessing the report?
Pricing options include single-user, multi-user, and enterprise licenses priced at USD 4750, USD 5250, and USD 8750 respectively.
10. Is the market size provided in terms of value or volume?
The market size is provided in terms of value, measured in Million.
11. Are there any specific market keywords associated with the report?
Yes, the market keyword associated with the report is "End User Computing Industry," which aids in identifying and referencing the specific market segment covered.
12. How do I determine which pricing option suits my needs best?
The pricing options vary based on user requirements and access needs. Individual users may opt for single-user licenses, while businesses requiring broader access may choose multi-user or enterprise licenses for cost-effective access to the report.
13. Are there any additional resources or data provided in the End User Computing Industry report?
While the report offers comprehensive insights, it's advisable to review the specific contents or supplementary materials provided to ascertain if additional resources or data are available.
14. How can I stay updated on further developments or reports in the End User Computing Industry?
To stay informed about further developments, trends, and reports in the End User Computing Industry, consider subscribing to industry newsletters, following relevant companies and organizations, or regularly checking reputable industry news sources and publications.
Methodology
Step 1 - Identification of Relevant Samples Size from Population Database


Step 2 - Approaches for Defining Global Market Size (Value, Volume* & Price*)

Note*: In applicable scenarios
Step 3 - Data Sources
Primary Research
- Web Analytics
- Survey Reports
- Research Institute
- Latest Research Reports
- Opinion Leaders
Secondary Research
- Annual Reports
- White Paper
- Latest Press Release
- Industry Association
- Paid Database
- Investor Presentations

Step 4 - Data Triangulation
Involves using different sources of information in order to increase the validity of a study
These sources are likely to be stakeholders in a program - participants, other researchers, program staff, other community members, and so on.
Then we put all data in single framework & apply various statistical tools to find out the dynamic on the market.
During the analysis stage, feedback from the stakeholder groups would be compared to determine areas of agreement as well as areas of divergence


