
Key Insights
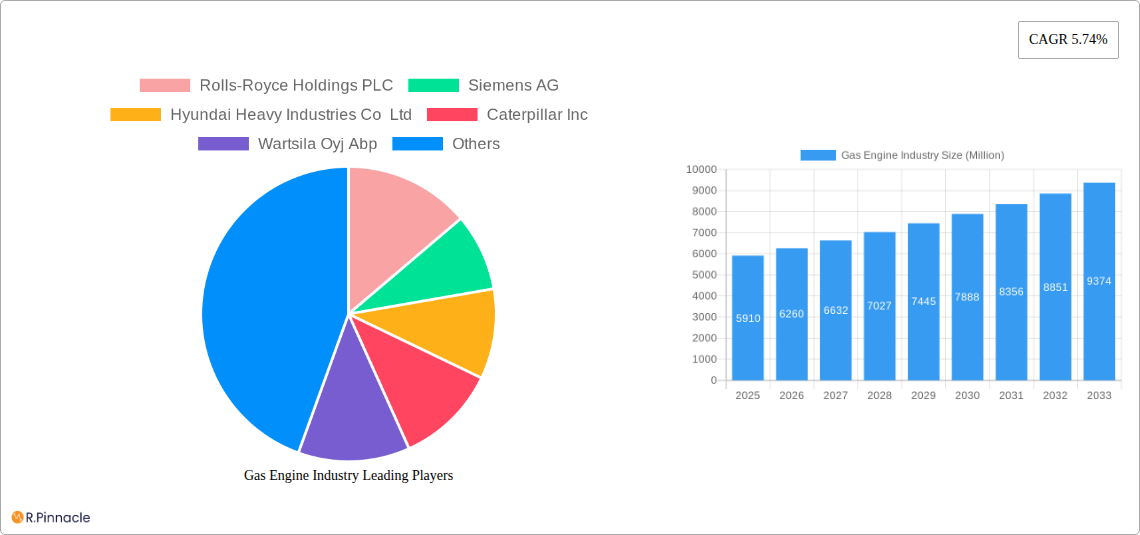
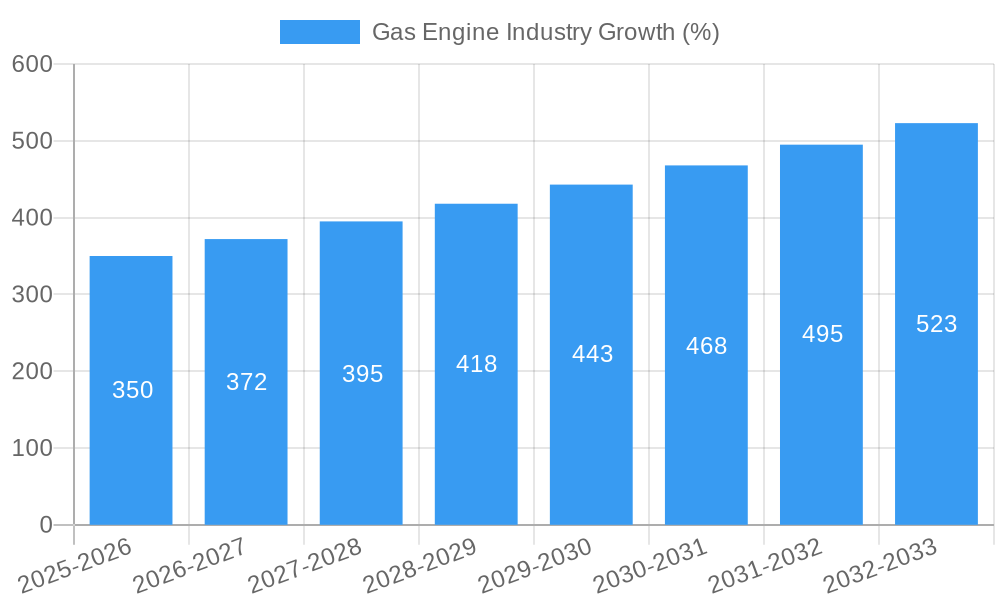
The global gas engine market, valued at $5.91 billion in 2025, is projected to experience robust growth, driven by increasing energy demands across various sectors and the ongoing transition towards cleaner energy sources. A Compound Annual Growth Rate (CAGR) of 5.74% from 2025 to 2033 signifies a substantial market expansion, primarily fueled by the power utilities sector's reliance on gas engines for reliable and efficient electricity generation. The automotive industry's adoption of natural gas engines for commercial vehicles contributes significantly, especially in regions with supportive government policies and infrastructure. Furthermore, the marine and industrial sectors are increasingly adopting gas engines to meet stringent emission regulations and improve operational efficiency. The shift towards cleaner fuel types, such as hydrogen, although currently a smaller segment, holds significant long-term potential, driven by environmental concerns and technological advancements. However, fluctuating natural gas prices and the competitive landscape with alternative power generation technologies pose challenges to the market's growth trajectory. The market segmentation by end-user (power utilities, automotive, marine, industrial, others) and fuel type (natural gas, hydrogen, other fuel types) provides a detailed understanding of the diverse applications and driving forces within the industry. Geographic expansion, particularly in developing economies with expanding industrialization and energy infrastructure development, presents substantial growth opportunities for market players.
The competitive landscape features major players like Rolls-Royce, Siemens, Hyundai Heavy Industries, Caterpillar, Wärtsilä, and others, each vying for market share through technological innovation and strategic partnerships. Companies are focusing on enhancing engine efficiency, reducing emissions, and developing advanced control systems to meet evolving customer needs. The North American, European, and Asia-Pacific regions are expected to remain key contributors to market growth, driven by their established industrial bases and investments in energy infrastructure. However, the growth trajectory will likely be influenced by government regulations on emissions, fuel prices, and the broader adoption of renewable energy sources. The ongoing technological advancements in hydrogen fuel cell technology and the potential for increased usage of biogas pose both opportunities and challenges for established gas engine manufacturers.
Gas Engine Industry Market Report: 2019-2033
This comprehensive report provides an in-depth analysis of the global gas engine industry, offering invaluable insights for industry professionals, investors, and strategic decision-makers. Covering the period from 2019 to 2033, with a focus on 2025, this report projects a market valued at xx Million USD by 2033. Discover key trends, challenges, and opportunities shaping this dynamic sector.
Gas Engine Industry Market Structure & Innovation Trends
The gas engine market is characterized by a moderately concentrated structure with several major players dominating the landscape. Key companies include Rolls-Royce Holdings PLC, Siemens AG, Hyundai Heavy Industries Co Ltd, Caterpillar Inc, Wärtsilä Oyj Abp, Liebherr Group, Cummins Inc, General Electric Company, Kawasaki Heavy Industries Ltd, JFE Engineering Corporation, MAN SE, and Mitsubishi Heavy Industries Ltd. However, the list is not exhaustive and includes several smaller, specialized players. Market share fluctuates based on technological advancements, regional demand, and successful M&A activities. Recent M&A deals have involved significant investments, reaching values in the hundreds of Millions of USD, driving consolidation within the industry.
- Market Concentration: Moderate, with several large players holding significant market share.
- Innovation Drivers: Stringent emission regulations, demand for efficient power generation, and the emergence of alternative fuels (hydrogen).
- Regulatory Frameworks: Vary significantly across regions, impacting adoption rates and technological choices.
- Product Substitutes: Renewable energy sources (solar, wind) pose a competitive threat.
- End-User Demographics: Power utilities, marine, and industrial sectors are major consumers.
- M&A Activities: Significant M&A activity drives market consolidation and technological integration. Deal values exceeding xx Million USD have been observed in recent years.
Gas Engine Industry Market Dynamics & Trends
The global gas engine market is projected to experience a Compound Annual Growth Rate (CAGR) of xx% during the forecast period (2025-2033). This growth is primarily driven by increasing energy demand, particularly in developing economies, coupled with ongoing infrastructure development projects. Technological advancements, such as the incorporation of advanced combustion systems and the development of hydrogen-powered engines, are also significantly impacting market dynamics. The market penetration of natural gas engines remains dominant, but the adoption of hydrogen and other alternative fuels is gradually increasing, driven by environmental concerns and government incentives. Competitive pressures among major players are intense, with companies focusing on innovation, cost optimization, and strategic partnerships to enhance market share and profitability.
Dominant Regions & Segments in Gas Engine Industry
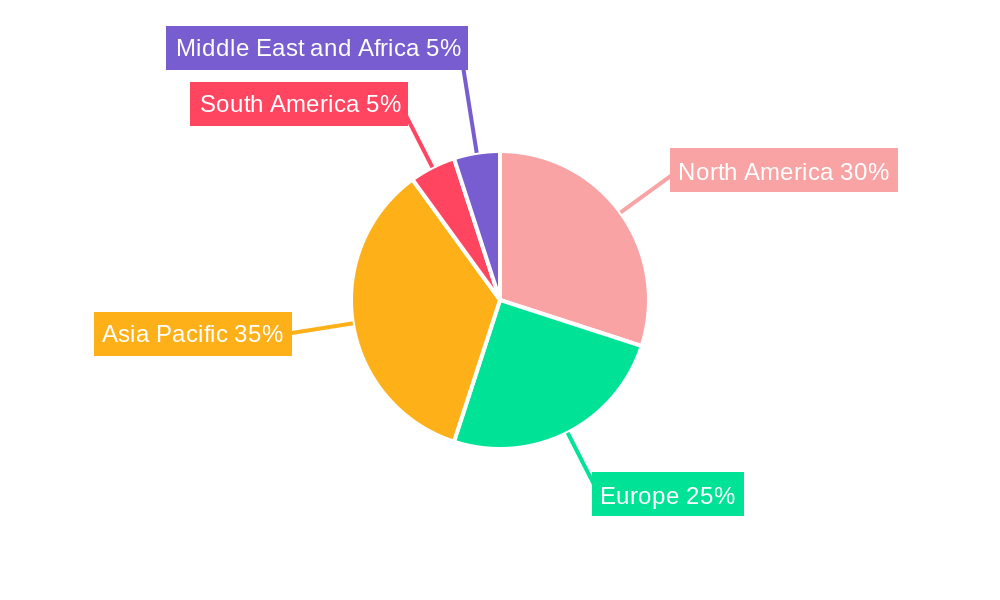
The Asia-Pacific region currently holds the largest market share in the gas engine industry, driven by robust economic growth, extensive infrastructure development, and a significant increase in industrial activity. Within the end-user segments, power utilities represent the largest segment, owing to the crucial role of gas engines in power generation. Similarly, natural gas continues to dominate the fuel type segment due to its cost-effectiveness and availability.
Key Drivers in Asia-Pacific: Rapid industrialization, supportive government policies, and rising energy demands.
Power Utilities Segment Dominance: Driven by the need for reliable and efficient power generation.
Natural Gas Fuel Type Dominance: Primarily due to cost-effectiveness and established infrastructure.
Other significant regions: North America and Europe also contribute significantly, with diverse market dynamics based on their unique regulatory landscapes and technological advancements.
Gas Engine Industry Product Innovations
Recent innovations focus on improving fuel efficiency, reducing emissions, and expanding the applications of gas engines. The development of hydrogen-fueled engines, as exemplified by ITP Aero's project, is a major breakthrough. Furthermore, advancements in combustion technology, such as the Weichai Group's high-efficiency engine with a 54.16% BTE, are enhancing market competitiveness. These innovations contribute to improved environmental performance and expand the potential use cases for gas engines in various applications.
Report Scope & Segmentation Analysis
This report provides a detailed segmentation analysis of the gas engine market based on end-user (Power Utilities, Automotive, Marine, Industrial, Others) and fuel type (Natural Gas, Hydrogen, Other Fuel Types). Each segment's market size, growth projections, and competitive dynamics are analyzed extensively. For instance, the power utilities segment is projected to exhibit the highest growth during the forecast period, while the hydrogen fuel type segment is expected to demonstrate significant growth, albeit from a smaller base, driven by increasing environmental concerns and technological advancements.
Key Drivers of Gas Engine Industry Growth
Several factors drive the growth of the gas engine industry. These include the increasing global energy demand, particularly in developing economies, coupled with the expanding infrastructure development projects. Additionally, the relatively lower cost of natural gas compared to other fuels and ongoing technological advancements enhancing engine efficiency contribute to market expansion. Favorable government policies supporting the adoption of gas engines in certain regions also serve as a growth driver.
Challenges in the Gas Engine Industry Sector
The gas engine industry faces challenges including stringent emission regulations worldwide, increasing pressure to reduce greenhouse gas emissions, and the fluctuating prices of natural gas impacting cost competitiveness. Supply chain disruptions caused by geopolitical instability and the growing competition from renewable energy sources also pose significant challenges. These factors can affect the production costs and market accessibility of gas engines.
Emerging Opportunities in Gas Engine Industry
The increasing adoption of alternative fuels like hydrogen offers substantial growth potential. Furthermore, innovations in engine technology to enhance efficiency and reduce emissions present significant opportunities. The expansion into new applications, such as distributed generation and off-grid power solutions, also creates lucrative avenues for industry growth. Exploring new markets in developing economies also holds significant promise.
Leading Players in the Gas Engine Industry Market
- Rolls-Royce Holdings PLC
- Siemens AG
- Hyundai Heavy Industries Co Ltd
- Caterpillar Inc
- Wartsila Oyj Abp
- Liebherr Group
- Cummins Inc
- General Electric Company
- Kawasaki Heavy Industries Ltd
- JFE Engineering Corporation
- MAN SE
- Mitsubishi Heavy Industries Ltd
Key Developments in Gas Engine Industry
- March 2023: ITP Aero leads a consortium to develop a hydrogen-fueled aircraft engine, receiving USD 13 Million in funding. This signals a significant shift towards alternative fuels in the aviation sector and has implications for broader gas engine technology.
- November 2022: Weichai Group launches a high-efficiency natural gas engine (54.16% BTE), showcasing advancements in combustion technology and potentially impacting market competitiveness. This indicates a significant advancement in efficiency and could lead to wider adoption of natural gas engines.
Future Outlook for Gas Engine Industry Market
The future of the gas engine industry is projected to be positive despite challenges. Continued technological advancements, particularly in hydrogen fuel cell and combustion technology, will drive growth, coupled with the ever-increasing demand for reliable and efficient power generation. Strategic partnerships and M&A activities will play a vital role in shaping the industry's future landscape. The focus on sustainability and emissions reduction will remain a key factor influencing the technological direction and market development.
Gas Engine Industry Segmentation
-
1. End-User
- 1.1. Power Utilities
- 1.2. Automotive
- 1.3. Marine
- 1.4. Industrial
- 1.5. Others
-
2. Fuel Type
- 2.1. Natural Gas
- 2.2. Hydrogen
- 2.3. Other Fuel Types
Gas Engine Industry Segmentation By Geography
-
1. North America
- 1.1. United States
- 1.2. Canada
- 1.3. Rest of North America
-
2. Europe
- 2.1. Germany
- 2.2. France
- 2.3. United Kingdom
- 2.4. Rest of Europe
-
3. Asia Pacific
- 3.1. China
- 3.2. India
- 3.3. Japan
- 3.4. South Korea
- 3.5. Rest of Asia Pacific
-
4. South America
- 4.1. Brazil
- 4.2. Argentina
- 4.3. Rest of South America
-
5. Middle East and Africa
- 5.1. Saudi Arabia
- 5.2. United Arab Emirates
- 5.3. South Africa
- 5.4. Rest of Middle East and Africa
Gas Engine Industry REPORT HIGHLIGHTS
| Aspects | Details |
|---|---|
| Study Period | 2019-2033 |
| Base Year | 2024 |
| Estimated Year | 2025 |
| Forecast Period | 2025-2033 |
| Historical Period | 2019-2024 |
| Growth Rate | CAGR of 5.74% from 2019-2033 |
| Segmentation |
|
Table of Contents
- 1. Introduction
- 1.1. Research Scope
- 1.2. Market Segmentation
- 1.3. Research Methodology
- 1.4. Definitions and Assumptions
- 2. Executive Summary
- 2.1. Introduction
- 3. Market Dynamics
- 3.1. Introduction
- 3.2. Market Drivers
- 3.2.1. 4.; Increasing Supply and Consumption of Gas-based Systems in Various End-user Industry4.; Implementation of stricter emission regulations worldwide
- 3.3. Market Restrains
- 3.3.1. 4.; Growing Inclination towards Renewable Sources
- 3.4. Market Trends
- 3.4.1. Power Utilities Expected to Witness Significant Growth
- 4. Market Factor Analysis
- 4.1. Porters Five Forces
- 4.2. Supply/Value Chain
- 4.3. PESTEL analysis
- 4.4. Market Entropy
- 4.5. Patent/Trademark Analysis
- 5. Global Gas Engine Industry Analysis, Insights and Forecast, 2019-2031
- 5.1. Market Analysis, Insights and Forecast - by End-User
- 5.1.1. Power Utilities
- 5.1.2. Automotive
- 5.1.3. Marine
- 5.1.4. Industrial
- 5.1.5. Others
- 5.2. Market Analysis, Insights and Forecast - by Fuel Type
- 5.2.1. Natural Gas
- 5.2.2. Hydrogen
- 5.2.3. Other Fuel Types
- 5.3. Market Analysis, Insights and Forecast - by Region
- 5.3.1. North America
- 5.3.2. Europe
- 5.3.3. Asia Pacific
- 5.3.4. South America
- 5.3.5. Middle East and Africa
- 5.1. Market Analysis, Insights and Forecast - by End-User
- 6. North America Gas Engine Industry Analysis, Insights and Forecast, 2019-2031
- 6.1. Market Analysis, Insights and Forecast - by End-User
- 6.1.1. Power Utilities
- 6.1.2. Automotive
- 6.1.3. Marine
- 6.1.4. Industrial
- 6.1.5. Others
- 6.2. Market Analysis, Insights and Forecast - by Fuel Type
- 6.2.1. Natural Gas
- 6.2.2. Hydrogen
- 6.2.3. Other Fuel Types
- 6.1. Market Analysis, Insights and Forecast - by End-User
- 7. Europe Gas Engine Industry Analysis, Insights and Forecast, 2019-2031
- 7.1. Market Analysis, Insights and Forecast - by End-User
- 7.1.1. Power Utilities
- 7.1.2. Automotive
- 7.1.3. Marine
- 7.1.4. Industrial
- 7.1.5. Others
- 7.2. Market Analysis, Insights and Forecast - by Fuel Type
- 7.2.1. Natural Gas
- 7.2.2. Hydrogen
- 7.2.3. Other Fuel Types
- 7.1. Market Analysis, Insights and Forecast - by End-User
- 8. Asia Pacific Gas Engine Industry Analysis, Insights and Forecast, 2019-2031
- 8.1. Market Analysis, Insights and Forecast - by End-User
- 8.1.1. Power Utilities
- 8.1.2. Automotive
- 8.1.3. Marine
- 8.1.4. Industrial
- 8.1.5. Others
- 8.2. Market Analysis, Insights and Forecast - by Fuel Type
- 8.2.1. Natural Gas
- 8.2.2. Hydrogen
- 8.2.3. Other Fuel Types
- 8.1. Market Analysis, Insights and Forecast - by End-User
- 9. South America Gas Engine Industry Analysis, Insights and Forecast, 2019-2031
- 9.1. Market Analysis, Insights and Forecast - by End-User
- 9.1.1. Power Utilities
- 9.1.2. Automotive
- 9.1.3. Marine
- 9.1.4. Industrial
- 9.1.5. Others
- 9.2. Market Analysis, Insights and Forecast - by Fuel Type
- 9.2.1. Natural Gas
- 9.2.2. Hydrogen
- 9.2.3. Other Fuel Types
- 9.1. Market Analysis, Insights and Forecast - by End-User
- 10. Middle East and Africa Gas Engine Industry Analysis, Insights and Forecast, 2019-2031
- 10.1. Market Analysis, Insights and Forecast - by End-User
- 10.1.1. Power Utilities
- 10.1.2. Automotive
- 10.1.3. Marine
- 10.1.4. Industrial
- 10.1.5. Others
- 10.2. Market Analysis, Insights and Forecast - by Fuel Type
- 10.2.1. Natural Gas
- 10.2.2. Hydrogen
- 10.2.3. Other Fuel Types
- 10.1. Market Analysis, Insights and Forecast - by End-User
- 11. North America Gas Engine Industry Analysis, Insights and Forecast, 2019-2031
- 11.1. Market Analysis, Insights and Forecast - By Country/Sub-region
- 11.1.1 United States
- 11.1.2 Canada
- 11.1.3 Rest of North America
- 12. Europe Gas Engine Industry Analysis, Insights and Forecast, 2019-2031
- 12.1. Market Analysis, Insights and Forecast - By Country/Sub-region
- 12.1.1 Germany
- 12.1.2 France
- 12.1.3 United Kingdom
- 12.1.4 Rest of Europe
- 13. Asia Pacific Gas Engine Industry Analysis, Insights and Forecast, 2019-2031
- 13.1. Market Analysis, Insights and Forecast - By Country/Sub-region
- 13.1.1 China
- 13.1.2 India
- 13.1.3 Japan
- 13.1.4 South Korea
- 13.1.5 Rest of Asia Pacific
- 14. South America Gas Engine Industry Analysis, Insights and Forecast, 2019-2031
- 14.1. Market Analysis, Insights and Forecast - By Country/Sub-region
- 14.1.1 Brazil
- 14.1.2 Argentina
- 14.1.3 Rest of South America
- 15. Middle East and Africa Gas Engine Industry Analysis, Insights and Forecast, 2019-2031
- 15.1. Market Analysis, Insights and Forecast - By Country/Sub-region
- 15.1.1 Saudi Arabia
- 15.1.2 United Arab Emirates
- 15.1.3 South Africa
- 15.1.4 Rest of Middle East and Africa
- 16. Competitive Analysis
- 16.1. Global Market Share Analysis 2024
- 16.2. Company Profiles
- 16.2.1 Rolls-Royce Holdings PLC
- 16.2.1.1. Overview
- 16.2.1.2. Products
- 16.2.1.3. SWOT Analysis
- 16.2.1.4. Recent Developments
- 16.2.1.5. Financials (Based on Availability)
- 16.2.2 Siemens AG
- 16.2.2.1. Overview
- 16.2.2.2. Products
- 16.2.2.3. SWOT Analysis
- 16.2.2.4. Recent Developments
- 16.2.2.5. Financials (Based on Availability)
- 16.2.3 Hyundai Heavy Industries Co Ltd
- 16.2.3.1. Overview
- 16.2.3.2. Products
- 16.2.3.3. SWOT Analysis
- 16.2.3.4. Recent Developments
- 16.2.3.5. Financials (Based on Availability)
- 16.2.4 Caterpillar Inc
- 16.2.4.1. Overview
- 16.2.4.2. Products
- 16.2.4.3. SWOT Analysis
- 16.2.4.4. Recent Developments
- 16.2.4.5. Financials (Based on Availability)
- 16.2.5 Wartsila Oyj Abp
- 16.2.5.1. Overview
- 16.2.5.2. Products
- 16.2.5.3. SWOT Analysis
- 16.2.5.4. Recent Developments
- 16.2.5.5. Financials (Based on Availability)
- 16.2.6 Liebherr Group*List Not Exhaustive
- 16.2.6.1. Overview
- 16.2.6.2. Products
- 16.2.6.3. SWOT Analysis
- 16.2.6.4. Recent Developments
- 16.2.6.5. Financials (Based on Availability)
- 16.2.7 Cummins Inc
- 16.2.7.1. Overview
- 16.2.7.2. Products
- 16.2.7.3. SWOT Analysis
- 16.2.7.4. Recent Developments
- 16.2.7.5. Financials (Based on Availability)
- 16.2.8 General Electric Company
- 16.2.8.1. Overview
- 16.2.8.2. Products
- 16.2.8.3. SWOT Analysis
- 16.2.8.4. Recent Developments
- 16.2.8.5. Financials (Based on Availability)
- 16.2.9 Kawasaki Heavy Industries Ltd
- 16.2.9.1. Overview
- 16.2.9.2. Products
- 16.2.9.3. SWOT Analysis
- 16.2.9.4. Recent Developments
- 16.2.9.5. Financials (Based on Availability)
- 16.2.10 JFE Engineering Corporation
- 16.2.10.1. Overview
- 16.2.10.2. Products
- 16.2.10.3. SWOT Analysis
- 16.2.10.4. Recent Developments
- 16.2.10.5. Financials (Based on Availability)
- 16.2.11 Man SE
- 16.2.11.1. Overview
- 16.2.11.2. Products
- 16.2.11.3. SWOT Analysis
- 16.2.11.4. Recent Developments
- 16.2.11.5. Financials (Based on Availability)
- 16.2.12 Mitsubishi Heavy Industries Ltd
- 16.2.12.1. Overview
- 16.2.12.2. Products
- 16.2.12.3. SWOT Analysis
- 16.2.12.4. Recent Developments
- 16.2.12.5. Financials (Based on Availability)
- 16.2.1 Rolls-Royce Holdings PLC
List of Figures
- Figure 1: Global Gas Engine Industry Revenue Breakdown (Million, %) by Region 2024 & 2032
- Figure 2: Global Gas Engine Industry Volume Breakdown (K Unit, %) by Region 2024 & 2032
- Figure 3: North America Gas Engine Industry Revenue (Million), by Country 2024 & 2032
- Figure 4: North America Gas Engine Industry Volume (K Unit), by Country 2024 & 2032
- Figure 5: North America Gas Engine Industry Revenue Share (%), by Country 2024 & 2032
- Figure 6: North America Gas Engine Industry Volume Share (%), by Country 2024 & 2032
- Figure 7: Europe Gas Engine Industry Revenue (Million), by Country 2024 & 2032
- Figure 8: Europe Gas Engine Industry Volume (K Unit), by Country 2024 & 2032
- Figure 9: Europe Gas Engine Industry Revenue Share (%), by Country 2024 & 2032
- Figure 10: Europe Gas Engine Industry Volume Share (%), by Country 2024 & 2032
- Figure 11: Asia Pacific Gas Engine Industry Revenue (Million), by Country 2024 & 2032
- Figure 12: Asia Pacific Gas Engine Industry Volume (K Unit), by Country 2024 & 2032
- Figure 13: Asia Pacific Gas Engine Industry Revenue Share (%), by Country 2024 & 2032
- Figure 14: Asia Pacific Gas Engine Industry Volume Share (%), by Country 2024 & 2032
- Figure 15: South America Gas Engine Industry Revenue (Million), by Country 2024 & 2032
- Figure 16: South America Gas Engine Industry Volume (K Unit), by Country 2024 & 2032
- Figure 17: South America Gas Engine Industry Revenue Share (%), by Country 2024 & 2032
- Figure 18: South America Gas Engine Industry Volume Share (%), by Country 2024 & 2032
- Figure 19: Middle East and Africa Gas Engine Industry Revenue (Million), by Country 2024 & 2032
- Figure 20: Middle East and Africa Gas Engine Industry Volume (K Unit), by Country 2024 & 2032
- Figure 21: Middle East and Africa Gas Engine Industry Revenue Share (%), by Country 2024 & 2032
- Figure 22: Middle East and Africa Gas Engine Industry Volume Share (%), by Country 2024 & 2032
- Figure 23: North America Gas Engine Industry Revenue (Million), by End-User 2024 & 2032
- Figure 24: North America Gas Engine Industry Volume (K Unit), by End-User 2024 & 2032
- Figure 25: North America Gas Engine Industry Revenue Share (%), by End-User 2024 & 2032
- Figure 26: North America Gas Engine Industry Volume Share (%), by End-User 2024 & 2032
- Figure 27: North America Gas Engine Industry Revenue (Million), by Fuel Type 2024 & 2032
- Figure 28: North America Gas Engine Industry Volume (K Unit), by Fuel Type 2024 & 2032
- Figure 29: North America Gas Engine Industry Revenue Share (%), by Fuel Type 2024 & 2032
- Figure 30: North America Gas Engine Industry Volume Share (%), by Fuel Type 2024 & 2032
- Figure 31: North America Gas Engine Industry Revenue (Million), by Country 2024 & 2032
- Figure 32: North America Gas Engine Industry Volume (K Unit), by Country 2024 & 2032
- Figure 33: North America Gas Engine Industry Revenue Share (%), by Country 2024 & 2032
- Figure 34: North America Gas Engine Industry Volume Share (%), by Country 2024 & 2032
- Figure 35: Europe Gas Engine Industry Revenue (Million), by End-User 2024 & 2032
- Figure 36: Europe Gas Engine Industry Volume (K Unit), by End-User 2024 & 2032
- Figure 37: Europe Gas Engine Industry Revenue Share (%), by End-User 2024 & 2032
- Figure 38: Europe Gas Engine Industry Volume Share (%), by End-User 2024 & 2032
- Figure 39: Europe Gas Engine Industry Revenue (Million), by Fuel Type 2024 & 2032
- Figure 40: Europe Gas Engine Industry Volume (K Unit), by Fuel Type 2024 & 2032
- Figure 41: Europe Gas Engine Industry Revenue Share (%), by Fuel Type 2024 & 2032
- Figure 42: Europe Gas Engine Industry Volume Share (%), by Fuel Type 2024 & 2032
- Figure 43: Europe Gas Engine Industry Revenue (Million), by Country 2024 & 2032
- Figure 44: Europe Gas Engine Industry Volume (K Unit), by Country 2024 & 2032
- Figure 45: Europe Gas Engine Industry Revenue Share (%), by Country 2024 & 2032
- Figure 46: Europe Gas Engine Industry Volume Share (%), by Country 2024 & 2032
- Figure 47: Asia Pacific Gas Engine Industry Revenue (Million), by End-User 2024 & 2032
- Figure 48: Asia Pacific Gas Engine Industry Volume (K Unit), by End-User 2024 & 2032
- Figure 49: Asia Pacific Gas Engine Industry Revenue Share (%), by End-User 2024 & 2032
- Figure 50: Asia Pacific Gas Engine Industry Volume Share (%), by End-User 2024 & 2032
- Figure 51: Asia Pacific Gas Engine Industry Revenue (Million), by Fuel Type 2024 & 2032
- Figure 52: Asia Pacific Gas Engine Industry Volume (K Unit), by Fuel Type 2024 & 2032
- Figure 53: Asia Pacific Gas Engine Industry Revenue Share (%), by Fuel Type 2024 & 2032
- Figure 54: Asia Pacific Gas Engine Industry Volume Share (%), by Fuel Type 2024 & 2032
- Figure 55: Asia Pacific Gas Engine Industry Revenue (Million), by Country 2024 & 2032
- Figure 56: Asia Pacific Gas Engine Industry Volume (K Unit), by Country 2024 & 2032
- Figure 57: Asia Pacific Gas Engine Industry Revenue Share (%), by Country 2024 & 2032
- Figure 58: Asia Pacific Gas Engine Industry Volume Share (%), by Country 2024 & 2032
- Figure 59: South America Gas Engine Industry Revenue (Million), by End-User 2024 & 2032
- Figure 60: South America Gas Engine Industry Volume (K Unit), by End-User 2024 & 2032
- Figure 61: South America Gas Engine Industry Revenue Share (%), by End-User 2024 & 2032
- Figure 62: South America Gas Engine Industry Volume Share (%), by End-User 2024 & 2032
- Figure 63: South America Gas Engine Industry Revenue (Million), by Fuel Type 2024 & 2032
- Figure 64: South America Gas Engine Industry Volume (K Unit), by Fuel Type 2024 & 2032
- Figure 65: South America Gas Engine Industry Revenue Share (%), by Fuel Type 2024 & 2032
- Figure 66: South America Gas Engine Industry Volume Share (%), by Fuel Type 2024 & 2032
- Figure 67: South America Gas Engine Industry Revenue (Million), by Country 2024 & 2032
- Figure 68: South America Gas Engine Industry Volume (K Unit), by Country 2024 & 2032
- Figure 69: South America Gas Engine Industry Revenue Share (%), by Country 2024 & 2032
- Figure 70: South America Gas Engine Industry Volume Share (%), by Country 2024 & 2032
- Figure 71: Middle East and Africa Gas Engine Industry Revenue (Million), by End-User 2024 & 2032
- Figure 72: Middle East and Africa Gas Engine Industry Volume (K Unit), by End-User 2024 & 2032
- Figure 73: Middle East and Africa Gas Engine Industry Revenue Share (%), by End-User 2024 & 2032
- Figure 74: Middle East and Africa Gas Engine Industry Volume Share (%), by End-User 2024 & 2032
- Figure 75: Middle East and Africa Gas Engine Industry Revenue (Million), by Fuel Type 2024 & 2032
- Figure 76: Middle East and Africa Gas Engine Industry Volume (K Unit), by Fuel Type 2024 & 2032
- Figure 77: Middle East and Africa Gas Engine Industry Revenue Share (%), by Fuel Type 2024 & 2032
- Figure 78: Middle East and Africa Gas Engine Industry Volume Share (%), by Fuel Type 2024 & 2032
- Figure 79: Middle East and Africa Gas Engine Industry Revenue (Million), by Country 2024 & 2032
- Figure 80: Middle East and Africa Gas Engine Industry Volume (K Unit), by Country 2024 & 2032
- Figure 81: Middle East and Africa Gas Engine Industry Revenue Share (%), by Country 2024 & 2032
- Figure 82: Middle East and Africa Gas Engine Industry Volume Share (%), by Country 2024 & 2032
List of Tables
- Table 1: Global Gas Engine Industry Revenue Million Forecast, by Region 2019 & 2032
- Table 2: Global Gas Engine Industry Volume K Unit Forecast, by Region 2019 & 2032
- Table 3: Global Gas Engine Industry Revenue Million Forecast, by End-User 2019 & 2032
- Table 4: Global Gas Engine Industry Volume K Unit Forecast, by End-User 2019 & 2032
- Table 5: Global Gas Engine Industry Revenue Million Forecast, by Fuel Type 2019 & 2032
- Table 6: Global Gas Engine Industry Volume K Unit Forecast, by Fuel Type 2019 & 2032
- Table 7: Global Gas Engine Industry Revenue Million Forecast, by Region 2019 & 2032
- Table 8: Global Gas Engine Industry Volume K Unit Forecast, by Region 2019 & 2032
- Table 9: Global Gas Engine Industry Revenue Million Forecast, by Country 2019 & 2032
- Table 10: Global Gas Engine Industry Volume K Unit Forecast, by Country 2019 & 2032
- Table 11: United States Gas Engine Industry Revenue (Million) Forecast, by Application 2019 & 2032
- Table 12: United States Gas Engine Industry Volume (K Unit) Forecast, by Application 2019 & 2032
- Table 13: Canada Gas Engine Industry Revenue (Million) Forecast, by Application 2019 & 2032
- Table 14: Canada Gas Engine Industry Volume (K Unit) Forecast, by Application 2019 & 2032
- Table 15: Rest of North America Gas Engine Industry Revenue (Million) Forecast, by Application 2019 & 2032
- Table 16: Rest of North America Gas Engine Industry Volume (K Unit) Forecast, by Application 2019 & 2032
- Table 17: Global Gas Engine Industry Revenue Million Forecast, by Country 2019 & 2032
- Table 18: Global Gas Engine Industry Volume K Unit Forecast, by Country 2019 & 2032
- Table 19: Germany Gas Engine Industry Revenue (Million) Forecast, by Application 2019 & 2032
- Table 20: Germany Gas Engine Industry Volume (K Unit) Forecast, by Application 2019 & 2032
- Table 21: France Gas Engine Industry Revenue (Million) Forecast, by Application 2019 & 2032
- Table 22: France Gas Engine Industry Volume (K Unit) Forecast, by Application 2019 & 2032
- Table 23: United Kingdom Gas Engine Industry Revenue (Million) Forecast, by Application 2019 & 2032
- Table 24: United Kingdom Gas Engine Industry Volume (K Unit) Forecast, by Application 2019 & 2032
- Table 25: Rest of Europe Gas Engine Industry Revenue (Million) Forecast, by Application 2019 & 2032
- Table 26: Rest of Europe Gas Engine Industry Volume (K Unit) Forecast, by Application 2019 & 2032
- Table 27: Global Gas Engine Industry Revenue Million Forecast, by Country 2019 & 2032
- Table 28: Global Gas Engine Industry Volume K Unit Forecast, by Country 2019 & 2032
- Table 29: China Gas Engine Industry Revenue (Million) Forecast, by Application 2019 & 2032
- Table 30: China Gas Engine Industry Volume (K Unit) Forecast, by Application 2019 & 2032
- Table 31: India Gas Engine Industry Revenue (Million) Forecast, by Application 2019 & 2032
- Table 32: India Gas Engine Industry Volume (K Unit) Forecast, by Application 2019 & 2032
- Table 33: Japan Gas Engine Industry Revenue (Million) Forecast, by Application 2019 & 2032
- Table 34: Japan Gas Engine Industry Volume (K Unit) Forecast, by Application 2019 & 2032
- Table 35: South Korea Gas Engine Industry Revenue (Million) Forecast, by Application 2019 & 2032
- Table 36: South Korea Gas Engine Industry Volume (K Unit) Forecast, by Application 2019 & 2032
- Table 37: Rest of Asia Pacific Gas Engine Industry Revenue (Million) Forecast, by Application 2019 & 2032
- Table 38: Rest of Asia Pacific Gas Engine Industry Volume (K Unit) Forecast, by Application 2019 & 2032
- Table 39: Global Gas Engine Industry Revenue Million Forecast, by Country 2019 & 2032
- Table 40: Global Gas Engine Industry Volume K Unit Forecast, by Country 2019 & 2032
- Table 41: Brazil Gas Engine Industry Revenue (Million) Forecast, by Application 2019 & 2032
- Table 42: Brazil Gas Engine Industry Volume (K Unit) Forecast, by Application 2019 & 2032
- Table 43: Argentina Gas Engine Industry Revenue (Million) Forecast, by Application 2019 & 2032
- Table 44: Argentina Gas Engine Industry Volume (K Unit) Forecast, by Application 2019 & 2032
- Table 45: Rest of South America Gas Engine Industry Revenue (Million) Forecast, by Application 2019 & 2032
- Table 46: Rest of South America Gas Engine Industry Volume (K Unit) Forecast, by Application 2019 & 2032
- Table 47: Global Gas Engine Industry Revenue Million Forecast, by Country 2019 & 2032
- Table 48: Global Gas Engine Industry Volume K Unit Forecast, by Country 2019 & 2032
- Table 49: Saudi Arabia Gas Engine Industry Revenue (Million) Forecast, by Application 2019 & 2032
- Table 50: Saudi Arabia Gas Engine Industry Volume (K Unit) Forecast, by Application 2019 & 2032
- Table 51: United Arab Emirates Gas Engine Industry Revenue (Million) Forecast, by Application 2019 & 2032
- Table 52: United Arab Emirates Gas Engine Industry Volume (K Unit) Forecast, by Application 2019 & 2032
- Table 53: South Africa Gas Engine Industry Revenue (Million) Forecast, by Application 2019 & 2032
- Table 54: South Africa Gas Engine Industry Volume (K Unit) Forecast, by Application 2019 & 2032
- Table 55: Rest of Middle East and Africa Gas Engine Industry Revenue (Million) Forecast, by Application 2019 & 2032
- Table 56: Rest of Middle East and Africa Gas Engine Industry Volume (K Unit) Forecast, by Application 2019 & 2032
- Table 57: Global Gas Engine Industry Revenue Million Forecast, by End-User 2019 & 2032
- Table 58: Global Gas Engine Industry Volume K Unit Forecast, by End-User 2019 & 2032
- Table 59: Global Gas Engine Industry Revenue Million Forecast, by Fuel Type 2019 & 2032
- Table 60: Global Gas Engine Industry Volume K Unit Forecast, by Fuel Type 2019 & 2032
- Table 61: Global Gas Engine Industry Revenue Million Forecast, by Country 2019 & 2032
- Table 62: Global Gas Engine Industry Volume K Unit Forecast, by Country 2019 & 2032
- Table 63: United States Gas Engine Industry Revenue (Million) Forecast, by Application 2019 & 2032
- Table 64: United States Gas Engine Industry Volume (K Unit) Forecast, by Application 2019 & 2032
- Table 65: Canada Gas Engine Industry Revenue (Million) Forecast, by Application 2019 & 2032
- Table 66: Canada Gas Engine Industry Volume (K Unit) Forecast, by Application 2019 & 2032
- Table 67: Rest of North America Gas Engine Industry Revenue (Million) Forecast, by Application 2019 & 2032
- Table 68: Rest of North America Gas Engine Industry Volume (K Unit) Forecast, by Application 2019 & 2032
- Table 69: Global Gas Engine Industry Revenue Million Forecast, by End-User 2019 & 2032
- Table 70: Global Gas Engine Industry Volume K Unit Forecast, by End-User 2019 & 2032
- Table 71: Global Gas Engine Industry Revenue Million Forecast, by Fuel Type 2019 & 2032
- Table 72: Global Gas Engine Industry Volume K Unit Forecast, by Fuel Type 2019 & 2032
- Table 73: Global Gas Engine Industry Revenue Million Forecast, by Country 2019 & 2032
- Table 74: Global Gas Engine Industry Volume K Unit Forecast, by Country 2019 & 2032
- Table 75: Germany Gas Engine Industry Revenue (Million) Forecast, by Application 2019 & 2032
- Table 76: Germany Gas Engine Industry Volume (K Unit) Forecast, by Application 2019 & 2032
- Table 77: France Gas Engine Industry Revenue (Million) Forecast, by Application 2019 & 2032
- Table 78: France Gas Engine Industry Volume (K Unit) Forecast, by Application 2019 & 2032
- Table 79: United Kingdom Gas Engine Industry Revenue (Million) Forecast, by Application 2019 & 2032
- Table 80: United Kingdom Gas Engine Industry Volume (K Unit) Forecast, by Application 2019 & 2032
- Table 81: Rest of Europe Gas Engine Industry Revenue (Million) Forecast, by Application 2019 & 2032
- Table 82: Rest of Europe Gas Engine Industry Volume (K Unit) Forecast, by Application 2019 & 2032
- Table 83: Global Gas Engine Industry Revenue Million Forecast, by End-User 2019 & 2032
- Table 84: Global Gas Engine Industry Volume K Unit Forecast, by End-User 2019 & 2032
- Table 85: Global Gas Engine Industry Revenue Million Forecast, by Fuel Type 2019 & 2032
- Table 86: Global Gas Engine Industry Volume K Unit Forecast, by Fuel Type 2019 & 2032
- Table 87: Global Gas Engine Industry Revenue Million Forecast, by Country 2019 & 2032
- Table 88: Global Gas Engine Industry Volume K Unit Forecast, by Country 2019 & 2032
- Table 89: China Gas Engine Industry Revenue (Million) Forecast, by Application 2019 & 2032
- Table 90: China Gas Engine Industry Volume (K Unit) Forecast, by Application 2019 & 2032
- Table 91: India Gas Engine Industry Revenue (Million) Forecast, by Application 2019 & 2032
- Table 92: India Gas Engine Industry Volume (K Unit) Forecast, by Application 2019 & 2032
- Table 93: Japan Gas Engine Industry Revenue (Million) Forecast, by Application 2019 & 2032
- Table 94: Japan Gas Engine Industry Volume (K Unit) Forecast, by Application 2019 & 2032
- Table 95: South Korea Gas Engine Industry Revenue (Million) Forecast, by Application 2019 & 2032
- Table 96: South Korea Gas Engine Industry Volume (K Unit) Forecast, by Application 2019 & 2032
- Table 97: Rest of Asia Pacific Gas Engine Industry Revenue (Million) Forecast, by Application 2019 & 2032
- Table 98: Rest of Asia Pacific Gas Engine Industry Volume (K Unit) Forecast, by Application 2019 & 2032
- Table 99: Global Gas Engine Industry Revenue Million Forecast, by End-User 2019 & 2032
- Table 100: Global Gas Engine Industry Volume K Unit Forecast, by End-User 2019 & 2032
- Table 101: Global Gas Engine Industry Revenue Million Forecast, by Fuel Type 2019 & 2032
- Table 102: Global Gas Engine Industry Volume K Unit Forecast, by Fuel Type 2019 & 2032
- Table 103: Global Gas Engine Industry Revenue Million Forecast, by Country 2019 & 2032
- Table 104: Global Gas Engine Industry Volume K Unit Forecast, by Country 2019 & 2032
- Table 105: Brazil Gas Engine Industry Revenue (Million) Forecast, by Application 2019 & 2032
- Table 106: Brazil Gas Engine Industry Volume (K Unit) Forecast, by Application 2019 & 2032
- Table 107: Argentina Gas Engine Industry Revenue (Million) Forecast, by Application 2019 & 2032
- Table 108: Argentina Gas Engine Industry Volume (K Unit) Forecast, by Application 2019 & 2032
- Table 109: Rest of South America Gas Engine Industry Revenue (Million) Forecast, by Application 2019 & 2032
- Table 110: Rest of South America Gas Engine Industry Volume (K Unit) Forecast, by Application 2019 & 2032
- Table 111: Global Gas Engine Industry Revenue Million Forecast, by End-User 2019 & 2032
- Table 112: Global Gas Engine Industry Volume K Unit Forecast, by End-User 2019 & 2032
- Table 113: Global Gas Engine Industry Revenue Million Forecast, by Fuel Type 2019 & 2032
- Table 114: Global Gas Engine Industry Volume K Unit Forecast, by Fuel Type 2019 & 2032
- Table 115: Global Gas Engine Industry Revenue Million Forecast, by Country 2019 & 2032
- Table 116: Global Gas Engine Industry Volume K Unit Forecast, by Country 2019 & 2032
- Table 117: Saudi Arabia Gas Engine Industry Revenue (Million) Forecast, by Application 2019 & 2032
- Table 118: Saudi Arabia Gas Engine Industry Volume (K Unit) Forecast, by Application 2019 & 2032
- Table 119: United Arab Emirates Gas Engine Industry Revenue (Million) Forecast, by Application 2019 & 2032
- Table 120: United Arab Emirates Gas Engine Industry Volume (K Unit) Forecast, by Application 2019 & 2032
- Table 121: South Africa Gas Engine Industry Revenue (Million) Forecast, by Application 2019 & 2032
- Table 122: South Africa Gas Engine Industry Volume (K Unit) Forecast, by Application 2019 & 2032
- Table 123: Rest of Middle East and Africa Gas Engine Industry Revenue (Million) Forecast, by Application 2019 & 2032
- Table 124: Rest of Middle East and Africa Gas Engine Industry Volume (K Unit) Forecast, by Application 2019 & 2032
Frequently Asked Questions
1. What is the projected Compound Annual Growth Rate (CAGR) of the Gas Engine Industry?
The projected CAGR is approximately 5.74%.
2. Which companies are prominent players in the Gas Engine Industry?
Key companies in the market include Rolls-Royce Holdings PLC, Siemens AG, Hyundai Heavy Industries Co Ltd, Caterpillar Inc, Wartsila Oyj Abp, Liebherr Group*List Not Exhaustive, Cummins Inc, General Electric Company, Kawasaki Heavy Industries Ltd, JFE Engineering Corporation, Man SE, Mitsubishi Heavy Industries Ltd.
3. What are the main segments of the Gas Engine Industry?
The market segments include End-User, Fuel Type.
4. Can you provide details about the market size?
The market size is estimated to be USD 5.91 Million as of 2022.
5. What are some drivers contributing to market growth?
4.; Increasing Supply and Consumption of Gas-based Systems in Various End-user Industry4.; Implementation of stricter emission regulations worldwide.
6. What are the notable trends driving market growth?
Power Utilities Expected to Witness Significant Growth.
7. Are there any restraints impacting market growth?
4.; Growing Inclination towards Renewable Sources.
8. Can you provide examples of recent developments in the market?
In March 2023, ITP Aero, a Spanish aircraft engine company, has announced that it is leading a national consortium to test and develop the first hydrogen-fueled commercial aircraft engine developed locally. As part of the Spanish Ministry of Science agency's Aeronautical Technology Plan, managed by CDTI, the Spanish Center for Technological Development and Innovation, the USD 13 million Cryogenics, Fuel Cells and Hydrogen Combustion in Air Transport project is co-funded by European Union Next Gen strategic investment funding.
9. What pricing options are available for accessing the report?
Pricing options include single-user, multi-user, and enterprise licenses priced at USD 4750, USD 5250, and USD 8750 respectively.
10. Is the market size provided in terms of value or volume?
The market size is provided in terms of value, measured in Million and volume, measured in K Unit.
11. Are there any specific market keywords associated with the report?
Yes, the market keyword associated with the report is "Gas Engine Industry," which aids in identifying and referencing the specific market segment covered.
12. How do I determine which pricing option suits my needs best?
The pricing options vary based on user requirements and access needs. Individual users may opt for single-user licenses, while businesses requiring broader access may choose multi-user or enterprise licenses for cost-effective access to the report.
13. Are there any additional resources or data provided in the Gas Engine Industry report?
While the report offers comprehensive insights, it's advisable to review the specific contents or supplementary materials provided to ascertain if additional resources or data are available.
14. How can I stay updated on further developments or reports in the Gas Engine Industry?
To stay informed about further developments, trends, and reports in the Gas Engine Industry, consider subscribing to industry newsletters, following relevant companies and organizations, or regularly checking reputable industry news sources and publications.
Methodology
Step 1 - Identification of Relevant Samples Size from Population Database


Step 2 - Approaches for Defining Global Market Size (Value, Volume* & Price*)

Note*: In applicable scenarios
Step 3 - Data Sources
Primary Research
- Web Analytics
- Survey Reports
- Research Institute
- Latest Research Reports
- Opinion Leaders
Secondary Research
- Annual Reports
- White Paper
- Latest Press Release
- Industry Association
- Paid Database
- Investor Presentations

Step 4 - Data Triangulation
Involves using different sources of information in order to increase the validity of a study
These sources are likely to be stakeholders in a program - participants, other researchers, program staff, other community members, and so on.
Then we put all data in single framework & apply various statistical tools to find out the dynamic on the market.
During the analysis stage, feedback from the stakeholder groups would be compared to determine areas of agreement as well as areas of divergence


