
Key Insights
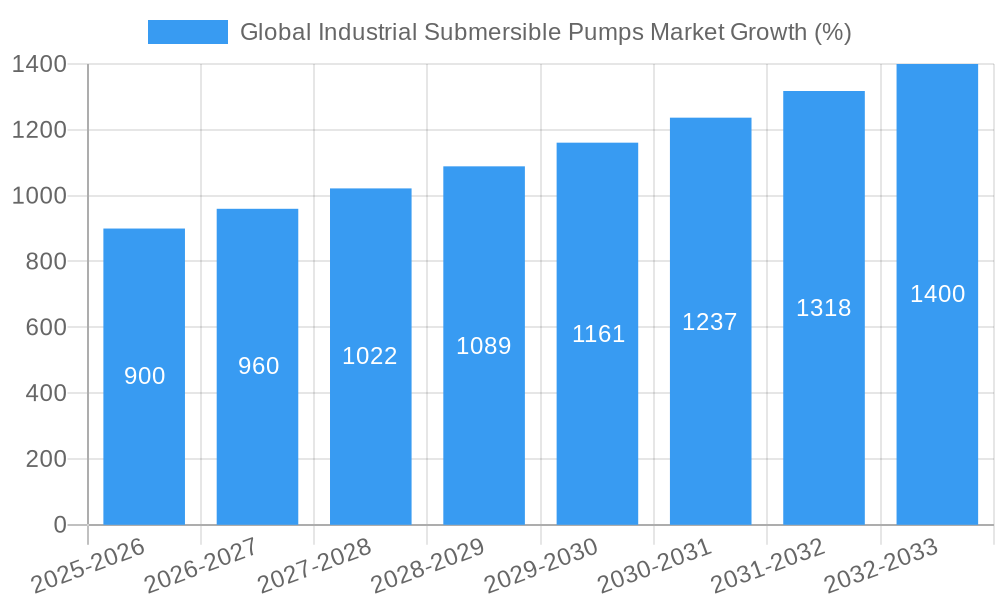
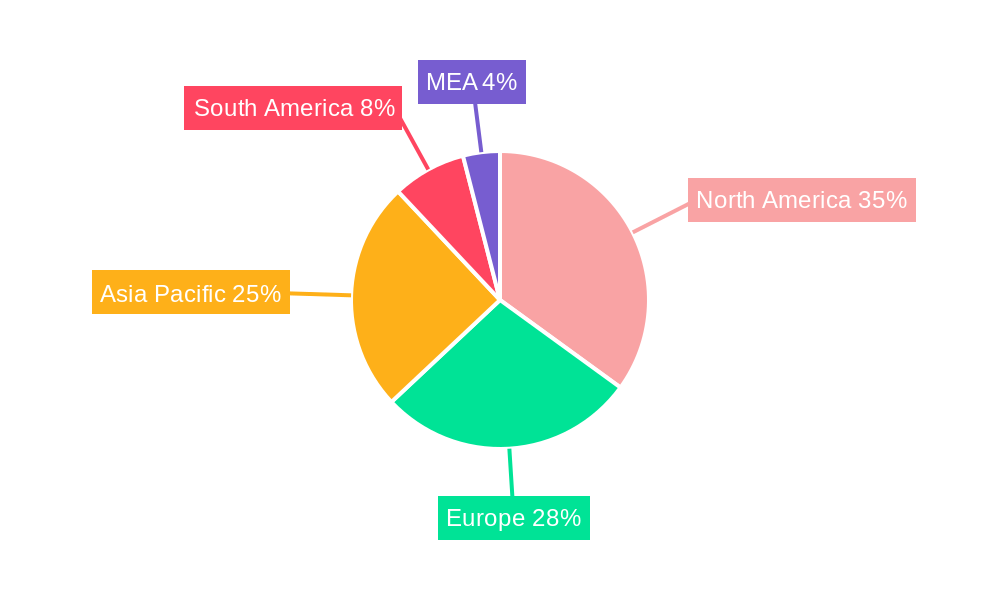
The global industrial submersible pumps market is experiencing robust growth, projected to reach a significant market size by 2033. A compound annual growth rate (CAGR) of 5.76% from 2025 to 2033 indicates a consistently expanding market driven by several key factors. Increased demand across various end-user industries, particularly water and wastewater treatment, mining and construction, and oil and gas, is a primary driver. The rising need for efficient and reliable pumping solutions in these sectors, coupled with advancements in pump technology—such as the adoption of more energy-efficient electric submersible pumps—is fueling market expansion. Furthermore, stringent environmental regulations promoting sustainable water management and responsible resource extraction are indirectly bolstering the demand for these pumps. The market segmentation reveals a strong preference for electric drive-type pumps due to their efficiency and lower maintenance compared to hydraulic alternatives. Geographically, North America and Asia-Pacific are expected to be major contributors to market growth, driven by robust infrastructure development and industrial activity in these regions.
However, the market faces certain restraints. Fluctuations in raw material prices, particularly for metals used in pump manufacturing, can impact profitability and pricing. Additionally, the initial high capital investment required for implementing advanced pump systems might deter some smaller businesses. Nonetheless, ongoing technological advancements focusing on improved durability, enhanced efficiency, and remote monitoring capabilities are mitigating these challenges. The competitive landscape is marked by the presence of both established global players and regional manufacturers. This competitive dynamic is driving innovation and leading to the development of more sophisticated and cost-effective solutions, further contributing to market growth. The long-term outlook remains positive, with continuous expansion driven by the persistent demand for efficient and reliable pumping systems across diverse industrial applications.
Global Industrial Submersible Pumps Market Report: 2019-2033
This comprehensive report provides an in-depth analysis of the global industrial submersible pumps market, offering invaluable insights for industry professionals, investors, and strategic decision-makers. Covering the period from 2019 to 2033, with a focus on 2025, this report unravels market dynamics, identifies key players, and forecasts future growth trajectories. Leveraging rigorous research and data analysis, this report is essential for navigating the complexities of this dynamic market.
Global Industrial Submersible Pumps Market Structure & Innovation Trends
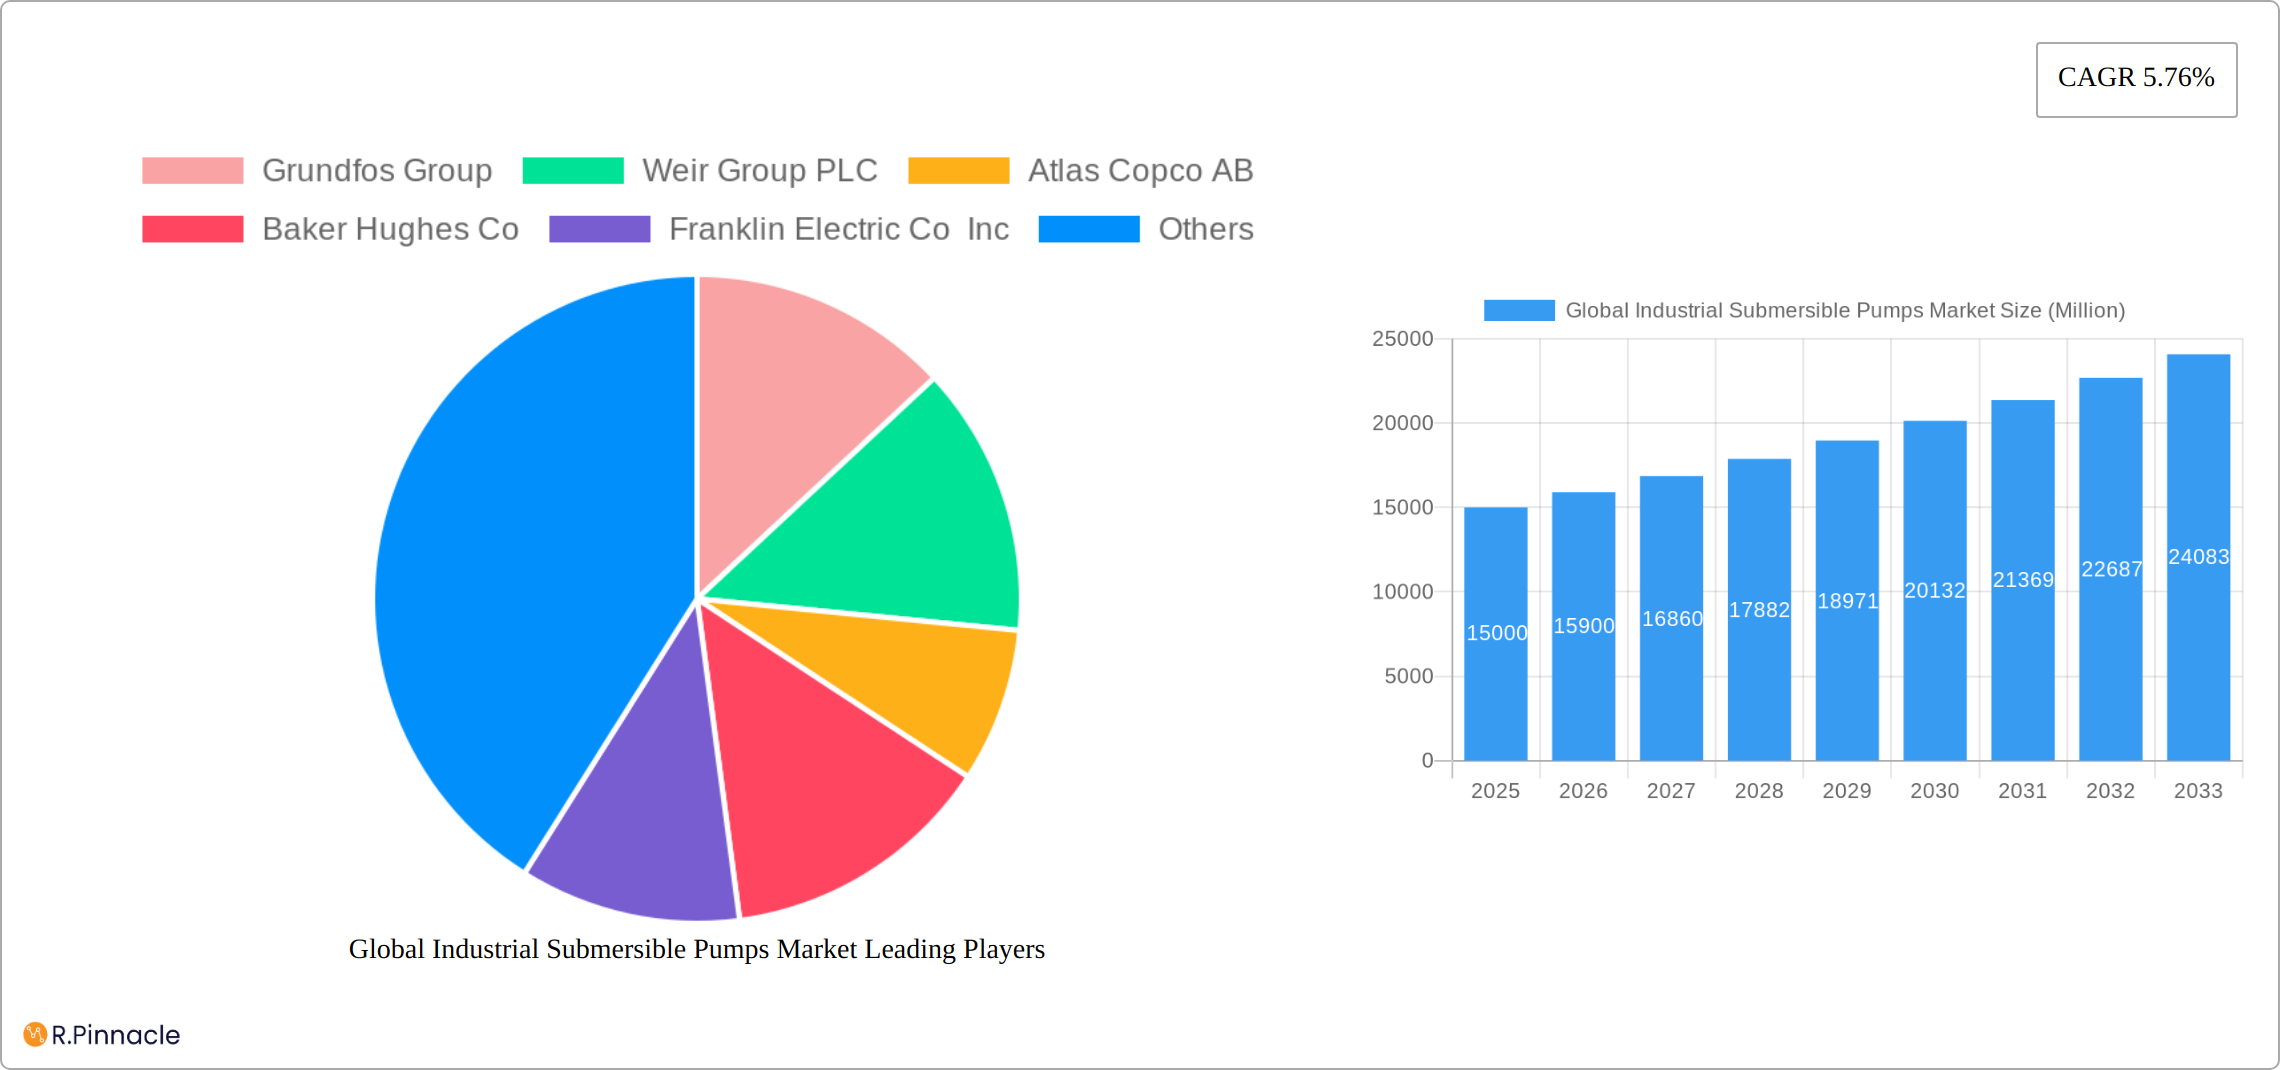
This section analyzes the competitive landscape, innovation drivers, and regulatory factors shaping the global industrial submersible pumps market. The market exhibits moderate concentration, with key players such as Grundfos Group, Weir Group PLC, and Atlas Copco AB holding significant market share. However, the market also features several smaller players contributing to the overall dynamics. Innovation is driven by the increasing demand for energy-efficient and environmentally friendly pumps, leading to advancements in materials, design, and control systems. Stringent environmental regulations regarding wastewater treatment and energy consumption are major drivers pushing innovation. Product substitutes, such as centrifugal pumps, exist but often lack the versatility and efficiency of submersible pumps in certain applications. M&A activity has been moderate in recent years, with deal values averaging approximately xx Million annually.
- Market Concentration: Moderately concentrated, with top 5 players holding approximately xx% market share in 2025.
- Innovation Drivers: Energy efficiency, environmental regulations, advancements in materials science.
- Regulatory Frameworks: Stringent emission and energy-efficiency standards in developed countries.
- Product Substitutes: Centrifugal pumps, but with limited application overlap.
- End-User Demographics: Diverse, spanning various sectors including water & wastewater, mining, and oil & gas.
- M&A Activity: Moderate, with average annual deal values of xx Million in the historical period.
Global Industrial Submersible Pumps Market Dynamics & Trends
The global industrial submersible pumps market is experiencing steady growth, driven by increasing urbanization, industrialization, and the rising demand for water and wastewater management solutions. Technological advancements, such as the adoption of smart pumps with advanced monitoring and control systems, are further boosting market expansion. Consumer preference for energy-efficient and reliable pumps is also shaping market trends. The market is characterized by intense competition, with established players constantly striving to enhance product offerings and expand their market presence. This intense competition fosters innovation and cost optimization. The market's CAGR is estimated to be xx% during the forecast period (2025-2033), with significant market penetration in emerging economies.
Dominant Regions & Segments in Global Industrial Submersible Pumps Market
The North American and European regions are currently dominant in the global industrial submersible pumps market due to strong industrial presence, robust infrastructure, and stringent environmental regulations. However, significant growth is expected from Asia-Pacific region, driven by infrastructural development and industrial expansion.
By Drive Type:
- Electric: Holds the largest market share driven by its efficiency and ease of control.
- Hydraulic: A smaller share, primarily used in high-pressure applications.
- Others: A niche segment, representing newer technologies and specialized applications.
By End-Users:
- Water & Wastewater: This segment dominates due to the large-scale water treatment facilities globally.
- Mining & Construction: Significant growth potential due to the continuous expansion of infrastructure.
- Oil and Gas: This industry requires specialized, high-pressure pumps.
- Food and Beverage: This industry requires high-sanitation and specialized pumps.
- Other End-Users: A varied range of applications contribute moderately.
Key Drivers by Region:
- North America: Stringent environmental regulations, strong industrial base.
- Europe: High demand for water management solutions, advanced technology adoption.
- Asia-Pacific: Rapid infrastructure development, industrial growth in developing economies.
Global Industrial Submersible Pumps Market Product Innovations
Recent innovations in industrial submersible pumps have focused on enhancing energy efficiency, improving reliability, and expanding functionalities. Manufacturers are incorporating advanced materials, such as corrosion-resistant alloys, to improve durability and extend the lifespan of pumps. Smart pumps with remote monitoring capabilities are gaining traction, enabling predictive maintenance and optimizing operational efficiency. New designs focus on reducing noise pollution and improving overall performance in demanding environments. These innovations cater to a growing demand for cost-effective and sustainable solutions across diverse applications.
Report Scope & Segmentation Analysis
This report provides a comprehensive segmentation analysis of the global industrial submersible pumps market, considering key factors driving market growth and future projections. The market is segmented by drive type (electric, hydraulic, pneumatic, and others), offering a detailed examination of each segment's market size, growth rate, and competitive landscape. The electric drive type segment is expected to dominate, fueled by increasing demand for energy-efficient and cost-effective solutions. Further segmentation by end-user industry includes water & wastewater treatment, mining & construction, oil and gas extraction, food and beverage processing, chemical processing, and other industrial applications. Each end-user segment's specific needs and growth potential are thoroughly analyzed, considering factors such as regulatory changes, technological advancements, and infrastructure development. The report also incorporates detailed analysis of regional market variations, considering factors like economic growth, industrial activity, and government policies influencing the adoption of industrial submersible pumps. This granular approach provides a robust understanding of the market's dynamics and opportunities.
Key Drivers of Global Industrial Submersible Pumps Market Growth
Several factors fuel the growth of the global industrial submersible pumps market. Rising industrialization and urbanization create a significant demand for efficient water management solutions. Stringent environmental regulations and the increasing awareness of water conservation further stimulate market expansion. Technological advancements, such as the development of smart pumps with enhanced features, drive market growth. The growing need for energy-efficient pumps adds to the market's positive momentum.
Challenges in the Global Industrial Submersible Pumps Market Sector
The industrial submersible pumps market faces several challenges, including fluctuating raw material prices impacting manufacturing costs. Supply chain disruptions can cause delays and hinder production, impacting overall market availability and pricing. Intense competition from both established and emerging players puts pressure on profit margins. Stricter environmental regulations increase the complexity and cost of product development and manufacturing.
Emerging Opportunities in Global Industrial Submersible Pumps Market
The global industrial submersible pumps market is poised for significant growth, driven by several emerging opportunities. Developing economies are experiencing rapid industrialization and infrastructure development, creating substantial demand for reliable and efficient pumping solutions. The increasing adoption of smart technologies, including IoT (Internet of Things) and AI (Artificial Intelligence), is enabling the development of intelligent pump systems with enhanced monitoring, predictive maintenance, and optimized performance. Furthermore, the growing focus on sustainability and energy efficiency is driving the adoption of energy-saving pump technologies and eco-friendly materials. The demand for customized solutions tailored to specific industry needs presents opportunities for niche market penetration. Advancements in materials science are leading to the development of more durable and corrosion-resistant pumps, extending their lifespan and reducing maintenance costs. The increasing need for water management solutions in various sectors also presents a significant growth opportunity.
Leading Players in the Global Industrial Submersible Pumps Market Market
- Grundfos Group
- Weir Group PLC
- Atlas Copco AB
- Baker Hughes Co
- Franklin Electric Co Inc
- Borets International Ltd
- Halliburton Co
- Ebara Corporation
- The Gorman-Rupp Company
- Schlumberger Limited
Key Developments in Global Industrial Submersible Pumps Market Industry
- January 2021: Atlas Copco Power and Flow completes its WEDA electric submersible dewatering pump portfolio, expanding the WEDA D, WEDA S, and introducing the WEDA L slurry family. This significantly enhances their product offerings in the dewatering market.
Future Outlook for Global Industrial Submersible Pumps Market Market
The future of the global industrial submersible pumps market looks promising, driven by the continuous growth of key end-use industries and the adoption of advanced technologies. Strategic partnerships, technological innovation, and expansion into emerging markets will play a crucial role in shaping the future landscape. Focus on sustainability and energy efficiency will further define market success. The market is poised for sustained growth, offering attractive opportunities for investors and industry players alike.
Global Industrial Submersible Pumps Market Segmentation
-
1. Drive Type
- 1.1. Electric
- 1.2. Hydraulic
- 1.3. Others
-
2. End-users
- 2.1. Water & Wastewater
- 2.2. Mining & Construction
- 2.3. Oil and Gas
- 2.4. Food and Beverage
- 2.5. Other End-users
Global Industrial Submersible Pumps Market Segmentation By Geography
-
1. North America
- 1.1. United States
- 1.2. Canada
-
2. Europe
- 2.1. United Kingdom
- 2.2. Germany
- 2.3. France
- 2.4. Rest of Europe
-
3. Asia Pacific
- 3.1. China
- 3.2. India
- 3.3. Japan
- 3.4. Rest of Asia Pacific
-
4. Rest of the World
- 4.1. Latin America
- 4.2. Middle East and Africa
Global Industrial Submersible Pumps Market REPORT HIGHLIGHTS
| Aspects | Details |
|---|---|
| Study Period | 2019-2033 |
| Base Year | 2024 |
| Estimated Year | 2025 |
| Forecast Period | 2025-2033 |
| Historical Period | 2019-2024 |
| Growth Rate | CAGR of 5.76% from 2019-2033 |
| Segmentation |
|
Table of Contents
- 1. Introduction
- 1.1. Research Scope
- 1.2. Market Segmentation
- 1.3. Research Methodology
- 1.4. Definitions and Assumptions
- 2. Executive Summary
- 2.1. Introduction
- 3. Market Dynamics
- 3.1. Introduction
- 3.2. Market Drivers
- 3.2.1. Growing Manufactruing Sector; Upgradation of aging and construction of new water & wastewater treatment facilities
- 3.3. Market Restrains
- 3.3.1. High Maintenance Cost Over the Entire Lifespan is Challenging the Market Growth
- 3.4. Market Trends
- 3.4.1. Oil and Gas Industry is Expected to Hold Major Share
- 4. Market Factor Analysis
- 4.1. Porters Five Forces
- 4.2. Supply/Value Chain
- 4.3. PESTEL analysis
- 4.4. Market Entropy
- 4.5. Patent/Trademark Analysis
- 5. Global Industrial Submersible Pumps Market Analysis, Insights and Forecast, 2019-2031
- 5.1. Market Analysis, Insights and Forecast - by Drive Type
- 5.1.1. Electric
- 5.1.2. Hydraulic
- 5.1.3. Others
- 5.2. Market Analysis, Insights and Forecast - by End-users
- 5.2.1. Water & Wastewater
- 5.2.2. Mining & Construction
- 5.2.3. Oil and Gas
- 5.2.4. Food and Beverage
- 5.2.5. Other End-users
- 5.3. Market Analysis, Insights and Forecast - by Region
- 5.3.1. North America
- 5.3.2. Europe
- 5.3.3. Asia Pacific
- 5.3.4. Rest of the World
- 5.1. Market Analysis, Insights and Forecast - by Drive Type
- 6. North America Global Industrial Submersible Pumps Market Analysis, Insights and Forecast, 2019-2031
- 6.1. Market Analysis, Insights and Forecast - by Drive Type
- 6.1.1. Electric
- 6.1.2. Hydraulic
- 6.1.3. Others
- 6.2. Market Analysis, Insights and Forecast - by End-users
- 6.2.1. Water & Wastewater
- 6.2.2. Mining & Construction
- 6.2.3. Oil and Gas
- 6.2.4. Food and Beverage
- 6.2.5. Other End-users
- 6.1. Market Analysis, Insights and Forecast - by Drive Type
- 7. Europe Global Industrial Submersible Pumps Market Analysis, Insights and Forecast, 2019-2031
- 7.1. Market Analysis, Insights and Forecast - by Drive Type
- 7.1.1. Electric
- 7.1.2. Hydraulic
- 7.1.3. Others
- 7.2. Market Analysis, Insights and Forecast - by End-users
- 7.2.1. Water & Wastewater
- 7.2.2. Mining & Construction
- 7.2.3. Oil and Gas
- 7.2.4. Food and Beverage
- 7.2.5. Other End-users
- 7.1. Market Analysis, Insights and Forecast - by Drive Type
- 8. Asia Pacific Global Industrial Submersible Pumps Market Analysis, Insights and Forecast, 2019-2031
- 8.1. Market Analysis, Insights and Forecast - by Drive Type
- 8.1.1. Electric
- 8.1.2. Hydraulic
- 8.1.3. Others
- 8.2. Market Analysis, Insights and Forecast - by End-users
- 8.2.1. Water & Wastewater
- 8.2.2. Mining & Construction
- 8.2.3. Oil and Gas
- 8.2.4. Food and Beverage
- 8.2.5. Other End-users
- 8.1. Market Analysis, Insights and Forecast - by Drive Type
- 9. Rest of the World Global Industrial Submersible Pumps Market Analysis, Insights and Forecast, 2019-2031
- 9.1. Market Analysis, Insights and Forecast - by Drive Type
- 9.1.1. Electric
- 9.1.2. Hydraulic
- 9.1.3. Others
- 9.2. Market Analysis, Insights and Forecast - by End-users
- 9.2.1. Water & Wastewater
- 9.2.2. Mining & Construction
- 9.2.3. Oil and Gas
- 9.2.4. Food and Beverage
- 9.2.5. Other End-users
- 9.1. Market Analysis, Insights and Forecast - by Drive Type
- 10. North America Global Industrial Submersible Pumps Market Analysis, Insights and Forecast, 2019-2031
- 10.1. Market Analysis, Insights and Forecast - By Country/Sub-region
- 10.1.1 United States
- 10.1.2 Canada
- 10.1.3 Mexico
- 11. Europe Global Industrial Submersible Pumps Market Analysis, Insights and Forecast, 2019-2031
- 11.1. Market Analysis, Insights and Forecast - By Country/Sub-region
- 11.1.1 Germany
- 11.1.2 United Kingdom
- 11.1.3 France
- 11.1.4 Spain
- 11.1.5 Italy
- 11.1.6 Spain
- 11.1.7 Belgium
- 11.1.8 Netherland
- 11.1.9 Nordics
- 11.1.10 Rest of Europe
- 12. Asia Pacific Global Industrial Submersible Pumps Market Analysis, Insights and Forecast, 2019-2031
- 12.1. Market Analysis, Insights and Forecast - By Country/Sub-region
- 12.1.1 China
- 12.1.2 Japan
- 12.1.3 India
- 12.1.4 South Korea
- 12.1.5 Southeast Asia
- 12.1.6 Australia
- 12.1.7 Indonesia
- 12.1.8 Phillipes
- 12.1.9 Singapore
- 12.1.10 Thailandc
- 12.1.11 Rest of Asia Pacific
- 13. South America Global Industrial Submersible Pumps Market Analysis, Insights and Forecast, 2019-2031
- 13.1. Market Analysis, Insights and Forecast - By Country/Sub-region
- 13.1.1 Brazil
- 13.1.2 Argentina
- 13.1.3 Peru
- 13.1.4 Chile
- 13.1.5 Colombia
- 13.1.6 Ecuador
- 13.1.7 Venezuela
- 13.1.8 Rest of South America
- 14. North America Global Industrial Submersible Pumps Market Analysis, Insights and Forecast, 2019-2031
- 14.1. Market Analysis, Insights and Forecast - By Country/Sub-region
- 14.1.1 United States
- 14.1.2 Canada
- 14.1.3 Mexico
- 15. MEA Global Industrial Submersible Pumps Market Analysis, Insights and Forecast, 2019-2031
- 15.1. Market Analysis, Insights and Forecast - By Country/Sub-region
- 15.1.1 United Arab Emirates
- 15.1.2 Saudi Arabia
- 15.1.3 South Africa
- 15.1.4 Rest of Middle East and Africa
- 16. Competitive Analysis
- 16.1. Market Share Analysis 2024
- 16.2. Company Profiles
- 16.2.1 Grundfos Group
- 16.2.1.1. Overview
- 16.2.1.2. Products
- 16.2.1.3. SWOT Analysis
- 16.2.1.4. Recent Developments
- 16.2.1.5. Financials (Based on Availability)
- 16.2.2 Weir Group PLC
- 16.2.2.1. Overview
- 16.2.2.2. Products
- 16.2.2.3. SWOT Analysis
- 16.2.2.4. Recent Developments
- 16.2.2.5. Financials (Based on Availability)
- 16.2.3 Atlas Copco AB
- 16.2.3.1. Overview
- 16.2.3.2. Products
- 16.2.3.3. SWOT Analysis
- 16.2.3.4. Recent Developments
- 16.2.3.5. Financials (Based on Availability)
- 16.2.4 Baker Hughes Co
- 16.2.4.1. Overview
- 16.2.4.2. Products
- 16.2.4.3. SWOT Analysis
- 16.2.4.4. Recent Developments
- 16.2.4.5. Financials (Based on Availability)
- 16.2.5 Franklin Electric Co Inc
- 16.2.5.1. Overview
- 16.2.5.2. Products
- 16.2.5.3. SWOT Analysis
- 16.2.5.4. Recent Developments
- 16.2.5.5. Financials (Based on Availability)
- 16.2.6 Borets International Ltd
- 16.2.6.1. Overview
- 16.2.6.2. Products
- 16.2.6.3. SWOT Analysis
- 16.2.6.4. Recent Developments
- 16.2.6.5. Financials (Based on Availability)
- 16.2.7 Halliburton Co
- 16.2.7.1. Overview
- 16.2.7.2. Products
- 16.2.7.3. SWOT Analysis
- 16.2.7.4. Recent Developments
- 16.2.7.5. Financials (Based on Availability)
- 16.2.8 Ebara Corporation
- 16.2.8.1. Overview
- 16.2.8.2. Products
- 16.2.8.3. SWOT Analysis
- 16.2.8.4. Recent Developments
- 16.2.8.5. Financials (Based on Availability)
- 16.2.9 The Gorman-Rupp Company
- 16.2.9.1. Overview
- 16.2.9.2. Products
- 16.2.9.3. SWOT Analysis
- 16.2.9.4. Recent Developments
- 16.2.9.5. Financials (Based on Availability)
- 16.2.10 Schlumberger Limited
- 16.2.10.1. Overview
- 16.2.10.2. Products
- 16.2.10.3. SWOT Analysis
- 16.2.10.4. Recent Developments
- 16.2.10.5. Financials (Based on Availability)
- 16.2.1 Grundfos Group
List of Figures
- Figure 1: Global Global Industrial Submersible Pumps Market Revenue Breakdown (Million, %) by Region 2024 & 2032
- Figure 2: Global Global Industrial Submersible Pumps Market Volume Breakdown (K Unit, %) by Region 2024 & 2032
- Figure 3: North America Global Industrial Submersible Pumps Market Revenue (Million), by Country 2024 & 2032
- Figure 4: North America Global Industrial Submersible Pumps Market Volume (K Unit), by Country 2024 & 2032
- Figure 5: North America Global Industrial Submersible Pumps Market Revenue Share (%), by Country 2024 & 2032
- Figure 6: North America Global Industrial Submersible Pumps Market Volume Share (%), by Country 2024 & 2032
- Figure 7: Europe Global Industrial Submersible Pumps Market Revenue (Million), by Country 2024 & 2032
- Figure 8: Europe Global Industrial Submersible Pumps Market Volume (K Unit), by Country 2024 & 2032
- Figure 9: Europe Global Industrial Submersible Pumps Market Revenue Share (%), by Country 2024 & 2032
- Figure 10: Europe Global Industrial Submersible Pumps Market Volume Share (%), by Country 2024 & 2032
- Figure 11: Asia Pacific Global Industrial Submersible Pumps Market Revenue (Million), by Country 2024 & 2032
- Figure 12: Asia Pacific Global Industrial Submersible Pumps Market Volume (K Unit), by Country 2024 & 2032
- Figure 13: Asia Pacific Global Industrial Submersible Pumps Market Revenue Share (%), by Country 2024 & 2032
- Figure 14: Asia Pacific Global Industrial Submersible Pumps Market Volume Share (%), by Country 2024 & 2032
- Figure 15: South America Global Industrial Submersible Pumps Market Revenue (Million), by Country 2024 & 2032
- Figure 16: South America Global Industrial Submersible Pumps Market Volume (K Unit), by Country 2024 & 2032
- Figure 17: South America Global Industrial Submersible Pumps Market Revenue Share (%), by Country 2024 & 2032
- Figure 18: South America Global Industrial Submersible Pumps Market Volume Share (%), by Country 2024 & 2032
- Figure 19: North America Global Industrial Submersible Pumps Market Revenue (Million), by Country 2024 & 2032
- Figure 20: North America Global Industrial Submersible Pumps Market Volume (K Unit), by Country 2024 & 2032
- Figure 21: North America Global Industrial Submersible Pumps Market Revenue Share (%), by Country 2024 & 2032
- Figure 22: North America Global Industrial Submersible Pumps Market Volume Share (%), by Country 2024 & 2032
- Figure 23: MEA Global Industrial Submersible Pumps Market Revenue (Million), by Country 2024 & 2032
- Figure 24: MEA Global Industrial Submersible Pumps Market Volume (K Unit), by Country 2024 & 2032
- Figure 25: MEA Global Industrial Submersible Pumps Market Revenue Share (%), by Country 2024 & 2032
- Figure 26: MEA Global Industrial Submersible Pumps Market Volume Share (%), by Country 2024 & 2032
- Figure 27: North America Global Industrial Submersible Pumps Market Revenue (Million), by Drive Type 2024 & 2032
- Figure 28: North America Global Industrial Submersible Pumps Market Volume (K Unit), by Drive Type 2024 & 2032
- Figure 29: North America Global Industrial Submersible Pumps Market Revenue Share (%), by Drive Type 2024 & 2032
- Figure 30: North America Global Industrial Submersible Pumps Market Volume Share (%), by Drive Type 2024 & 2032
- Figure 31: North America Global Industrial Submersible Pumps Market Revenue (Million), by End-users 2024 & 2032
- Figure 32: North America Global Industrial Submersible Pumps Market Volume (K Unit), by End-users 2024 & 2032
- Figure 33: North America Global Industrial Submersible Pumps Market Revenue Share (%), by End-users 2024 & 2032
- Figure 34: North America Global Industrial Submersible Pumps Market Volume Share (%), by End-users 2024 & 2032
- Figure 35: North America Global Industrial Submersible Pumps Market Revenue (Million), by Country 2024 & 2032
- Figure 36: North America Global Industrial Submersible Pumps Market Volume (K Unit), by Country 2024 & 2032
- Figure 37: North America Global Industrial Submersible Pumps Market Revenue Share (%), by Country 2024 & 2032
- Figure 38: North America Global Industrial Submersible Pumps Market Volume Share (%), by Country 2024 & 2032
- Figure 39: Europe Global Industrial Submersible Pumps Market Revenue (Million), by Drive Type 2024 & 2032
- Figure 40: Europe Global Industrial Submersible Pumps Market Volume (K Unit), by Drive Type 2024 & 2032
- Figure 41: Europe Global Industrial Submersible Pumps Market Revenue Share (%), by Drive Type 2024 & 2032
- Figure 42: Europe Global Industrial Submersible Pumps Market Volume Share (%), by Drive Type 2024 & 2032
- Figure 43: Europe Global Industrial Submersible Pumps Market Revenue (Million), by End-users 2024 & 2032
- Figure 44: Europe Global Industrial Submersible Pumps Market Volume (K Unit), by End-users 2024 & 2032
- Figure 45: Europe Global Industrial Submersible Pumps Market Revenue Share (%), by End-users 2024 & 2032
- Figure 46: Europe Global Industrial Submersible Pumps Market Volume Share (%), by End-users 2024 & 2032
- Figure 47: Europe Global Industrial Submersible Pumps Market Revenue (Million), by Country 2024 & 2032
- Figure 48: Europe Global Industrial Submersible Pumps Market Volume (K Unit), by Country 2024 & 2032
- Figure 49: Europe Global Industrial Submersible Pumps Market Revenue Share (%), by Country 2024 & 2032
- Figure 50: Europe Global Industrial Submersible Pumps Market Volume Share (%), by Country 2024 & 2032
- Figure 51: Asia Pacific Global Industrial Submersible Pumps Market Revenue (Million), by Drive Type 2024 & 2032
- Figure 52: Asia Pacific Global Industrial Submersible Pumps Market Volume (K Unit), by Drive Type 2024 & 2032
- Figure 53: Asia Pacific Global Industrial Submersible Pumps Market Revenue Share (%), by Drive Type 2024 & 2032
- Figure 54: Asia Pacific Global Industrial Submersible Pumps Market Volume Share (%), by Drive Type 2024 & 2032
- Figure 55: Asia Pacific Global Industrial Submersible Pumps Market Revenue (Million), by End-users 2024 & 2032
- Figure 56: Asia Pacific Global Industrial Submersible Pumps Market Volume (K Unit), by End-users 2024 & 2032
- Figure 57: Asia Pacific Global Industrial Submersible Pumps Market Revenue Share (%), by End-users 2024 & 2032
- Figure 58: Asia Pacific Global Industrial Submersible Pumps Market Volume Share (%), by End-users 2024 & 2032
- Figure 59: Asia Pacific Global Industrial Submersible Pumps Market Revenue (Million), by Country 2024 & 2032
- Figure 60: Asia Pacific Global Industrial Submersible Pumps Market Volume (K Unit), by Country 2024 & 2032
- Figure 61: Asia Pacific Global Industrial Submersible Pumps Market Revenue Share (%), by Country 2024 & 2032
- Figure 62: Asia Pacific Global Industrial Submersible Pumps Market Volume Share (%), by Country 2024 & 2032
- Figure 63: Rest of the World Global Industrial Submersible Pumps Market Revenue (Million), by Drive Type 2024 & 2032
- Figure 64: Rest of the World Global Industrial Submersible Pumps Market Volume (K Unit), by Drive Type 2024 & 2032
- Figure 65: Rest of the World Global Industrial Submersible Pumps Market Revenue Share (%), by Drive Type 2024 & 2032
- Figure 66: Rest of the World Global Industrial Submersible Pumps Market Volume Share (%), by Drive Type 2024 & 2032
- Figure 67: Rest of the World Global Industrial Submersible Pumps Market Revenue (Million), by End-users 2024 & 2032
- Figure 68: Rest of the World Global Industrial Submersible Pumps Market Volume (K Unit), by End-users 2024 & 2032
- Figure 69: Rest of the World Global Industrial Submersible Pumps Market Revenue Share (%), by End-users 2024 & 2032
- Figure 70: Rest of the World Global Industrial Submersible Pumps Market Volume Share (%), by End-users 2024 & 2032
- Figure 71: Rest of the World Global Industrial Submersible Pumps Market Revenue (Million), by Country 2024 & 2032
- Figure 72: Rest of the World Global Industrial Submersible Pumps Market Volume (K Unit), by Country 2024 & 2032
- Figure 73: Rest of the World Global Industrial Submersible Pumps Market Revenue Share (%), by Country 2024 & 2032
- Figure 74: Rest of the World Global Industrial Submersible Pumps Market Volume Share (%), by Country 2024 & 2032
List of Tables
- Table 1: Global Industrial Submersible Pumps Market Revenue Million Forecast, by Region 2019 & 2032
- Table 2: Global Industrial Submersible Pumps Market Volume K Unit Forecast, by Region 2019 & 2032
- Table 3: Global Industrial Submersible Pumps Market Revenue Million Forecast, by Drive Type 2019 & 2032
- Table 4: Global Industrial Submersible Pumps Market Volume K Unit Forecast, by Drive Type 2019 & 2032
- Table 5: Global Industrial Submersible Pumps Market Revenue Million Forecast, by End-users 2019 & 2032
- Table 6: Global Industrial Submersible Pumps Market Volume K Unit Forecast, by End-users 2019 & 2032
- Table 7: Global Industrial Submersible Pumps Market Revenue Million Forecast, by Region 2019 & 2032
- Table 8: Global Industrial Submersible Pumps Market Volume K Unit Forecast, by Region 2019 & 2032
- Table 9: Global Industrial Submersible Pumps Market Revenue Million Forecast, by Country 2019 & 2032
- Table 10: Global Industrial Submersible Pumps Market Volume K Unit Forecast, by Country 2019 & 2032
- Table 11: United States Global Industrial Submersible Pumps Market Revenue (Million) Forecast, by Application 2019 & 2032
- Table 12: United States Global Industrial Submersible Pumps Market Volume (K Unit) Forecast, by Application 2019 & 2032
- Table 13: Canada Global Industrial Submersible Pumps Market Revenue (Million) Forecast, by Application 2019 & 2032
- Table 14: Canada Global Industrial Submersible Pumps Market Volume (K Unit) Forecast, by Application 2019 & 2032
- Table 15: Mexico Global Industrial Submersible Pumps Market Revenue (Million) Forecast, by Application 2019 & 2032
- Table 16: Mexico Global Industrial Submersible Pumps Market Volume (K Unit) Forecast, by Application 2019 & 2032
- Table 17: Global Industrial Submersible Pumps Market Revenue Million Forecast, by Country 2019 & 2032
- Table 18: Global Industrial Submersible Pumps Market Volume K Unit Forecast, by Country 2019 & 2032
- Table 19: Germany Global Industrial Submersible Pumps Market Revenue (Million) Forecast, by Application 2019 & 2032
- Table 20: Germany Global Industrial Submersible Pumps Market Volume (K Unit) Forecast, by Application 2019 & 2032
- Table 21: United Kingdom Global Industrial Submersible Pumps Market Revenue (Million) Forecast, by Application 2019 & 2032
- Table 22: United Kingdom Global Industrial Submersible Pumps Market Volume (K Unit) Forecast, by Application 2019 & 2032
- Table 23: France Global Industrial Submersible Pumps Market Revenue (Million) Forecast, by Application 2019 & 2032
- Table 24: France Global Industrial Submersible Pumps Market Volume (K Unit) Forecast, by Application 2019 & 2032
- Table 25: Spain Global Industrial Submersible Pumps Market Revenue (Million) Forecast, by Application 2019 & 2032
- Table 26: Spain Global Industrial Submersible Pumps Market Volume (K Unit) Forecast, by Application 2019 & 2032
- Table 27: Italy Global Industrial Submersible Pumps Market Revenue (Million) Forecast, by Application 2019 & 2032
- Table 28: Italy Global Industrial Submersible Pumps Market Volume (K Unit) Forecast, by Application 2019 & 2032
- Table 29: Spain Global Industrial Submersible Pumps Market Revenue (Million) Forecast, by Application 2019 & 2032
- Table 30: Spain Global Industrial Submersible Pumps Market Volume (K Unit) Forecast, by Application 2019 & 2032
- Table 31: Belgium Global Industrial Submersible Pumps Market Revenue (Million) Forecast, by Application 2019 & 2032
- Table 32: Belgium Global Industrial Submersible Pumps Market Volume (K Unit) Forecast, by Application 2019 & 2032
- Table 33: Netherland Global Industrial Submersible Pumps Market Revenue (Million) Forecast, by Application 2019 & 2032
- Table 34: Netherland Global Industrial Submersible Pumps Market Volume (K Unit) Forecast, by Application 2019 & 2032
- Table 35: Nordics Global Industrial Submersible Pumps Market Revenue (Million) Forecast, by Application 2019 & 2032
- Table 36: Nordics Global Industrial Submersible Pumps Market Volume (K Unit) Forecast, by Application 2019 & 2032
- Table 37: Rest of Europe Global Industrial Submersible Pumps Market Revenue (Million) Forecast, by Application 2019 & 2032
- Table 38: Rest of Europe Global Industrial Submersible Pumps Market Volume (K Unit) Forecast, by Application 2019 & 2032
- Table 39: Global Industrial Submersible Pumps Market Revenue Million Forecast, by Country 2019 & 2032
- Table 40: Global Industrial Submersible Pumps Market Volume K Unit Forecast, by Country 2019 & 2032
- Table 41: China Global Industrial Submersible Pumps Market Revenue (Million) Forecast, by Application 2019 & 2032
- Table 42: China Global Industrial Submersible Pumps Market Volume (K Unit) Forecast, by Application 2019 & 2032
- Table 43: Japan Global Industrial Submersible Pumps Market Revenue (Million) Forecast, by Application 2019 & 2032
- Table 44: Japan Global Industrial Submersible Pumps Market Volume (K Unit) Forecast, by Application 2019 & 2032
- Table 45: India Global Industrial Submersible Pumps Market Revenue (Million) Forecast, by Application 2019 & 2032
- Table 46: India Global Industrial Submersible Pumps Market Volume (K Unit) Forecast, by Application 2019 & 2032
- Table 47: South Korea Global Industrial Submersible Pumps Market Revenue (Million) Forecast, by Application 2019 & 2032
- Table 48: South Korea Global Industrial Submersible Pumps Market Volume (K Unit) Forecast, by Application 2019 & 2032
- Table 49: Southeast Asia Global Industrial Submersible Pumps Market Revenue (Million) Forecast, by Application 2019 & 2032
- Table 50: Southeast Asia Global Industrial Submersible Pumps Market Volume (K Unit) Forecast, by Application 2019 & 2032
- Table 51: Australia Global Industrial Submersible Pumps Market Revenue (Million) Forecast, by Application 2019 & 2032
- Table 52: Australia Global Industrial Submersible Pumps Market Volume (K Unit) Forecast, by Application 2019 & 2032
- Table 53: Indonesia Global Industrial Submersible Pumps Market Revenue (Million) Forecast, by Application 2019 & 2032
- Table 54: Indonesia Global Industrial Submersible Pumps Market Volume (K Unit) Forecast, by Application 2019 & 2032
- Table 55: Phillipes Global Industrial Submersible Pumps Market Revenue (Million) Forecast, by Application 2019 & 2032
- Table 56: Phillipes Global Industrial Submersible Pumps Market Volume (K Unit) Forecast, by Application 2019 & 2032
- Table 57: Singapore Global Industrial Submersible Pumps Market Revenue (Million) Forecast, by Application 2019 & 2032
- Table 58: Singapore Global Industrial Submersible Pumps Market Volume (K Unit) Forecast, by Application 2019 & 2032
- Table 59: Thailandc Global Industrial Submersible Pumps Market Revenue (Million) Forecast, by Application 2019 & 2032
- Table 60: Thailandc Global Industrial Submersible Pumps Market Volume (K Unit) Forecast, by Application 2019 & 2032
- Table 61: Rest of Asia Pacific Global Industrial Submersible Pumps Market Revenue (Million) Forecast, by Application 2019 & 2032
- Table 62: Rest of Asia Pacific Global Industrial Submersible Pumps Market Volume (K Unit) Forecast, by Application 2019 & 2032
- Table 63: Global Industrial Submersible Pumps Market Revenue Million Forecast, by Country 2019 & 2032
- Table 64: Global Industrial Submersible Pumps Market Volume K Unit Forecast, by Country 2019 & 2032
- Table 65: Brazil Global Industrial Submersible Pumps Market Revenue (Million) Forecast, by Application 2019 & 2032
- Table 66: Brazil Global Industrial Submersible Pumps Market Volume (K Unit) Forecast, by Application 2019 & 2032
- Table 67: Argentina Global Industrial Submersible Pumps Market Revenue (Million) Forecast, by Application 2019 & 2032
- Table 68: Argentina Global Industrial Submersible Pumps Market Volume (K Unit) Forecast, by Application 2019 & 2032
- Table 69: Peru Global Industrial Submersible Pumps Market Revenue (Million) Forecast, by Application 2019 & 2032
- Table 70: Peru Global Industrial Submersible Pumps Market Volume (K Unit) Forecast, by Application 2019 & 2032
- Table 71: Chile Global Industrial Submersible Pumps Market Revenue (Million) Forecast, by Application 2019 & 2032
- Table 72: Chile Global Industrial Submersible Pumps Market Volume (K Unit) Forecast, by Application 2019 & 2032
- Table 73: Colombia Global Industrial Submersible Pumps Market Revenue (Million) Forecast, by Application 2019 & 2032
- Table 74: Colombia Global Industrial Submersible Pumps Market Volume (K Unit) Forecast, by Application 2019 & 2032
- Table 75: Ecuador Global Industrial Submersible Pumps Market Revenue (Million) Forecast, by Application 2019 & 2032
- Table 76: Ecuador Global Industrial Submersible Pumps Market Volume (K Unit) Forecast, by Application 2019 & 2032
- Table 77: Venezuela Global Industrial Submersible Pumps Market Revenue (Million) Forecast, by Application 2019 & 2032
- Table 78: Venezuela Global Industrial Submersible Pumps Market Volume (K Unit) Forecast, by Application 2019 & 2032
- Table 79: Rest of South America Global Industrial Submersible Pumps Market Revenue (Million) Forecast, by Application 2019 & 2032
- Table 80: Rest of South America Global Industrial Submersible Pumps Market Volume (K Unit) Forecast, by Application 2019 & 2032
- Table 81: Global Industrial Submersible Pumps Market Revenue Million Forecast, by Country 2019 & 2032
- Table 82: Global Industrial Submersible Pumps Market Volume K Unit Forecast, by Country 2019 & 2032
- Table 83: United States Global Industrial Submersible Pumps Market Revenue (Million) Forecast, by Application 2019 & 2032
- Table 84: United States Global Industrial Submersible Pumps Market Volume (K Unit) Forecast, by Application 2019 & 2032
- Table 85: Canada Global Industrial Submersible Pumps Market Revenue (Million) Forecast, by Application 2019 & 2032
- Table 86: Canada Global Industrial Submersible Pumps Market Volume (K Unit) Forecast, by Application 2019 & 2032
- Table 87: Mexico Global Industrial Submersible Pumps Market Revenue (Million) Forecast, by Application 2019 & 2032
- Table 88: Mexico Global Industrial Submersible Pumps Market Volume (K Unit) Forecast, by Application 2019 & 2032
- Table 89: Global Industrial Submersible Pumps Market Revenue Million Forecast, by Country 2019 & 2032
- Table 90: Global Industrial Submersible Pumps Market Volume K Unit Forecast, by Country 2019 & 2032
- Table 91: United Arab Emirates Global Industrial Submersible Pumps Market Revenue (Million) Forecast, by Application 2019 & 2032
- Table 92: United Arab Emirates Global Industrial Submersible Pumps Market Volume (K Unit) Forecast, by Application 2019 & 2032
- Table 93: Saudi Arabia Global Industrial Submersible Pumps Market Revenue (Million) Forecast, by Application 2019 & 2032
- Table 94: Saudi Arabia Global Industrial Submersible Pumps Market Volume (K Unit) Forecast, by Application 2019 & 2032
- Table 95: South Africa Global Industrial Submersible Pumps Market Revenue (Million) Forecast, by Application 2019 & 2032
- Table 96: South Africa Global Industrial Submersible Pumps Market Volume (K Unit) Forecast, by Application 2019 & 2032
- Table 97: Rest of Middle East and Africa Global Industrial Submersible Pumps Market Revenue (Million) Forecast, by Application 2019 & 2032
- Table 98: Rest of Middle East and Africa Global Industrial Submersible Pumps Market Volume (K Unit) Forecast, by Application 2019 & 2032
- Table 99: Global Industrial Submersible Pumps Market Revenue Million Forecast, by Drive Type 2019 & 2032
- Table 100: Global Industrial Submersible Pumps Market Volume K Unit Forecast, by Drive Type 2019 & 2032
- Table 101: Global Industrial Submersible Pumps Market Revenue Million Forecast, by End-users 2019 & 2032
- Table 102: Global Industrial Submersible Pumps Market Volume K Unit Forecast, by End-users 2019 & 2032
- Table 103: Global Industrial Submersible Pumps Market Revenue Million Forecast, by Country 2019 & 2032
- Table 104: Global Industrial Submersible Pumps Market Volume K Unit Forecast, by Country 2019 & 2032
- Table 105: United States Global Industrial Submersible Pumps Market Revenue (Million) Forecast, by Application 2019 & 2032
- Table 106: United States Global Industrial Submersible Pumps Market Volume (K Unit) Forecast, by Application 2019 & 2032
- Table 107: Canada Global Industrial Submersible Pumps Market Revenue (Million) Forecast, by Application 2019 & 2032
- Table 108: Canada Global Industrial Submersible Pumps Market Volume (K Unit) Forecast, by Application 2019 & 2032
- Table 109: Global Industrial Submersible Pumps Market Revenue Million Forecast, by Drive Type 2019 & 2032
- Table 110: Global Industrial Submersible Pumps Market Volume K Unit Forecast, by Drive Type 2019 & 2032
- Table 111: Global Industrial Submersible Pumps Market Revenue Million Forecast, by End-users 2019 & 2032
- Table 112: Global Industrial Submersible Pumps Market Volume K Unit Forecast, by End-users 2019 & 2032
- Table 113: Global Industrial Submersible Pumps Market Revenue Million Forecast, by Country 2019 & 2032
- Table 114: Global Industrial Submersible Pumps Market Volume K Unit Forecast, by Country 2019 & 2032
- Table 115: United Kingdom Global Industrial Submersible Pumps Market Revenue (Million) Forecast, by Application 2019 & 2032
- Table 116: United Kingdom Global Industrial Submersible Pumps Market Volume (K Unit) Forecast, by Application 2019 & 2032
- Table 117: Germany Global Industrial Submersible Pumps Market Revenue (Million) Forecast, by Application 2019 & 2032
- Table 118: Germany Global Industrial Submersible Pumps Market Volume (K Unit) Forecast, by Application 2019 & 2032
- Table 119: France Global Industrial Submersible Pumps Market Revenue (Million) Forecast, by Application 2019 & 2032
- Table 120: France Global Industrial Submersible Pumps Market Volume (K Unit) Forecast, by Application 2019 & 2032
- Table 121: Rest of Europe Global Industrial Submersible Pumps Market Revenue (Million) Forecast, by Application 2019 & 2032
- Table 122: Rest of Europe Global Industrial Submersible Pumps Market Volume (K Unit) Forecast, by Application 2019 & 2032
- Table 123: Global Industrial Submersible Pumps Market Revenue Million Forecast, by Drive Type 2019 & 2032
- Table 124: Global Industrial Submersible Pumps Market Volume K Unit Forecast, by Drive Type 2019 & 2032
- Table 125: Global Industrial Submersible Pumps Market Revenue Million Forecast, by End-users 2019 & 2032
- Table 126: Global Industrial Submersible Pumps Market Volume K Unit Forecast, by End-users 2019 & 2032
- Table 127: Global Industrial Submersible Pumps Market Revenue Million Forecast, by Country 2019 & 2032
- Table 128: Global Industrial Submersible Pumps Market Volume K Unit Forecast, by Country 2019 & 2032
- Table 129: China Global Industrial Submersible Pumps Market Revenue (Million) Forecast, by Application 2019 & 2032
- Table 130: China Global Industrial Submersible Pumps Market Volume (K Unit) Forecast, by Application 2019 & 2032
- Table 131: India Global Industrial Submersible Pumps Market Revenue (Million) Forecast, by Application 2019 & 2032
- Table 132: India Global Industrial Submersible Pumps Market Volume (K Unit) Forecast, by Application 2019 & 2032
- Table 133: Japan Global Industrial Submersible Pumps Market Revenue (Million) Forecast, by Application 2019 & 2032
- Table 134: Japan Global Industrial Submersible Pumps Market Volume (K Unit) Forecast, by Application 2019 & 2032
- Table 135: Rest of Asia Pacific Global Industrial Submersible Pumps Market Revenue (Million) Forecast, by Application 2019 & 2032
- Table 136: Rest of Asia Pacific Global Industrial Submersible Pumps Market Volume (K Unit) Forecast, by Application 2019 & 2032
- Table 137: Global Industrial Submersible Pumps Market Revenue Million Forecast, by Drive Type 2019 & 2032
- Table 138: Global Industrial Submersible Pumps Market Volume K Unit Forecast, by Drive Type 2019 & 2032
- Table 139: Global Industrial Submersible Pumps Market Revenue Million Forecast, by End-users 2019 & 2032
- Table 140: Global Industrial Submersible Pumps Market Volume K Unit Forecast, by End-users 2019 & 2032
- Table 141: Global Industrial Submersible Pumps Market Revenue Million Forecast, by Country 2019 & 2032
- Table 142: Global Industrial Submersible Pumps Market Volume K Unit Forecast, by Country 2019 & 2032
- Table 143: Latin America Global Industrial Submersible Pumps Market Revenue (Million) Forecast, by Application 2019 & 2032
- Table 144: Latin America Global Industrial Submersible Pumps Market Volume (K Unit) Forecast, by Application 2019 & 2032
- Table 145: Middle East and Africa Global Industrial Submersible Pumps Market Revenue (Million) Forecast, by Application 2019 & 2032
- Table 146: Middle East and Africa Global Industrial Submersible Pumps Market Volume (K Unit) Forecast, by Application 2019 & 2032
Frequently Asked Questions
1. What is the projected Compound Annual Growth Rate (CAGR) of the Global Industrial Submersible Pumps Market?
The projected CAGR is approximately 5.76%.
2. Which companies are prominent players in the Global Industrial Submersible Pumps Market?
Key companies in the market include Grundfos Group, Weir Group PLC, Atlas Copco AB, Baker Hughes Co, Franklin Electric Co Inc, Borets International Ltd, Halliburton Co, Ebara Corporation, The Gorman-Rupp Company, Schlumberger Limited.
3. What are the main segments of the Global Industrial Submersible Pumps Market?
The market segments include Drive Type, End-users.
4. Can you provide details about the market size?
The market size is estimated to be USD XX Million as of 2022.
5. What are some drivers contributing to market growth?
Growing Manufactruing Sector; Upgradation of aging and construction of new water & wastewater treatment facilities.
6. What are the notable trends driving market growth?
Oil and Gas Industry is Expected to Hold Major Share.
7. Are there any restraints impacting market growth?
High Maintenance Cost Over the Entire Lifespan is Challenging the Market Growth.
8. Can you provide examples of recent developments in the market?
January 2021- Atlas Copco Power and Flow has completed its WEDA electric submersible dewatering pump portfolio. The WEDA D dewatering family has been expanded, as has the WEDA S sludge family, which has also been expanded, and the wholly new WEDA L slurry family.
9. What pricing options are available for accessing the report?
Pricing options include single-user, multi-user, and enterprise licenses priced at USD 4750, USD 5250, and USD 8750 respectively.
10. Is the market size provided in terms of value or volume?
The market size is provided in terms of value, measured in Million and volume, measured in K Unit.
11. Are there any specific market keywords associated with the report?
Yes, the market keyword associated with the report is "Global Industrial Submersible Pumps Market," which aids in identifying and referencing the specific market segment covered.
12. How do I determine which pricing option suits my needs best?
The pricing options vary based on user requirements and access needs. Individual users may opt for single-user licenses, while businesses requiring broader access may choose multi-user or enterprise licenses for cost-effective access to the report.
13. Are there any additional resources or data provided in the Global Industrial Submersible Pumps Market report?
While the report offers comprehensive insights, it's advisable to review the specific contents or supplementary materials provided to ascertain if additional resources or data are available.
14. How can I stay updated on further developments or reports in the Global Industrial Submersible Pumps Market?
To stay informed about further developments, trends, and reports in the Global Industrial Submersible Pumps Market, consider subscribing to industry newsletters, following relevant companies and organizations, or regularly checking reputable industry news sources and publications.
Methodology
Step 1 - Identification of Relevant Samples Size from Population Database


Step 2 - Approaches for Defining Global Market Size (Value, Volume* & Price*)

Note*: In applicable scenarios
Step 3 - Data Sources
Primary Research
- Web Analytics
- Survey Reports
- Research Institute
- Latest Research Reports
- Opinion Leaders
Secondary Research
- Annual Reports
- White Paper
- Latest Press Release
- Industry Association
- Paid Database
- Investor Presentations

Step 4 - Data Triangulation
Involves using different sources of information in order to increase the validity of a study
These sources are likely to be stakeholders in a program - participants, other researchers, program staff, other community members, and so on.
Then we put all data in single framework & apply various statistical tools to find out the dynamic on the market.
During the analysis stage, feedback from the stakeholder groups would be compared to determine areas of agreement as well as areas of divergence


