
Key Insights
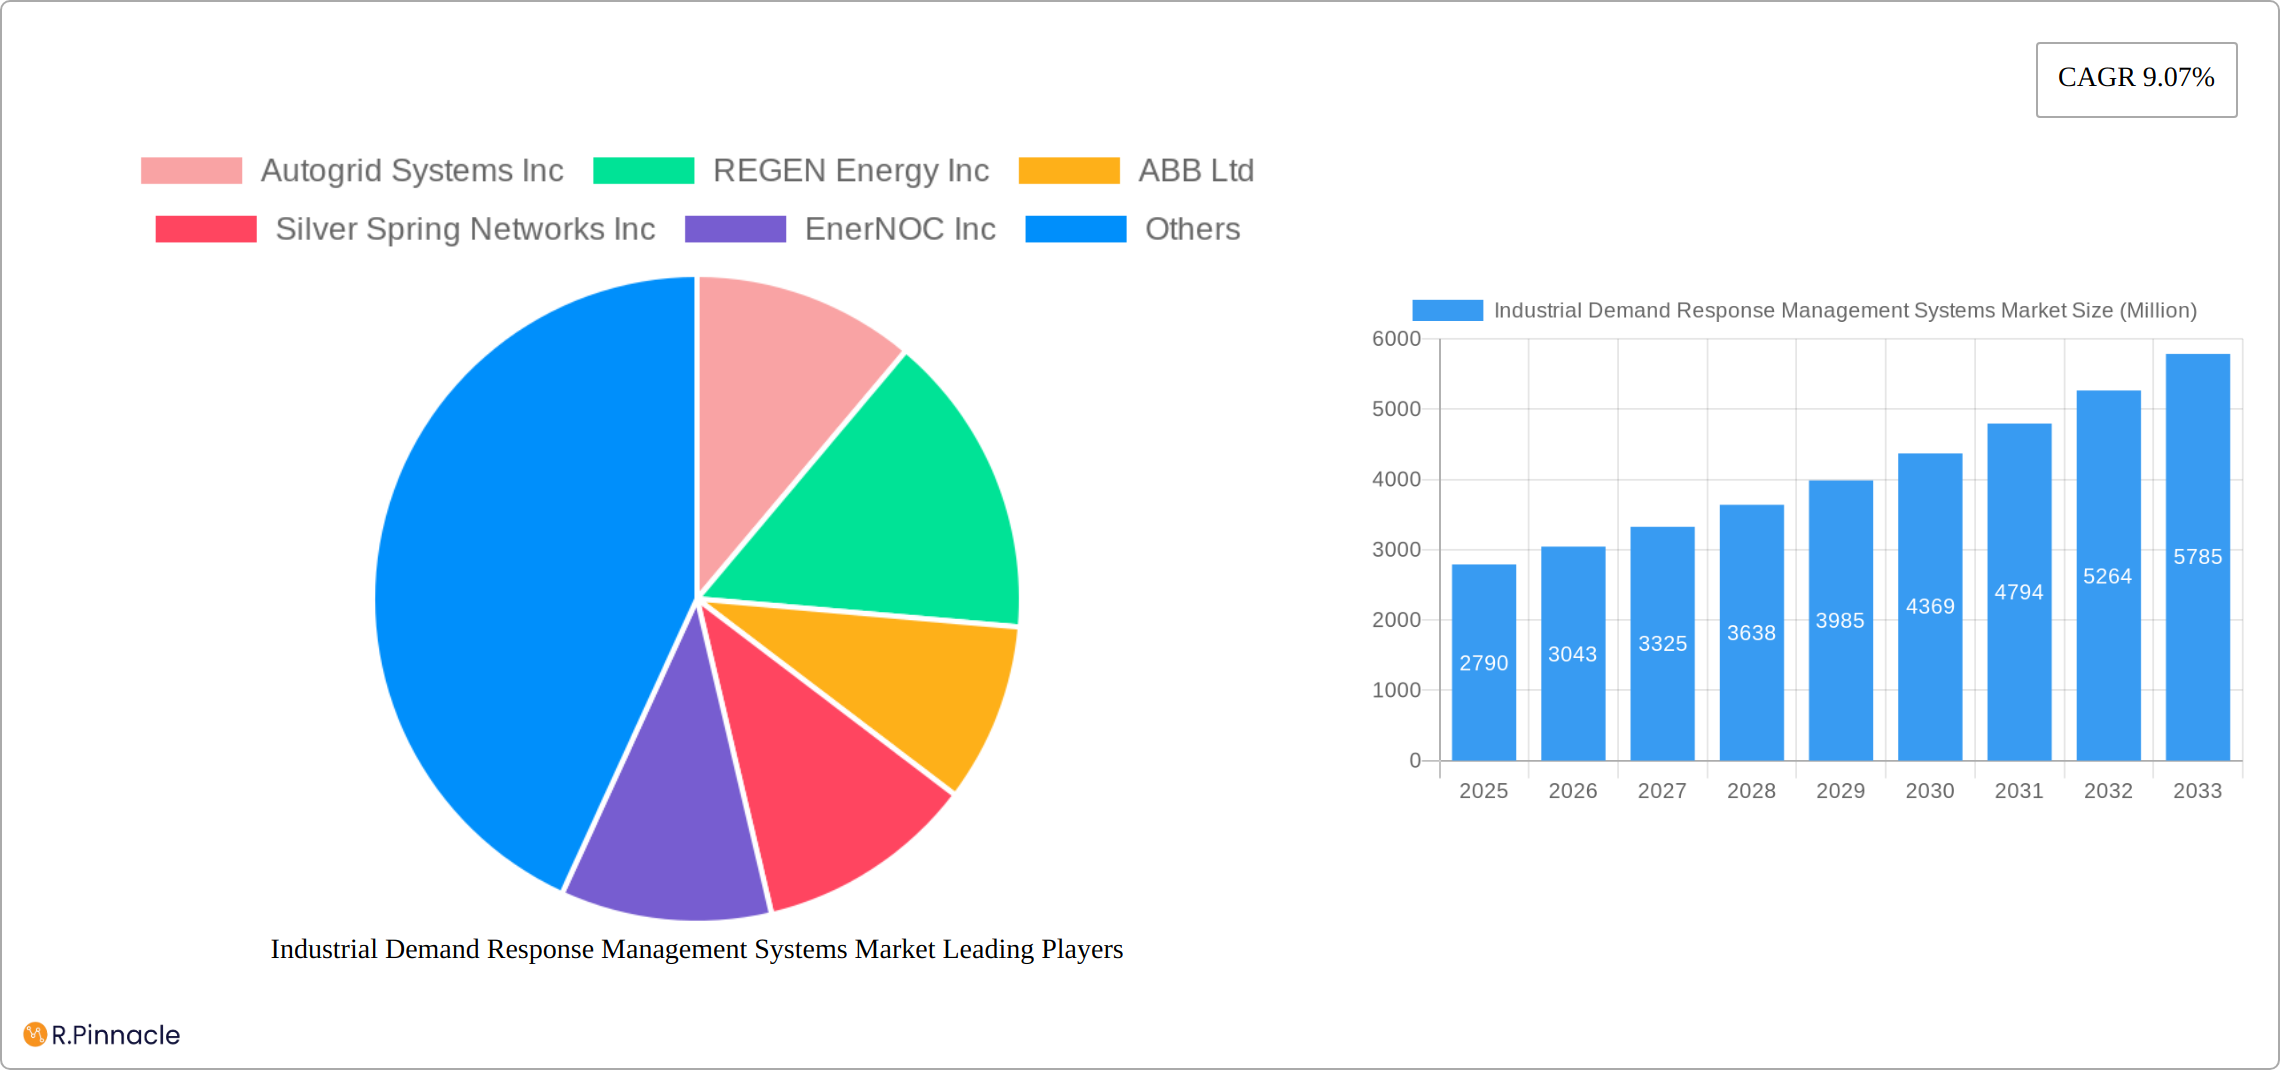
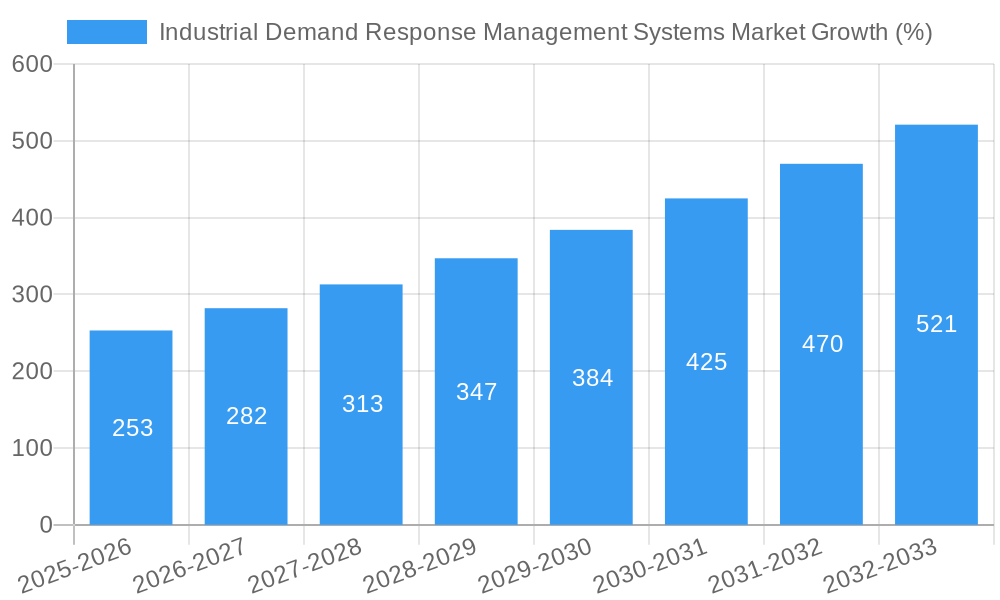
The Industrial Demand Response Management Systems (IDRMS) market is experiencing robust growth, projected to reach \$2.79 billion in 2025 and expand significantly over the forecast period (2025-2033). A Compound Annual Growth Rate (CAGR) of 9.07% reflects the increasing adoption of IDRMS driven by several key factors. The escalating need for energy efficiency and cost optimization within industrial settings is a primary driver. Smart grid initiatives and government regulations promoting renewable energy integration are also contributing to market expansion. Furthermore, the rising prevalence of automated demand response (ADR) systems, offering superior control and optimization compared to conventional methods, is fueling market growth. The shift towards Industry 4.0 and the increasing connectivity of industrial assets are creating opportunities for advanced IDRMS solutions capable of real-time data analysis and predictive control. However, high initial investment costs for implementing IDRMS and a lack of awareness among some industrial sectors represent significant market restraints.
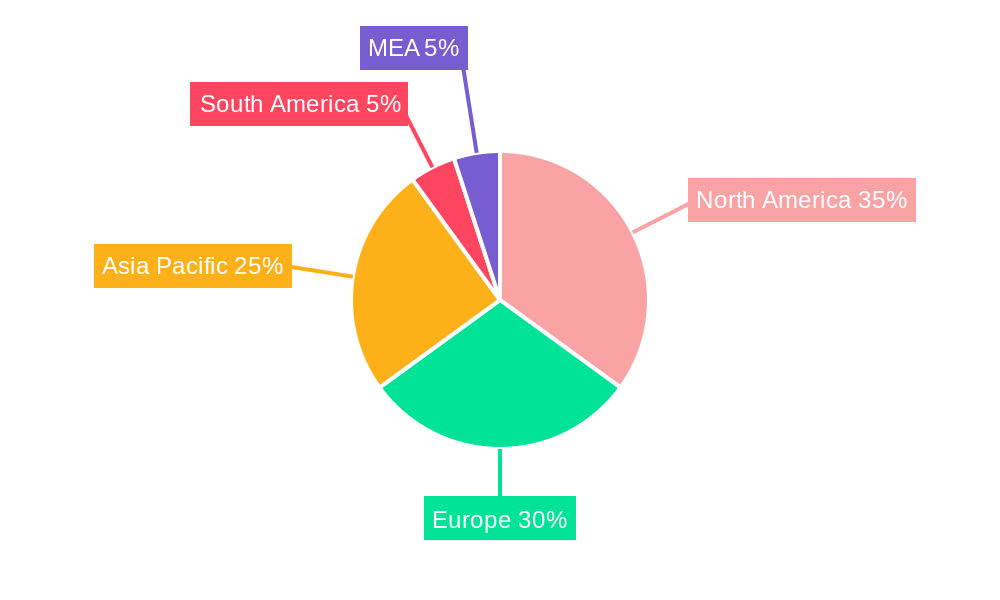
The market segmentation reveals a notable preference towards automated demand response systems, which are expected to dominate the market due to their enhanced capabilities. Geographically, North America and Europe currently hold substantial market shares, but the Asia-Pacific region is poised for rapid growth fueled by increasing industrialization and government support for energy efficiency initiatives. Key players like Autogrid Systems, ABB, and Siemens are driving innovation through technological advancements and strategic partnerships, further strengthening market competition and driving the overall expansion of the IDRMS sector. The continuous development of sophisticated algorithms and the integration of artificial intelligence and machine learning into IDRMS solutions will continue to enhance market capabilities and drive further market expansion throughout the forecast period.
Industrial Demand Response Management Systems Market Report: 2019-2033
This comprehensive report provides an in-depth analysis of the Industrial Demand Response Management Systems Market, offering actionable insights for industry professionals and strategic decision-makers. Covering the period from 2019 to 2033, with a focus on 2025, this report delves into market dynamics, segmentation, key players, and future growth prospects. The market is projected to reach xx Million by 2033, presenting significant opportunities for investment and expansion.
Industrial Demand Response Management Systems Market Market Structure & Innovation Trends
The Industrial Demand Response Management Systems market exhibits a moderately concentrated structure, with key players like ABB Ltd, General Electric Company, Siemens AG, and Schneider Electric SE holding significant market share. However, the market also features several smaller, innovative companies vying for position. Market share distribution fluctuates based on technological advancements and strategic partnerships. The estimated market share for the top five players in 2025 is approximately xx%, reflecting the competitive landscape.
Innovation in this sector is driven by the increasing need for grid stability, rising energy costs, and the integration of renewable energy sources. Regulatory frameworks, particularly those promoting energy efficiency and grid modernization, significantly influence market growth. Product substitutes, such as traditional energy management systems, face increasing competition due to the superior efficiency and cost-effectiveness offered by demand response systems. End-user demographics are shifting towards larger industrial facilities and data centers, necessitating sophisticated solutions. Mergers and acquisitions (M&A) activity has been moderate, with deal values in the range of xx Million annually over the past five years, reflecting consolidation and expansion efforts within the market. The average deal value for M&A activity in the past five years was approximately xx Million, indicating strategic investments in the sector.
Industrial Demand Response Management Systems Market Market Dynamics & Trends
The Industrial Demand Response Management Systems market is experiencing robust growth, driven by several key factors. The increasing adoption of smart grids and the integration of renewable energy sources are key market drivers. The rising cost of energy and the need for energy efficiency improvements further propel demand. Technological advancements, such as the development of more sophisticated algorithms and the deployment of advanced sensors, are enhancing the capabilities of demand response systems. Consumer preferences are shifting towards systems that offer greater control, flexibility, and cost savings. Competitive dynamics are characterized by intense rivalry among established players and the emergence of new entrants offering innovative solutions. The market's CAGR from 2025 to 2033 is estimated to be xx%, reflecting strong growth potential. Market penetration is increasing steadily across various industrial sectors, with significant opportunities remaining in emerging economies.
Dominant Regions & Segments in Industrial Demand Response Management Systems Market
North America currently holds the leading position in the Industrial Demand Response Management Systems (IDRMS) market, driven by a confluence of factors: stringent environmental regulations emphasizing energy efficiency, a well-developed grid infrastructure that readily accommodates advanced demand response technologies, and high energy costs incentivizing cost-saving solutions. Europe follows closely as a significant market, exhibiting similar drivers, including a strong commitment to sustainability initiatives and supportive governmental policies.
Key Drivers in North America:
- Stringent environmental regulations promoting energy efficiency and renewable energy integration.
- Advanced grid infrastructure facilitating seamless integration of demand response systems and smart grid technologies.
- High and volatile energy costs, creating a compelling financial incentive for industrial facilities to adopt cost-saving solutions.
- Growing awareness among industrial consumers regarding the financial and environmental benefits of energy efficiency.
Key Drivers in Europe:
- Strong focus on renewable energy integration, sustainable development, and decarbonization targets.
- Supportive government policies, including financial incentives, subsidies, and carbon pricing mechanisms.
- Growing awareness of energy efficiency and cost-effectiveness, coupled with increasing regulatory pressure.
- A robust ecosystem of technology providers and energy service companies fostering innovation and competition.
Within the IDRMS market, the Automated Demand Response segment is experiencing significantly faster growth compared to the Conventional Demand Response segment. This accelerated growth is fueled by the increasing adoption of advanced technologies such as artificial intelligence (AI), machine learning (ML), and the Internet of Things (IoT). Automated systems offer real-time, dynamic control over energy consumption, delivering greater efficiency and cost savings than conventional methods. Market analysis projects that the automated segment's market share will expand from xx% in 2025 to xx% by 2033.
Industrial Demand Response Management Systems Market Product Innovations
Recent innovations focus on enhancing the efficiency, scalability, and user-friendliness of demand response management systems. Developments include advanced analytics and machine learning algorithms for predicting energy consumption patterns, advanced communication protocols for seamless integration with smart grids and other energy management systems, and user-friendly interfaces designed for easy monitoring and control. These advancements offer superior energy savings and cost-effectiveness compared to previous generations of systems, leading to wider adoption and market penetration. The integration of cloud-based platforms further expands functionality and accessibility.
Report Scope & Segmentation Analysis
This report segments the Industrial Demand Response Management Systems market by type:
Conventional Demand Response: This segment encompasses traditional demand response programs that rely on manual adjustments and pre-defined schedules for managing energy consumption. The market size for this segment in 2025 is estimated at xx Million, with a projected CAGR of xx% during the forecast period. Competition is moderate, with established players focused on optimizing existing solutions.
Automated Demand Response: This segment includes advanced systems that utilize automation and real-time data analytics to optimize energy consumption dynamically. The market size for this segment is projected to be xx Million in 2025, growing at a CAGR of xx% from 2025 to 2033 due to its superior efficiency and cost-effectiveness. Competitive dynamics are highly dynamic, with both established and emerging companies vying for market share through innovation and strategic partnerships.
Key Drivers of Industrial Demand Response Management Systems Market Growth
The growth of the Industrial Demand Response Management Systems market is propelled by several key factors. The increasing integration of intermittent renewable energy sources (like solar and wind) necessitates improved grid stability and reliability, driving demand for IDRMS. Simultaneously, rising energy costs are making energy efficiency a top priority for industrial facilities, pushing them to adopt cost-optimization strategies. Stringent environmental regulations and government policies incentivizing energy conservation are further boosting adoption rates. Finally, advancements in technologies such as AI, machine learning, and IoT are significantly enhancing the effectiveness, precision, and sophistication of demand response systems, unlocking new levels of efficiency and cost savings.
Challenges in the Industrial Demand Response Management Systems Market Sector
Despite its substantial growth potential, the IDRMS market faces several challenges. High initial investment costs for implementing advanced demand response systems can be a significant barrier to entry, particularly for smaller industrial companies. Interoperability issues between different systems and platforms present technical hurdles to seamless integration and data exchange. Growing cybersecurity concerns related to data privacy and system reliability require robust security protocols and measures. Furthermore, the complexity and variability of regulatory frameworks and compliance requirements across different regions can impede market expansion. These factors can contribute to slower adoption rates among smaller industrial companies, potentially leading to a projected xx% reduction in adoption among this segment by 2030. Overcoming these challenges through strategic partnerships, technological advancements, and clear regulatory frameworks is crucial for unlocking the full market potential.
Emerging Opportunities in Industrial Demand Response Management Systems Market
Emerging trends present significant opportunities. The increasing adoption of edge computing and IoT technology enables real-time energy optimization and reduced latency. The development of advanced analytics and machine learning algorithms promises more accurate prediction and control of energy consumption patterns. The integration of demand response systems with other energy management solutions will further enhance their capabilities and create synergy. New market segments such as data centers and smart cities also present substantial growth opportunities.
Leading Players in the Industrial Demand Response Management Systems Market Market
- Autogrid Systems Inc
- REGEN Energy Inc
- ABB Ltd
- Silver Spring Networks Inc
- EnerNOC Inc
- Hitachi Ltd
- Mitsubishi Electric Corporation
- Siemens AG
- Alstom SA
- Schneider Electric SE
- Eaton Corporation PLC
- General Electric Company
Key Developments in Industrial Demand Response Management Systems Market Industry
June 2023: Vertiv launched its Vertiv EnerSav service, leveraging EDD-RT technology to optimize energy consumption in critical facilities, reducing infrastructure investment needs. This launch directly impacts the market by offering a competitive, cost-effective solution.
July 2023: CPower Energy and OBM partnered to integrate CPower's EnerWise technology into Foreman's mining management platform, enhancing demand response capabilities for mining operations. This collaboration expands the market reach of demand response technology into a previously less-penetrated sector.
October 2023: Google tested a demand-response system for its data centers, aiming to reduce electricity consumption during peak demand. The successful rollout of this system would significantly impact the market, demonstrating the potential for large-scale adoption in the data center sector.
Future Outlook for Industrial Demand Response Management Systems Market Market
The Industrial Demand Response Management Systems market is poised for continued robust growth, driven by the increasing need for grid modernization, energy efficiency improvements, and the integration of renewable energy sources. The market will see increased adoption of sophisticated solutions incorporating AI, machine learning, and IoT technology, leading to enhanced optimization and cost savings. Strategic partnerships and technological innovations will further shape the market landscape, leading to increased competition and market consolidation. The expanding data center market and growing adoption in emerging economies will present significant growth opportunities.
Industrial Demand Response Management Systems Market Segmentation
-
1. Type
- 1.1. Conventional Demand Response
- 1.2. Automated Demand Response
Industrial Demand Response Management Systems Market Segmentation By Geography
-
1. North America
- 1.1. United States
- 1.2. Canada
- 1.3. Rest of North America
-
2. Asia Pacific
- 2.1. China
- 2.2. India
- 2.3. Japan
- 2.4. Australia
- 2.5. Malaysia
- 2.6. Thailand
- 2.7. Indonesia
- 2.8. Vietnam
- 2.9. Rest of Asia pacific
-
3. Europe
- 3.1. Germany
- 3.2. France
- 3.3. United Kingdom
- 3.4. Italy
- 3.5. Spain
- 3.6. Nordic
- 3.7. Turkey
- 3.8. Russia
- 3.9. Rest of Europe
-
4. South America
- 4.1. Brazil
- 4.2. Argentina
- 4.3. Chile
- 4.4. Colombia
- 4.5. Rest of South America
-
5. Middle East and Africa
- 5.1. Saudi Arabia
- 5.2. United Arab Emirates
- 5.3. South Africa
- 5.4. Qatar
- 5.5. Egypt
- 5.6. Nigeria
- 5.7. Rest of Middle East
Industrial Demand Response Management Systems Market REPORT HIGHLIGHTS
| Aspects | Details |
|---|---|
| Study Period | 2019-2033 |
| Base Year | 2024 |
| Estimated Year | 2025 |
| Forecast Period | 2025-2033 |
| Historical Period | 2019-2024 |
| Growth Rate | CAGR of 9.07% from 2019-2033 |
| Segmentation |
|
Table of Contents
- 1. Introduction
- 1.1. Research Scope
- 1.2. Market Segmentation
- 1.3. Research Methodology
- 1.4. Definitions and Assumptions
- 2. Executive Summary
- 2.1. Introduction
- 3. Market Dynamics
- 3.1. Introduction
- 3.2. Market Drivers
- 3.2.1. 4.; Need for Efficient Energy Management Systems4.; Growing Penetration of Renewable Energy Sources
- 3.3. Market Restrains
- 3.3.1. 4.; Privacy Concerns on the Industrial Demand Response Management Systems
- 3.4. Market Trends
- 3.4.1. Growing Penetration of Renewable Energy Sources to Drive the Market
- 4. Market Factor Analysis
- 4.1. Porters Five Forces
- 4.2. Supply/Value Chain
- 4.3. PESTEL analysis
- 4.4. Market Entropy
- 4.5. Patent/Trademark Analysis
- 5. Global Industrial Demand Response Management Systems Market Analysis, Insights and Forecast, 2019-2031
- 5.1. Market Analysis, Insights and Forecast - by Type
- 5.1.1. Conventional Demand Response
- 5.1.2. Automated Demand Response
- 5.2. Market Analysis, Insights and Forecast - by Region
- 5.2.1. North America
- 5.2.2. Asia Pacific
- 5.2.3. Europe
- 5.2.4. South America
- 5.2.5. Middle East and Africa
- 5.1. Market Analysis, Insights and Forecast - by Type
- 6. North America Industrial Demand Response Management Systems Market Analysis, Insights and Forecast, 2019-2031
- 6.1. Market Analysis, Insights and Forecast - by Type
- 6.1.1. Conventional Demand Response
- 6.1.2. Automated Demand Response
- 6.1. Market Analysis, Insights and Forecast - by Type
- 7. Asia Pacific Industrial Demand Response Management Systems Market Analysis, Insights and Forecast, 2019-2031
- 7.1. Market Analysis, Insights and Forecast - by Type
- 7.1.1. Conventional Demand Response
- 7.1.2. Automated Demand Response
- 7.1. Market Analysis, Insights and Forecast - by Type
- 8. Europe Industrial Demand Response Management Systems Market Analysis, Insights and Forecast, 2019-2031
- 8.1. Market Analysis, Insights and Forecast - by Type
- 8.1.1. Conventional Demand Response
- 8.1.2. Automated Demand Response
- 8.1. Market Analysis, Insights and Forecast - by Type
- 9. South America Industrial Demand Response Management Systems Market Analysis, Insights and Forecast, 2019-2031
- 9.1. Market Analysis, Insights and Forecast - by Type
- 9.1.1. Conventional Demand Response
- 9.1.2. Automated Demand Response
- 9.1. Market Analysis, Insights and Forecast - by Type
- 10. Middle East and Africa Industrial Demand Response Management Systems Market Analysis, Insights and Forecast, 2019-2031
- 10.1. Market Analysis, Insights and Forecast - by Type
- 10.1.1. Conventional Demand Response
- 10.1.2. Automated Demand Response
- 10.1. Market Analysis, Insights and Forecast - by Type
- 11. North America Industrial Demand Response Management Systems Market Analysis, Insights and Forecast, 2019-2031
- 11.1. Market Analysis, Insights and Forecast - By Country/Sub-region
- 11.1.1 United States
- 11.1.2 Canada
- 11.1.3 Mexico
- 12. Europe Industrial Demand Response Management Systems Market Analysis, Insights and Forecast, 2019-2031
- 12.1. Market Analysis, Insights and Forecast - By Country/Sub-region
- 12.1.1 Germany
- 12.1.2 United Kingdom
- 12.1.3 France
- 12.1.4 Spain
- 12.1.5 Italy
- 12.1.6 Spain
- 12.1.7 Belgium
- 12.1.8 Netherland
- 12.1.9 Nordics
- 12.1.10 Rest of Europe
- 13. Asia Pacific Industrial Demand Response Management Systems Market Analysis, Insights and Forecast, 2019-2031
- 13.1. Market Analysis, Insights and Forecast - By Country/Sub-region
- 13.1.1 China
- 13.1.2 Japan
- 13.1.3 India
- 13.1.4 South Korea
- 13.1.5 Southeast Asia
- 13.1.6 Australia
- 13.1.7 Indonesia
- 13.1.8 Phillipes
- 13.1.9 Singapore
- 13.1.10 Thailandc
- 13.1.11 Rest of Asia Pacific
- 14. South America Industrial Demand Response Management Systems Market Analysis, Insights and Forecast, 2019-2031
- 14.1. Market Analysis, Insights and Forecast - By Country/Sub-region
- 14.1.1 Brazil
- 14.1.2 Argentina
- 14.1.3 Peru
- 14.1.4 Chile
- 14.1.5 Colombia
- 14.1.6 Ecuador
- 14.1.7 Venezuela
- 14.1.8 Rest of South America
- 15. MEA Industrial Demand Response Management Systems Market Analysis, Insights and Forecast, 2019-2031
- 15.1. Market Analysis, Insights and Forecast - By Country/Sub-region
- 15.1.1 United Arab Emirates
- 15.1.2 Saudi Arabia
- 15.1.3 South Africa
- 15.1.4 Rest of Middle East and Africa
- 16. Competitive Analysis
- 16.1. Global Market Share Analysis 2024
- 16.2. Company Profiles
- 16.2.1 Autogrid Systems Inc
- 16.2.1.1. Overview
- 16.2.1.2. Products
- 16.2.1.3. SWOT Analysis
- 16.2.1.4. Recent Developments
- 16.2.1.5. Financials (Based on Availability)
- 16.2.2 REGEN Energy Inc
- 16.2.2.1. Overview
- 16.2.2.2. Products
- 16.2.2.3. SWOT Analysis
- 16.2.2.4. Recent Developments
- 16.2.2.5. Financials (Based on Availability)
- 16.2.3 ABB Ltd
- 16.2.3.1. Overview
- 16.2.3.2. Products
- 16.2.3.3. SWOT Analysis
- 16.2.3.4. Recent Developments
- 16.2.3.5. Financials (Based on Availability)
- 16.2.4 Silver Spring Networks Inc
- 16.2.4.1. Overview
- 16.2.4.2. Products
- 16.2.4.3. SWOT Analysis
- 16.2.4.4. Recent Developments
- 16.2.4.5. Financials (Based on Availability)
- 16.2.5 EnerNOC Inc
- 16.2.5.1. Overview
- 16.2.5.2. Products
- 16.2.5.3. SWOT Analysis
- 16.2.5.4. Recent Developments
- 16.2.5.5. Financials (Based on Availability)
- 16.2.6 Hitachi Ltd
- 16.2.6.1. Overview
- 16.2.6.2. Products
- 16.2.6.3. SWOT Analysis
- 16.2.6.4. Recent Developments
- 16.2.6.5. Financials (Based on Availability)
- 16.2.7 Mitsubishi Electric Corporation
- 16.2.7.1. Overview
- 16.2.7.2. Products
- 16.2.7.3. SWOT Analysis
- 16.2.7.4. Recent Developments
- 16.2.7.5. Financials (Based on Availability)
- 16.2.8 Siemens AG
- 16.2.8.1. Overview
- 16.2.8.2. Products
- 16.2.8.3. SWOT Analysis
- 16.2.8.4. Recent Developments
- 16.2.8.5. Financials (Based on Availability)
- 16.2.9 Alstom SA
- 16.2.9.1. Overview
- 16.2.9.2. Products
- 16.2.9.3. SWOT Analysis
- 16.2.9.4. Recent Developments
- 16.2.9.5. Financials (Based on Availability)
- 16.2.10 Schneider Electric SE
- 16.2.10.1. Overview
- 16.2.10.2. Products
- 16.2.10.3. SWOT Analysis
- 16.2.10.4. Recent Developments
- 16.2.10.5. Financials (Based on Availability)
- 16.2.11 Eaton Corporation PLC
- 16.2.11.1. Overview
- 16.2.11.2. Products
- 16.2.11.3. SWOT Analysis
- 16.2.11.4. Recent Developments
- 16.2.11.5. Financials (Based on Availability)
- 16.2.12 General Electric Company
- 16.2.12.1. Overview
- 16.2.12.2. Products
- 16.2.12.3. SWOT Analysis
- 16.2.12.4. Recent Developments
- 16.2.12.5. Financials (Based on Availability)
- 16.2.1 Autogrid Systems Inc
List of Figures
- Figure 1: Global Industrial Demand Response Management Systems Market Revenue Breakdown (Million, %) by Region 2024 & 2032
- Figure 2: North America Industrial Demand Response Management Systems Market Revenue (Million), by Country 2024 & 2032
- Figure 3: North America Industrial Demand Response Management Systems Market Revenue Share (%), by Country 2024 & 2032
- Figure 4: Europe Industrial Demand Response Management Systems Market Revenue (Million), by Country 2024 & 2032
- Figure 5: Europe Industrial Demand Response Management Systems Market Revenue Share (%), by Country 2024 & 2032
- Figure 6: Asia Pacific Industrial Demand Response Management Systems Market Revenue (Million), by Country 2024 & 2032
- Figure 7: Asia Pacific Industrial Demand Response Management Systems Market Revenue Share (%), by Country 2024 & 2032
- Figure 8: South America Industrial Demand Response Management Systems Market Revenue (Million), by Country 2024 & 2032
- Figure 9: South America Industrial Demand Response Management Systems Market Revenue Share (%), by Country 2024 & 2032
- Figure 10: MEA Industrial Demand Response Management Systems Market Revenue (Million), by Country 2024 & 2032
- Figure 11: MEA Industrial Demand Response Management Systems Market Revenue Share (%), by Country 2024 & 2032
- Figure 12: North America Industrial Demand Response Management Systems Market Revenue (Million), by Type 2024 & 2032
- Figure 13: North America Industrial Demand Response Management Systems Market Revenue Share (%), by Type 2024 & 2032
- Figure 14: North America Industrial Demand Response Management Systems Market Revenue (Million), by Country 2024 & 2032
- Figure 15: North America Industrial Demand Response Management Systems Market Revenue Share (%), by Country 2024 & 2032
- Figure 16: Asia Pacific Industrial Demand Response Management Systems Market Revenue (Million), by Type 2024 & 2032
- Figure 17: Asia Pacific Industrial Demand Response Management Systems Market Revenue Share (%), by Type 2024 & 2032
- Figure 18: Asia Pacific Industrial Demand Response Management Systems Market Revenue (Million), by Country 2024 & 2032
- Figure 19: Asia Pacific Industrial Demand Response Management Systems Market Revenue Share (%), by Country 2024 & 2032
- Figure 20: Europe Industrial Demand Response Management Systems Market Revenue (Million), by Type 2024 & 2032
- Figure 21: Europe Industrial Demand Response Management Systems Market Revenue Share (%), by Type 2024 & 2032
- Figure 22: Europe Industrial Demand Response Management Systems Market Revenue (Million), by Country 2024 & 2032
- Figure 23: Europe Industrial Demand Response Management Systems Market Revenue Share (%), by Country 2024 & 2032
- Figure 24: South America Industrial Demand Response Management Systems Market Revenue (Million), by Type 2024 & 2032
- Figure 25: South America Industrial Demand Response Management Systems Market Revenue Share (%), by Type 2024 & 2032
- Figure 26: South America Industrial Demand Response Management Systems Market Revenue (Million), by Country 2024 & 2032
- Figure 27: South America Industrial Demand Response Management Systems Market Revenue Share (%), by Country 2024 & 2032
- Figure 28: Middle East and Africa Industrial Demand Response Management Systems Market Revenue (Million), by Type 2024 & 2032
- Figure 29: Middle East and Africa Industrial Demand Response Management Systems Market Revenue Share (%), by Type 2024 & 2032
- Figure 30: Middle East and Africa Industrial Demand Response Management Systems Market Revenue (Million), by Country 2024 & 2032
- Figure 31: Middle East and Africa Industrial Demand Response Management Systems Market Revenue Share (%), by Country 2024 & 2032
List of Tables
- Table 1: Global Industrial Demand Response Management Systems Market Revenue Million Forecast, by Region 2019 & 2032
- Table 2: Global Industrial Demand Response Management Systems Market Revenue Million Forecast, by Type 2019 & 2032
- Table 3: Global Industrial Demand Response Management Systems Market Revenue Million Forecast, by Region 2019 & 2032
- Table 4: Global Industrial Demand Response Management Systems Market Revenue Million Forecast, by Country 2019 & 2032
- Table 5: United States Industrial Demand Response Management Systems Market Revenue (Million) Forecast, by Application 2019 & 2032
- Table 6: Canada Industrial Demand Response Management Systems Market Revenue (Million) Forecast, by Application 2019 & 2032
- Table 7: Mexico Industrial Demand Response Management Systems Market Revenue (Million) Forecast, by Application 2019 & 2032
- Table 8: Global Industrial Demand Response Management Systems Market Revenue Million Forecast, by Country 2019 & 2032
- Table 9: Germany Industrial Demand Response Management Systems Market Revenue (Million) Forecast, by Application 2019 & 2032
- Table 10: United Kingdom Industrial Demand Response Management Systems Market Revenue (Million) Forecast, by Application 2019 & 2032
- Table 11: France Industrial Demand Response Management Systems Market Revenue (Million) Forecast, by Application 2019 & 2032
- Table 12: Spain Industrial Demand Response Management Systems Market Revenue (Million) Forecast, by Application 2019 & 2032
- Table 13: Italy Industrial Demand Response Management Systems Market Revenue (Million) Forecast, by Application 2019 & 2032
- Table 14: Spain Industrial Demand Response Management Systems Market Revenue (Million) Forecast, by Application 2019 & 2032
- Table 15: Belgium Industrial Demand Response Management Systems Market Revenue (Million) Forecast, by Application 2019 & 2032
- Table 16: Netherland Industrial Demand Response Management Systems Market Revenue (Million) Forecast, by Application 2019 & 2032
- Table 17: Nordics Industrial Demand Response Management Systems Market Revenue (Million) Forecast, by Application 2019 & 2032
- Table 18: Rest of Europe Industrial Demand Response Management Systems Market Revenue (Million) Forecast, by Application 2019 & 2032
- Table 19: Global Industrial Demand Response Management Systems Market Revenue Million Forecast, by Country 2019 & 2032
- Table 20: China Industrial Demand Response Management Systems Market Revenue (Million) Forecast, by Application 2019 & 2032
- Table 21: Japan Industrial Demand Response Management Systems Market Revenue (Million) Forecast, by Application 2019 & 2032
- Table 22: India Industrial Demand Response Management Systems Market Revenue (Million) Forecast, by Application 2019 & 2032
- Table 23: South Korea Industrial Demand Response Management Systems Market Revenue (Million) Forecast, by Application 2019 & 2032
- Table 24: Southeast Asia Industrial Demand Response Management Systems Market Revenue (Million) Forecast, by Application 2019 & 2032
- Table 25: Australia Industrial Demand Response Management Systems Market Revenue (Million) Forecast, by Application 2019 & 2032
- Table 26: Indonesia Industrial Demand Response Management Systems Market Revenue (Million) Forecast, by Application 2019 & 2032
- Table 27: Phillipes Industrial Demand Response Management Systems Market Revenue (Million) Forecast, by Application 2019 & 2032
- Table 28: Singapore Industrial Demand Response Management Systems Market Revenue (Million) Forecast, by Application 2019 & 2032
- Table 29: Thailandc Industrial Demand Response Management Systems Market Revenue (Million) Forecast, by Application 2019 & 2032
- Table 30: Rest of Asia Pacific Industrial Demand Response Management Systems Market Revenue (Million) Forecast, by Application 2019 & 2032
- Table 31: Global Industrial Demand Response Management Systems Market Revenue Million Forecast, by Country 2019 & 2032
- Table 32: Brazil Industrial Demand Response Management Systems Market Revenue (Million) Forecast, by Application 2019 & 2032
- Table 33: Argentina Industrial Demand Response Management Systems Market Revenue (Million) Forecast, by Application 2019 & 2032
- Table 34: Peru Industrial Demand Response Management Systems Market Revenue (Million) Forecast, by Application 2019 & 2032
- Table 35: Chile Industrial Demand Response Management Systems Market Revenue (Million) Forecast, by Application 2019 & 2032
- Table 36: Colombia Industrial Demand Response Management Systems Market Revenue (Million) Forecast, by Application 2019 & 2032
- Table 37: Ecuador Industrial Demand Response Management Systems Market Revenue (Million) Forecast, by Application 2019 & 2032
- Table 38: Venezuela Industrial Demand Response Management Systems Market Revenue (Million) Forecast, by Application 2019 & 2032
- Table 39: Rest of South America Industrial Demand Response Management Systems Market Revenue (Million) Forecast, by Application 2019 & 2032
- Table 40: Global Industrial Demand Response Management Systems Market Revenue Million Forecast, by Country 2019 & 2032
- Table 41: United Arab Emirates Industrial Demand Response Management Systems Market Revenue (Million) Forecast, by Application 2019 & 2032
- Table 42: Saudi Arabia Industrial Demand Response Management Systems Market Revenue (Million) Forecast, by Application 2019 & 2032
- Table 43: South Africa Industrial Demand Response Management Systems Market Revenue (Million) Forecast, by Application 2019 & 2032
- Table 44: Rest of Middle East and Africa Industrial Demand Response Management Systems Market Revenue (Million) Forecast, by Application 2019 & 2032
- Table 45: Global Industrial Demand Response Management Systems Market Revenue Million Forecast, by Type 2019 & 2032
- Table 46: Global Industrial Demand Response Management Systems Market Revenue Million Forecast, by Country 2019 & 2032
- Table 47: United States Industrial Demand Response Management Systems Market Revenue (Million) Forecast, by Application 2019 & 2032
- Table 48: Canada Industrial Demand Response Management Systems Market Revenue (Million) Forecast, by Application 2019 & 2032
- Table 49: Rest of North America Industrial Demand Response Management Systems Market Revenue (Million) Forecast, by Application 2019 & 2032
- Table 50: Global Industrial Demand Response Management Systems Market Revenue Million Forecast, by Type 2019 & 2032
- Table 51: Global Industrial Demand Response Management Systems Market Revenue Million Forecast, by Country 2019 & 2032
- Table 52: China Industrial Demand Response Management Systems Market Revenue (Million) Forecast, by Application 2019 & 2032
- Table 53: India Industrial Demand Response Management Systems Market Revenue (Million) Forecast, by Application 2019 & 2032
- Table 54: Japan Industrial Demand Response Management Systems Market Revenue (Million) Forecast, by Application 2019 & 2032
- Table 55: Australia Industrial Demand Response Management Systems Market Revenue (Million) Forecast, by Application 2019 & 2032
- Table 56: Malaysia Industrial Demand Response Management Systems Market Revenue (Million) Forecast, by Application 2019 & 2032
- Table 57: Thailand Industrial Demand Response Management Systems Market Revenue (Million) Forecast, by Application 2019 & 2032
- Table 58: Indonesia Industrial Demand Response Management Systems Market Revenue (Million) Forecast, by Application 2019 & 2032
- Table 59: Vietnam Industrial Demand Response Management Systems Market Revenue (Million) Forecast, by Application 2019 & 2032
- Table 60: Rest of Asia pacific Industrial Demand Response Management Systems Market Revenue (Million) Forecast, by Application 2019 & 2032
- Table 61: Global Industrial Demand Response Management Systems Market Revenue Million Forecast, by Type 2019 & 2032
- Table 62: Global Industrial Demand Response Management Systems Market Revenue Million Forecast, by Country 2019 & 2032
- Table 63: Germany Industrial Demand Response Management Systems Market Revenue (Million) Forecast, by Application 2019 & 2032
- Table 64: France Industrial Demand Response Management Systems Market Revenue (Million) Forecast, by Application 2019 & 2032
- Table 65: United Kingdom Industrial Demand Response Management Systems Market Revenue (Million) Forecast, by Application 2019 & 2032
- Table 66: Italy Industrial Demand Response Management Systems Market Revenue (Million) Forecast, by Application 2019 & 2032
- Table 67: Spain Industrial Demand Response Management Systems Market Revenue (Million) Forecast, by Application 2019 & 2032
- Table 68: Nordic Industrial Demand Response Management Systems Market Revenue (Million) Forecast, by Application 2019 & 2032
- Table 69: Turkey Industrial Demand Response Management Systems Market Revenue (Million) Forecast, by Application 2019 & 2032
- Table 70: Russia Industrial Demand Response Management Systems Market Revenue (Million) Forecast, by Application 2019 & 2032
- Table 71: Rest of Europe Industrial Demand Response Management Systems Market Revenue (Million) Forecast, by Application 2019 & 2032
- Table 72: Global Industrial Demand Response Management Systems Market Revenue Million Forecast, by Type 2019 & 2032
- Table 73: Global Industrial Demand Response Management Systems Market Revenue Million Forecast, by Country 2019 & 2032
- Table 74: Brazil Industrial Demand Response Management Systems Market Revenue (Million) Forecast, by Application 2019 & 2032
- Table 75: Argentina Industrial Demand Response Management Systems Market Revenue (Million) Forecast, by Application 2019 & 2032
- Table 76: Chile Industrial Demand Response Management Systems Market Revenue (Million) Forecast, by Application 2019 & 2032
- Table 77: Colombia Industrial Demand Response Management Systems Market Revenue (Million) Forecast, by Application 2019 & 2032
- Table 78: Rest of South America Industrial Demand Response Management Systems Market Revenue (Million) Forecast, by Application 2019 & 2032
- Table 79: Global Industrial Demand Response Management Systems Market Revenue Million Forecast, by Type 2019 & 2032
- Table 80: Global Industrial Demand Response Management Systems Market Revenue Million Forecast, by Country 2019 & 2032
- Table 81: Saudi Arabia Industrial Demand Response Management Systems Market Revenue (Million) Forecast, by Application 2019 & 2032
- Table 82: United Arab Emirates Industrial Demand Response Management Systems Market Revenue (Million) Forecast, by Application 2019 & 2032
- Table 83: South Africa Industrial Demand Response Management Systems Market Revenue (Million) Forecast, by Application 2019 & 2032
- Table 84: Qatar Industrial Demand Response Management Systems Market Revenue (Million) Forecast, by Application 2019 & 2032
- Table 85: Egypt Industrial Demand Response Management Systems Market Revenue (Million) Forecast, by Application 2019 & 2032
- Table 86: Nigeria Industrial Demand Response Management Systems Market Revenue (Million) Forecast, by Application 2019 & 2032
- Table 87: Rest of Middle East Industrial Demand Response Management Systems Market Revenue (Million) Forecast, by Application 2019 & 2032
Frequently Asked Questions
1. What is the projected Compound Annual Growth Rate (CAGR) of the Industrial Demand Response Management Systems Market?
The projected CAGR is approximately 9.07%.
2. Which companies are prominent players in the Industrial Demand Response Management Systems Market?
Key companies in the market include Autogrid Systems Inc, REGEN Energy Inc, ABB Ltd, Silver Spring Networks Inc, EnerNOC Inc, Hitachi Ltd, Mitsubishi Electric Corporation, Siemens AG, Alstom SA, Schneider Electric SE, Eaton Corporation PLC, General Electric Company.
3. What are the main segments of the Industrial Demand Response Management Systems Market?
The market segments include Type.
4. Can you provide details about the market size?
The market size is estimated to be USD 2.79 Million as of 2022.
5. What are some drivers contributing to market growth?
4.; Need for Efficient Energy Management Systems4.; Growing Penetration of Renewable Energy Sources.
6. What are the notable trends driving market growth?
Growing Penetration of Renewable Energy Sources to Drive the Market.
7. Are there any restraints impacting market growth?
4.; Privacy Concerns on the Industrial Demand Response Management Systems.
8. Can you provide examples of recent developments in the market?
June 2023: Vertiv launched its Vertiv EnerSav service, helping critical facility operators unlock cost savings through targeted energy reduction. This service avoided substantial infrastructure investments by conducting rigorous on-site assessments and gap analyses. Vertiv's innovative External Digital Demand Response Technology (EDD-RT) further optimizes energy consumption by dynamically adapting manufacturer settings based on live consumption patterns.
9. What pricing options are available for accessing the report?
Pricing options include single-user, multi-user, and enterprise licenses priced at USD 4750, USD 5250, and USD 8750 respectively.
10. Is the market size provided in terms of value or volume?
The market size is provided in terms of value, measured in Million.
11. Are there any specific market keywords associated with the report?
Yes, the market keyword associated with the report is "Industrial Demand Response Management Systems Market," which aids in identifying and referencing the specific market segment covered.
12. How do I determine which pricing option suits my needs best?
The pricing options vary based on user requirements and access needs. Individual users may opt for single-user licenses, while businesses requiring broader access may choose multi-user or enterprise licenses for cost-effective access to the report.
13. Are there any additional resources or data provided in the Industrial Demand Response Management Systems Market report?
While the report offers comprehensive insights, it's advisable to review the specific contents or supplementary materials provided to ascertain if additional resources or data are available.
14. How can I stay updated on further developments or reports in the Industrial Demand Response Management Systems Market?
To stay informed about further developments, trends, and reports in the Industrial Demand Response Management Systems Market, consider subscribing to industry newsletters, following relevant companies and organizations, or regularly checking reputable industry news sources and publications.
Methodology
Step 1 - Identification of Relevant Samples Size from Population Database


Step 2 - Approaches for Defining Global Market Size (Value, Volume* & Price*)

Note*: In applicable scenarios
Step 3 - Data Sources
Primary Research
- Web Analytics
- Survey Reports
- Research Institute
- Latest Research Reports
- Opinion Leaders
Secondary Research
- Annual Reports
- White Paper
- Latest Press Release
- Industry Association
- Paid Database
- Investor Presentations

Step 4 - Data Triangulation
Involves using different sources of information in order to increase the validity of a study
These sources are likely to be stakeholders in a program - participants, other researchers, program staff, other community members, and so on.
Then we put all data in single framework & apply various statistical tools to find out the dynamic on the market.
During the analysis stage, feedback from the stakeholder groups would be compared to determine areas of agreement as well as areas of divergence


