
Key Insights
The global market for keyboards and mice is poised for steady expansion, projected to reach an estimated value of $2122 million by 2033, exhibiting a Compound Annual Growth Rate (CAGR) of 4% during the forecast period of 2025-2033. This growth is primarily propelled by the ever-increasing demand for gaming peripherals and the sustained need for reliable input devices in office environments. The gaming segment, in particular, is a significant driver, fueled by the proliferation of e-sports, the growing popularity of PC gaming, and the continuous innovation in high-performance gaming mice and mechanical keyboards. As gamers seek enhanced precision, speed, and customization, manufacturers are responding with advanced features such as programmable buttons, customizable RGB lighting, and ergonomic designs, thereby stimulating market demand. Concurrently, the office sector continues to contribute to market stability, with businesses investing in ergonomic and efficient input devices to improve user comfort and productivity. The ongoing trend of remote work and hybrid office models further supports the demand for quality keyboards and mice for home and office setups alike.
While the market benefits from these strong drivers, it also faces certain restraints that could temper its growth trajectory. One such restraint is the increasing adoption of touch-based interfaces and voice command technology in certain applications, which may reduce the reliance on traditional keyboards and mice. Furthermore, the price sensitivity of some consumer segments and the availability of lower-cost alternatives could pose challenges for premium product manufacturers. Supply chain disruptions and fluctuating raw material costs also present potential headwinds. However, the market is also witnessing interesting trends that present new opportunities. The rise of wireless and multi-device connectivity solutions caters to user convenience, while the growing emphasis on sustainability is leading to the development of eco-friendly materials and manufacturing processes. The integration of AI and machine learning in advanced peripherals, offering personalized user experiences and predictive input capabilities, is another emerging trend that could redefine the market landscape. Companies like Logitech, Razer, and Corsair are at the forefront of these innovations, constantly pushing the boundaries of what input devices can offer.
This in-depth report offers a granular analysis of the global Keyboards and Mice market, providing essential insights for stakeholders navigating this dynamic industry. Covering a comprehensive study period from 2019 to 2033, with a base year of 2025 and a forecast period from 2025 to 2033, this report delves into market structure, dynamics, regional dominance, product innovations, and future outlook. Leveraging high-ranking keywords, this report is optimized for search visibility and designed to engage industry professionals seeking actionable intelligence.
Keyboards and Mice Market Structure & Innovation Trends
The global Keyboards and Mice market exhibits a moderate concentration, with key players like Logitech, Microsoft, and Lenovo holding significant market share, estimated at over 50 million units each in 2025. Innovation is primarily driven by advancements in connectivity (wireless, Bluetooth), ergonomic designs, and specialized features for gaming and professional productivity. Regulatory frameworks, while generally permissive, focus on electromagnetic compatibility and safety standards. Product substitutes, such as touchscreens and voice commands, pose a growing, albeit still limited, threat. End-user demographics reveal a strong demand from both the gaming community and the burgeoning remote workforce, estimated to represent over 70 million users globally in 2025. Mergers and acquisitions (M&A) activities have been moderate, with deal values in the range of 10 to 50 million, indicating a strategic consolidation phase for some niche players.
Keyboards and Mice Market Dynamics & Trends
The Keyboards and Mice market is projected to experience robust growth, driven by an estimated Compound Annual Growth Rate (CAGR) of 7.5% during the forecast period. Technological disruptions, including the proliferation of low-latency wireless technology, the integration of AI for predictive typing, and the development of haptic feedback mechanisms, are reshaping product offerings. Consumer preferences are increasingly polarized, with a strong demand for high-performance, customizable gaming peripherals and a growing emphasis on ergonomic, silent, and eco-friendly solutions for office environments. Market penetration for advanced wireless solutions is expected to reach 80% by 2033. The competitive landscape is intense, characterized by continuous product innovation, aggressive pricing strategies, and strategic partnerships between hardware manufacturers and software developers. The growing trend of remote work and the expansion of the esports industry are significant market accelerators, driving demand for specialized and high-quality input devices. The adoption of mechanical keyboards in mainstream computing, beyond just gaming, is also a notable trend, contributing to market expansion.
Dominant Regions & Segments in Keyboards and Mice
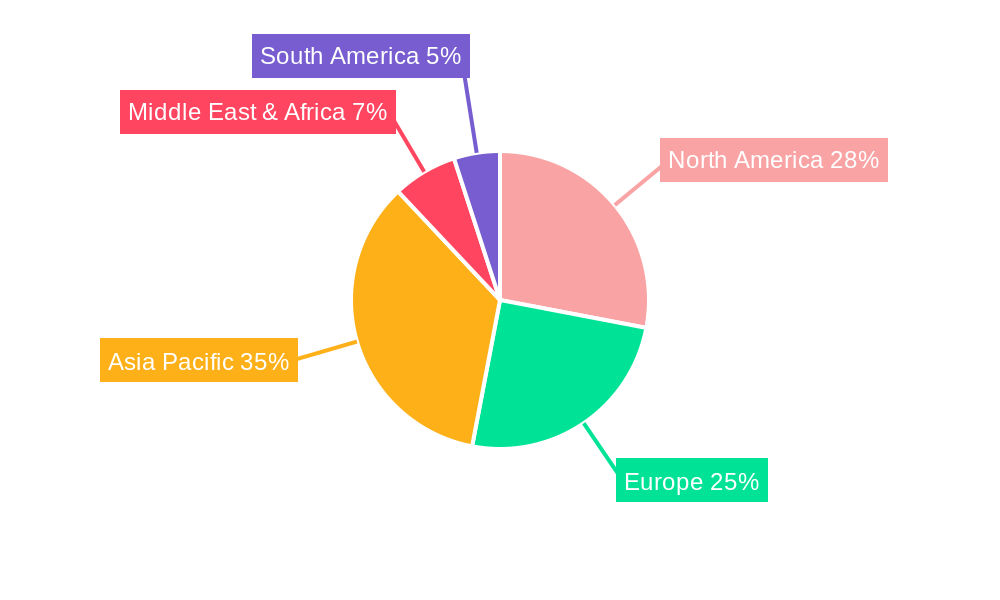
North America and Europe currently dominate the Keyboards and Mice market, collectively accounting for an estimated 60% of global sales in 2025. Within these regions, the United States and Germany, respectively, are leading countries. The Gaming application segment is a significant growth engine, projected to capture over 45% of the market by 2033, driven by increasing disposable incomes, the burgeoning esports industry, and the widespread adoption of high-definition gaming consoles and PCs. Economic policies supporting technological innovation and strong consumer spending power are key drivers in these leading regions.
- Key Drivers for Gaming Dominance:
- Growth of the global esports market, projected to reach over 1.5 billion viewers by 2025.
- Increasing adoption of high-refresh-rate displays and advanced graphics cards, necessitating responsive input devices.
- Availability of premium gaming peripherals with customizable RGB lighting, programmable macros, and specialized switches.
- Significant marketing investments by gaming peripheral brands targeting this enthusiast segment.
The Office application segment remains a substantial contributor, driven by hybrid work models and the ongoing need for efficient productivity tools, estimated to hold 40% of the market share in 2025. The Keyboards segment, in particular, is expected to witness steady growth due to the demand for both ergonomic and mechanical variants.
Keyboards and Mice Product Innovations
Product innovations are centered on enhancing user experience and performance. Developments include ultra-low latency wireless technologies, advanced optical switches for faster actuation, customizable keycaps, and integrated OLED displays for gaming keyboards. For mice, innovations focus on lighter weights, higher DPI sensors, ergonomic designs catering to specific grip styles, and adaptive polling rates. These advancements provide competitive advantages by appealing to niche user demands and setting new industry benchmarks for precision and responsiveness.
Keyboards and Mice Market Scope & Segmentation Analysis
The market is segmented by Application into Gaming and Office. The Gaming segment, projected for a market size of over 30 million units in 2025, is expected to grow at a CAGR of 8.2% due to the rising popularity of esports and the demand for performance-driven peripherals. The Office segment, with an estimated market size of 25 million units in 2025, is projected to grow at a CAGR of 6.8%, driven by hybrid work trends and the demand for ergonomic and silent solutions.
The market is also segmented by Type into Mouse and Keyboards. The Mouse segment is anticipated to reach over 35 million units in 2025, with a CAGR of 7.1%, while the Keyboards segment is projected to reach over 20 million units in 2025, with a CAGR of 8.0%.
Key Drivers of Keyboards and Mice Growth
Key growth drivers include the sustained expansion of the global gaming industry, the increasing adoption of remote and hybrid work models, and rapid technological advancements in wireless connectivity and sensor technology. The growing popularity of esports, estimated to reach a global audience of over 1.5 billion by 2025, directly fuels demand for high-performance gaming keyboards and mice. Furthermore, the proliferation of smart devices and the demand for enhanced user interfaces in various industrial applications also contribute to market expansion. Government initiatives promoting digital transformation and technological adoption further bolster market growth.
Challenges in the Keyboards and Mice Sector
The sector faces challenges such as intense price competition among manufacturers, leading to thinner profit margins. Supply chain disruptions, as observed in recent years, can impact production and lead times. The increasing adoption of integrated touch interfaces on devices and the evolving nature of human-computer interaction present long-term substitution threats. Regulatory hurdles related to e-waste and material sourcing also pose challenges, requiring manufacturers to invest in sustainable practices.
Emerging Opportunities in Keyboards and Mice
Emerging opportunities lie in the development of eco-friendly and sustainable peripherals, leveraging biodegradable materials and energy-efficient designs. The growing demand for personalized and customizable input devices, particularly in the gaming and professional creative sectors, presents a significant opportunity. The expansion into emerging markets with a growing middle class and increasing internet penetration offers substantial untapped potential. Innovations in haptic feedback technology and AI-powered predictive input are also areas ripe for exploration.
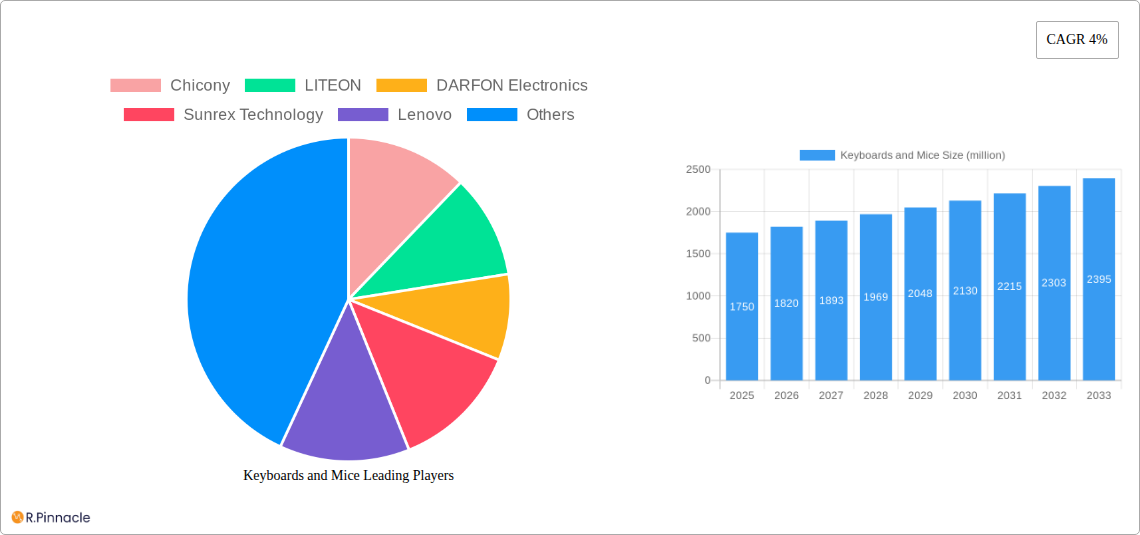
Leading Players in the Keyboards and Mice Market
- Chicony
- LITEON
- DARFON Electronics
- Sunrex Technology
- Lenovo
- Microsoft
- Logitech
- Razer
- Cherry
- Corsair
- Steelseries
- Rapoo
- Epicgear
- Bloody
- Ducky Channel
- COUGAR
- iOne Electronic
- Cooler Master
- Diatec
- Keycool
- Reachace
- Newmen
- Das Keyboard
Key Developments in Keyboards and Mice Industry
- 2024 Q1: Logitech launches advanced ergonomic wireless mouse series with enhanced battery life, targeting the professional market.
- 2024 Q2: Razer introduces a new line of mechanical keyboards with proprietary optical switches for ultra-fast response times in gaming.
- 2024 Q3: Microsoft releases updated Surface keyboards and mice with improved connectivity and a focus on productivity.
- 2024 Q4: Corsair unveils a new range of wireless gaming headsets and keyboards, emphasizing low-latency performance and customizability.
- 2025 Q1: Steelseries announces strategic partnerships with major esports organizations to promote their new high-performance peripherals.
- 2025 Q2: Cherry expands its range of silent mechanical switches, catering to the growing demand for quiet office environments.
- 2025 Q3: Rapoo introduces budget-friendly wireless keyboard and mouse combos with enhanced durability, targeting emerging markets.
Future Outlook for Keyboards and Mice Market
The future outlook for the Keyboards and Mice market is highly positive, fueled by continuous technological innovation and evolving user demands. The increasing integration of AI and advanced sensor technologies will lead to more intuitive and personalized input experiences. The sustained growth of the gaming and esports industries, coupled with the permanent shift towards flexible work arrangements, will ensure a steady demand for both specialized and general-purpose peripherals. Strategic investments in sustainable manufacturing and the exploration of new market segments will be crucial for long-term success, projecting a sustained growth trajectory for the industry.
Keyboards and Mice Segmentation
-
1. Application
- 1.1. Gaming
- 1.2. Office
-
2. Types
- 2.1. Mouse
- 2.2. Keyboards
Keyboards and Mice Segmentation By Geography
-
1. North America
- 1.1. United States
- 1.2. Canada
- 1.3. Mexico
-
2. South America
- 2.1. Brazil
- 2.2. Argentina
- 2.3. Rest of South America
-
3. Europe
- 3.1. United Kingdom
- 3.2. Germany
- 3.3. France
- 3.4. Italy
- 3.5. Spain
- 3.6. Russia
- 3.7. Benelux
- 3.8. Nordics
- 3.9. Rest of Europe
-
4. Middle East & Africa
- 4.1. Turkey
- 4.2. Israel
- 4.3. GCC
- 4.4. North Africa
- 4.5. South Africa
- 4.6. Rest of Middle East & Africa
-
5. Asia Pacific
- 5.1. China
- 5.2. India
- 5.3. Japan
- 5.4. South Korea
- 5.5. ASEAN
- 5.6. Oceania
- 5.7. Rest of Asia Pacific
Keyboards and Mice REPORT HIGHLIGHTS
| Aspects | Details |
|---|---|
| Study Period | 2019-2033 |
| Base Year | 2024 |
| Estimated Year | 2025 |
| Forecast Period | 2025-2033 |
| Historical Period | 2019-2024 |
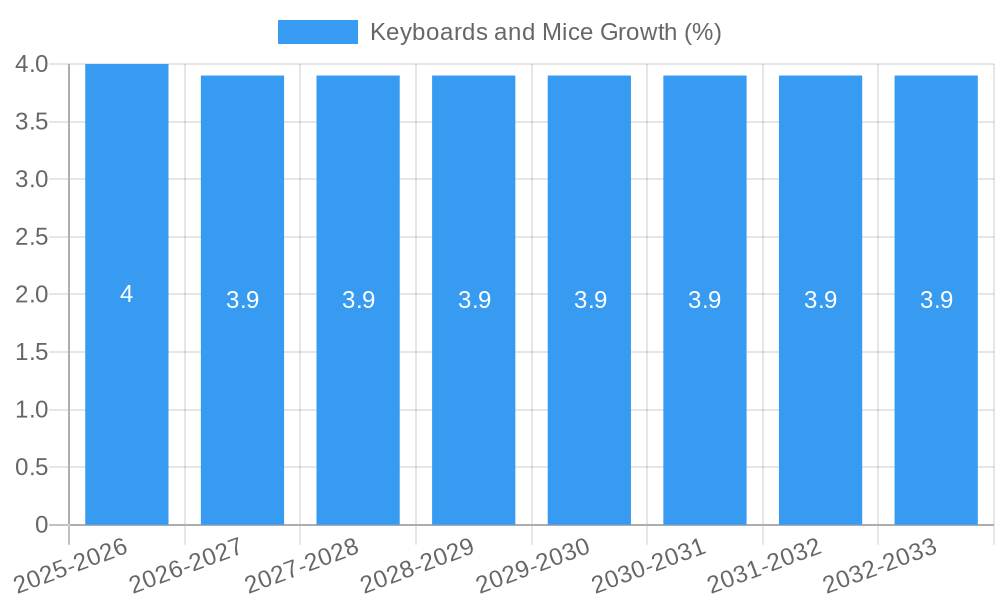
| Growth Rate | CAGR of 4% from 2019-2033 |
| Segmentation |
|
Table of Contents
- 1. Introduction
- 1.1. Research Scope
- 1.2. Market Segmentation
- 1.3. Research Methodology
- 1.4. Definitions and Assumptions
- 2. Executive Summary
- 2.1. Introduction
- 3. Market Dynamics
- 3.1. Introduction
- 3.2. Market Drivers
- 3.3. Market Restrains
- 3.4. Market Trends
- 4. Market Factor Analysis
- 4.1. Porters Five Forces
- 4.2. Supply/Value Chain
- 4.3. PESTEL analysis
- 4.4. Market Entropy
- 4.5. Patent/Trademark Analysis
- 5. Global Keyboards and Mice Analysis, Insights and Forecast, 2019-2031
- 5.1. Market Analysis, Insights and Forecast - by Application
- 5.1.1. Gaming
- 5.1.2. Office
- 5.2. Market Analysis, Insights and Forecast - by Types
- 5.2.1. Mouse
- 5.2.2. Keyboards
- 5.3. Market Analysis, Insights and Forecast - by Region
- 5.3.1. North America
- 5.3.2. South America
- 5.3.3. Europe
- 5.3.4. Middle East & Africa
- 5.3.5. Asia Pacific
- 5.1. Market Analysis, Insights and Forecast - by Application
- 6. North America Keyboards and Mice Analysis, Insights and Forecast, 2019-2031
- 6.1. Market Analysis, Insights and Forecast - by Application
- 6.1.1. Gaming
- 6.1.2. Office
- 6.2. Market Analysis, Insights and Forecast - by Types
- 6.2.1. Mouse
- 6.2.2. Keyboards
- 6.1. Market Analysis, Insights and Forecast - by Application
- 7. South America Keyboards and Mice Analysis, Insights and Forecast, 2019-2031
- 7.1. Market Analysis, Insights and Forecast - by Application
- 7.1.1. Gaming
- 7.1.2. Office
- 7.2. Market Analysis, Insights and Forecast - by Types
- 7.2.1. Mouse
- 7.2.2. Keyboards
- 7.1. Market Analysis, Insights and Forecast - by Application
- 8. Europe Keyboards and Mice Analysis, Insights and Forecast, 2019-2031
- 8.1. Market Analysis, Insights and Forecast - by Application
- 8.1.1. Gaming
- 8.1.2. Office
- 8.2. Market Analysis, Insights and Forecast - by Types
- 8.2.1. Mouse
- 8.2.2. Keyboards
- 8.1. Market Analysis, Insights and Forecast - by Application
- 9. Middle East & Africa Keyboards and Mice Analysis, Insights and Forecast, 2019-2031
- 9.1. Market Analysis, Insights and Forecast - by Application
- 9.1.1. Gaming
- 9.1.2. Office
- 9.2. Market Analysis, Insights and Forecast - by Types
- 9.2.1. Mouse
- 9.2.2. Keyboards
- 9.1. Market Analysis, Insights and Forecast - by Application
- 10. Asia Pacific Keyboards and Mice Analysis, Insights and Forecast, 2019-2031
- 10.1. Market Analysis, Insights and Forecast - by Application
- 10.1.1. Gaming
- 10.1.2. Office
- 10.2. Market Analysis, Insights and Forecast - by Types
- 10.2.1. Mouse
- 10.2.2. Keyboards
- 10.1. Market Analysis, Insights and Forecast - by Application
- 11. Competitive Analysis
- 11.1. Global Market Share Analysis 2024
- 11.2. Company Profiles
- 11.2.1 Chicony
- 11.2.1.1. Overview
- 11.2.1.2. Products
- 11.2.1.3. SWOT Analysis
- 11.2.1.4. Recent Developments
- 11.2.1.5. Financials (Based on Availability)
- 11.2.2 LITEON
- 11.2.2.1. Overview
- 11.2.2.2. Products
- 11.2.2.3. SWOT Analysis
- 11.2.2.4. Recent Developments
- 11.2.2.5. Financials (Based on Availability)
- 11.2.3 DARFON Electronics
- 11.2.3.1. Overview
- 11.2.3.2. Products
- 11.2.3.3. SWOT Analysis
- 11.2.3.4. Recent Developments
- 11.2.3.5. Financials (Based on Availability)
- 11.2.4 Sunrex Technology
- 11.2.4.1. Overview
- 11.2.4.2. Products
- 11.2.4.3. SWOT Analysis
- 11.2.4.4. Recent Developments
- 11.2.4.5. Financials (Based on Availability)
- 11.2.5 Lenovo
- 11.2.5.1. Overview
- 11.2.5.2. Products
- 11.2.5.3. SWOT Analysis
- 11.2.5.4. Recent Developments
- 11.2.5.5. Financials (Based on Availability)
- 11.2.6 Microsoft
- 11.2.6.1. Overview
- 11.2.6.2. Products
- 11.2.6.3. SWOT Analysis
- 11.2.6.4. Recent Developments
- 11.2.6.5. Financials (Based on Availability)
- 11.2.7 Logitech
- 11.2.7.1. Overview
- 11.2.7.2. Products
- 11.2.7.3. SWOT Analysis
- 11.2.7.4. Recent Developments
- 11.2.7.5. Financials (Based on Availability)
- 11.2.8 Razer
- 11.2.8.1. Overview
- 11.2.8.2. Products
- 11.2.8.3. SWOT Analysis
- 11.2.8.4. Recent Developments
- 11.2.8.5. Financials (Based on Availability)
- 11.2.9 Cherry
- 11.2.9.1. Overview
- 11.2.9.2. Products
- 11.2.9.3. SWOT Analysis
- 11.2.9.4. Recent Developments
- 11.2.9.5. Financials (Based on Availability)
- 11.2.10 Corsair
- 11.2.10.1. Overview
- 11.2.10.2. Products
- 11.2.10.3. SWOT Analysis
- 11.2.10.4. Recent Developments
- 11.2.10.5. Financials (Based on Availability)
- 11.2.11 Steelseries
- 11.2.11.1. Overview
- 11.2.11.2. Products
- 11.2.11.3. SWOT Analysis
- 11.2.11.4. Recent Developments
- 11.2.11.5. Financials (Based on Availability)
- 11.2.12 Rapoo
- 11.2.12.1. Overview
- 11.2.12.2. Products
- 11.2.12.3. SWOT Analysis
- 11.2.12.4. Recent Developments
- 11.2.12.5. Financials (Based on Availability)
- 11.2.13 Epicgear
- 11.2.13.1. Overview
- 11.2.13.2. Products
- 11.2.13.3. SWOT Analysis
- 11.2.13.4. Recent Developments
- 11.2.13.5. Financials (Based on Availability)
- 11.2.14 Bloody
- 11.2.14.1. Overview
- 11.2.14.2. Products
- 11.2.14.3. SWOT Analysis
- 11.2.14.4. Recent Developments
- 11.2.14.5. Financials (Based on Availability)
- 11.2.15 Ducky Channel
- 11.2.15.1. Overview
- 11.2.15.2. Products
- 11.2.15.3. SWOT Analysis
- 11.2.15.4. Recent Developments
- 11.2.15.5. Financials (Based on Availability)
- 11.2.16 COUGAR
- 11.2.16.1. Overview
- 11.2.16.2. Products
- 11.2.16.3. SWOT Analysis
- 11.2.16.4. Recent Developments
- 11.2.16.5. Financials (Based on Availability)
- 11.2.17 iOne Electronic
- 11.2.17.1. Overview
- 11.2.17.2. Products
- 11.2.17.3. SWOT Analysis
- 11.2.17.4. Recent Developments
- 11.2.17.5. Financials (Based on Availability)
- 11.2.18 Cooler Master
- 11.2.18.1. Overview
- 11.2.18.2. Products
- 11.2.18.3. SWOT Analysis
- 11.2.18.4. Recent Developments
- 11.2.18.5. Financials (Based on Availability)
- 11.2.19 Diatec
- 11.2.19.1. Overview
- 11.2.19.2. Products
- 11.2.19.3. SWOT Analysis
- 11.2.19.4. Recent Developments
- 11.2.19.5. Financials (Based on Availability)
- 11.2.20 Keycool
- 11.2.20.1. Overview
- 11.2.20.2. Products
- 11.2.20.3. SWOT Analysis
- 11.2.20.4. Recent Developments
- 11.2.20.5. Financials (Based on Availability)
- 11.2.21 Reachace
- 11.2.21.1. Overview
- 11.2.21.2. Products
- 11.2.21.3. SWOT Analysis
- 11.2.21.4. Recent Developments
- 11.2.21.5. Financials (Based on Availability)
- 11.2.22 Newmen
- 11.2.22.1. Overview
- 11.2.22.2. Products
- 11.2.22.3. SWOT Analysis
- 11.2.22.4. Recent Developments
- 11.2.22.5. Financials (Based on Availability)
- 11.2.23 Das Keyboard
- 11.2.23.1. Overview
- 11.2.23.2. Products
- 11.2.23.3. SWOT Analysis
- 11.2.23.4. Recent Developments
- 11.2.23.5. Financials (Based on Availability)
- 11.2.1 Chicony
List of Figures
- Figure 1: Global Keyboards and Mice Revenue Breakdown (million, %) by Region 2024 & 2032
- Figure 2: North America Keyboards and Mice Revenue (million), by Application 2024 & 2032
- Figure 3: North America Keyboards and Mice Revenue Share (%), by Application 2024 & 2032
- Figure 4: North America Keyboards and Mice Revenue (million), by Types 2024 & 2032
- Figure 5: North America Keyboards and Mice Revenue Share (%), by Types 2024 & 2032
- Figure 6: North America Keyboards and Mice Revenue (million), by Country 2024 & 2032
- Figure 7: North America Keyboards and Mice Revenue Share (%), by Country 2024 & 2032
- Figure 8: South America Keyboards and Mice Revenue (million), by Application 2024 & 2032
- Figure 9: South America Keyboards and Mice Revenue Share (%), by Application 2024 & 2032
- Figure 10: South America Keyboards and Mice Revenue (million), by Types 2024 & 2032
- Figure 11: South America Keyboards and Mice Revenue Share (%), by Types 2024 & 2032
- Figure 12: South America Keyboards and Mice Revenue (million), by Country 2024 & 2032
- Figure 13: South America Keyboards and Mice Revenue Share (%), by Country 2024 & 2032
- Figure 14: Europe Keyboards and Mice Revenue (million), by Application 2024 & 2032
- Figure 15: Europe Keyboards and Mice Revenue Share (%), by Application 2024 & 2032
- Figure 16: Europe Keyboards and Mice Revenue (million), by Types 2024 & 2032
- Figure 17: Europe Keyboards and Mice Revenue Share (%), by Types 2024 & 2032
- Figure 18: Europe Keyboards and Mice Revenue (million), by Country 2024 & 2032
- Figure 19: Europe Keyboards and Mice Revenue Share (%), by Country 2024 & 2032
- Figure 20: Middle East & Africa Keyboards and Mice Revenue (million), by Application 2024 & 2032
- Figure 21: Middle East & Africa Keyboards and Mice Revenue Share (%), by Application 2024 & 2032
- Figure 22: Middle East & Africa Keyboards and Mice Revenue (million), by Types 2024 & 2032
- Figure 23: Middle East & Africa Keyboards and Mice Revenue Share (%), by Types 2024 & 2032
- Figure 24: Middle East & Africa Keyboards and Mice Revenue (million), by Country 2024 & 2032
- Figure 25: Middle East & Africa Keyboards and Mice Revenue Share (%), by Country 2024 & 2032
- Figure 26: Asia Pacific Keyboards and Mice Revenue (million), by Application 2024 & 2032
- Figure 27: Asia Pacific Keyboards and Mice Revenue Share (%), by Application 2024 & 2032
- Figure 28: Asia Pacific Keyboards and Mice Revenue (million), by Types 2024 & 2032
- Figure 29: Asia Pacific Keyboards and Mice Revenue Share (%), by Types 2024 & 2032
- Figure 30: Asia Pacific Keyboards and Mice Revenue (million), by Country 2024 & 2032
- Figure 31: Asia Pacific Keyboards and Mice Revenue Share (%), by Country 2024 & 2032
List of Tables
- Table 1: Global Keyboards and Mice Revenue million Forecast, by Region 2019 & 2032
- Table 2: Global Keyboards and Mice Revenue million Forecast, by Application 2019 & 2032
- Table 3: Global Keyboards and Mice Revenue million Forecast, by Types 2019 & 2032
- Table 4: Global Keyboards and Mice Revenue million Forecast, by Region 2019 & 2032
- Table 5: Global Keyboards and Mice Revenue million Forecast, by Application 2019 & 2032
- Table 6: Global Keyboards and Mice Revenue million Forecast, by Types 2019 & 2032
- Table 7: Global Keyboards and Mice Revenue million Forecast, by Country 2019 & 2032
- Table 8: United States Keyboards and Mice Revenue (million) Forecast, by Application 2019 & 2032
- Table 9: Canada Keyboards and Mice Revenue (million) Forecast, by Application 2019 & 2032
- Table 10: Mexico Keyboards and Mice Revenue (million) Forecast, by Application 2019 & 2032
- Table 11: Global Keyboards and Mice Revenue million Forecast, by Application 2019 & 2032
- Table 12: Global Keyboards and Mice Revenue million Forecast, by Types 2019 & 2032
- Table 13: Global Keyboards and Mice Revenue million Forecast, by Country 2019 & 2032
- Table 14: Brazil Keyboards and Mice Revenue (million) Forecast, by Application 2019 & 2032
- Table 15: Argentina Keyboards and Mice Revenue (million) Forecast, by Application 2019 & 2032
- Table 16: Rest of South America Keyboards and Mice Revenue (million) Forecast, by Application 2019 & 2032
- Table 17: Global Keyboards and Mice Revenue million Forecast, by Application 2019 & 2032
- Table 18: Global Keyboards and Mice Revenue million Forecast, by Types 2019 & 2032
- Table 19: Global Keyboards and Mice Revenue million Forecast, by Country 2019 & 2032
- Table 20: United Kingdom Keyboards and Mice Revenue (million) Forecast, by Application 2019 & 2032
- Table 21: Germany Keyboards and Mice Revenue (million) Forecast, by Application 2019 & 2032
- Table 22: France Keyboards and Mice Revenue (million) Forecast, by Application 2019 & 2032
- Table 23: Italy Keyboards and Mice Revenue (million) Forecast, by Application 2019 & 2032
- Table 24: Spain Keyboards and Mice Revenue (million) Forecast, by Application 2019 & 2032
- Table 25: Russia Keyboards and Mice Revenue (million) Forecast, by Application 2019 & 2032
- Table 26: Benelux Keyboards and Mice Revenue (million) Forecast, by Application 2019 & 2032
- Table 27: Nordics Keyboards and Mice Revenue (million) Forecast, by Application 2019 & 2032
- Table 28: Rest of Europe Keyboards and Mice Revenue (million) Forecast, by Application 2019 & 2032
- Table 29: Global Keyboards and Mice Revenue million Forecast, by Application 2019 & 2032
- Table 30: Global Keyboards and Mice Revenue million Forecast, by Types 2019 & 2032
- Table 31: Global Keyboards and Mice Revenue million Forecast, by Country 2019 & 2032
- Table 32: Turkey Keyboards and Mice Revenue (million) Forecast, by Application 2019 & 2032
- Table 33: Israel Keyboards and Mice Revenue (million) Forecast, by Application 2019 & 2032
- Table 34: GCC Keyboards and Mice Revenue (million) Forecast, by Application 2019 & 2032
- Table 35: North Africa Keyboards and Mice Revenue (million) Forecast, by Application 2019 & 2032
- Table 36: South Africa Keyboards and Mice Revenue (million) Forecast, by Application 2019 & 2032
- Table 37: Rest of Middle East & Africa Keyboards and Mice Revenue (million) Forecast, by Application 2019 & 2032
- Table 38: Global Keyboards and Mice Revenue million Forecast, by Application 2019 & 2032
- Table 39: Global Keyboards and Mice Revenue million Forecast, by Types 2019 & 2032
- Table 40: Global Keyboards and Mice Revenue million Forecast, by Country 2019 & 2032
- Table 41: China Keyboards and Mice Revenue (million) Forecast, by Application 2019 & 2032
- Table 42: India Keyboards and Mice Revenue (million) Forecast, by Application 2019 & 2032
- Table 43: Japan Keyboards and Mice Revenue (million) Forecast, by Application 2019 & 2032
- Table 44: South Korea Keyboards and Mice Revenue (million) Forecast, by Application 2019 & 2032
- Table 45: ASEAN Keyboards and Mice Revenue (million) Forecast, by Application 2019 & 2032
- Table 46: Oceania Keyboards and Mice Revenue (million) Forecast, by Application 2019 & 2032
- Table 47: Rest of Asia Pacific Keyboards and Mice Revenue (million) Forecast, by Application 2019 & 2032
Frequently Asked Questions
1. What is the projected Compound Annual Growth Rate (CAGR) of the Keyboards and Mice?
The projected CAGR is approximately 4%.
2. Which companies are prominent players in the Keyboards and Mice?
Key companies in the market include Chicony, LITEON, DARFON Electronics, Sunrex Technology, Lenovo, Microsoft, Logitech, Razer, Cherry, Corsair, Steelseries, Rapoo, Epicgear, Bloody, Ducky Channel, COUGAR, iOne Electronic, Cooler Master, Diatec, Keycool, Reachace, Newmen, Das Keyboard.
3. What are the main segments of the Keyboards and Mice?
The market segments include Application, Types.
4. Can you provide details about the market size?
The market size is estimated to be USD 2122 million as of 2022.
5. What are some drivers contributing to market growth?
N/A
6. What are the notable trends driving market growth?
N/A
7. Are there any restraints impacting market growth?
N/A
8. Can you provide examples of recent developments in the market?
N/A
9. What pricing options are available for accessing the report?
Pricing options include single-user, multi-user, and enterprise licenses priced at USD 4900.00, USD 7350.00, and USD 9800.00 respectively.
10. Is the market size provided in terms of value or volume?
The market size is provided in terms of value, measured in million.
11. Are there any specific market keywords associated with the report?
Yes, the market keyword associated with the report is "Keyboards and Mice," which aids in identifying and referencing the specific market segment covered.
12. How do I determine which pricing option suits my needs best?
The pricing options vary based on user requirements and access needs. Individual users may opt for single-user licenses, while businesses requiring broader access may choose multi-user or enterprise licenses for cost-effective access to the report.
13. Are there any additional resources or data provided in the Keyboards and Mice report?
While the report offers comprehensive insights, it's advisable to review the specific contents or supplementary materials provided to ascertain if additional resources or data are available.
14. How can I stay updated on further developments or reports in the Keyboards and Mice?
To stay informed about further developments, trends, and reports in the Keyboards and Mice, consider subscribing to industry newsletters, following relevant companies and organizations, or regularly checking reputable industry news sources and publications.
Methodology
Step 1 - Identification of Relevant Samples Size from Population Database


Step 2 - Approaches for Defining Global Market Size (Value, Volume* & Price*)

Note*: In applicable scenarios
Step 3 - Data Sources
Primary Research
- Web Analytics
- Survey Reports
- Research Institute
- Latest Research Reports
- Opinion Leaders
Secondary Research
- Annual Reports
- White Paper
- Latest Press Release
- Industry Association
- Paid Database
- Investor Presentations

Step 4 - Data Triangulation
Involves using different sources of information in order to increase the validity of a study
These sources are likely to be stakeholders in a program - participants, other researchers, program staff, other community members, and so on.
Then we put all data in single framework & apply various statistical tools to find out the dynamic on the market.
During the analysis stage, feedback from the stakeholder groups would be compared to determine areas of agreement as well as areas of divergence


