
Key Insights
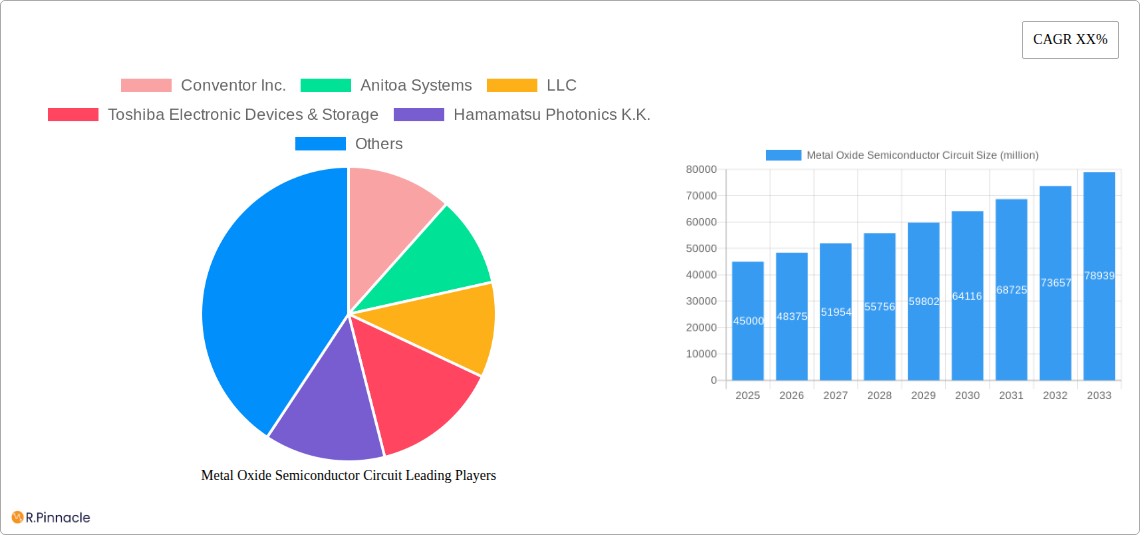
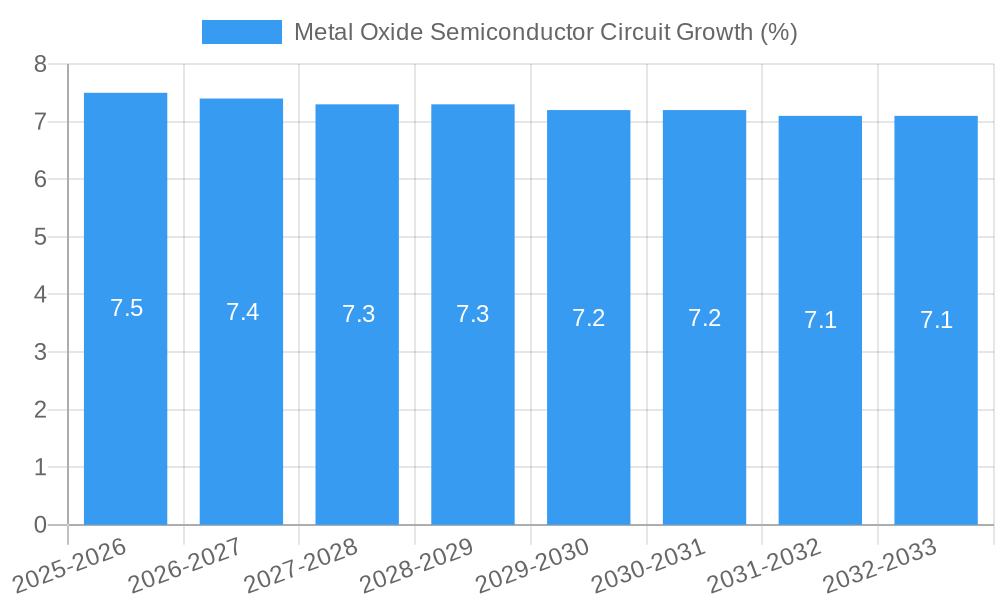
The global Metal Oxide Semiconductor (MOS) circuit market is poised for substantial growth, projected to reach a market size of approximately $45,000 million by 2025, with an estimated Compound Annual Growth Rate (CAGR) of 7.5% between 2025 and 2033. This expansion is primarily fueled by the escalating demand for advanced consumer electronics, including smartphones, wearables, and smart home devices, all of which heavily rely on sophisticated MOS circuit technology for processing power and energy efficiency. Furthermore, the burgeoning medical equipment sector, driven by innovations in diagnostic imaging, patient monitoring systems, and implantable devices, is another significant contributor to market growth. The increasing adoption of miniaturized and high-performance MOS circuits in these applications necessitates continuous innovation and development, underpinning the market's robust trajectory.
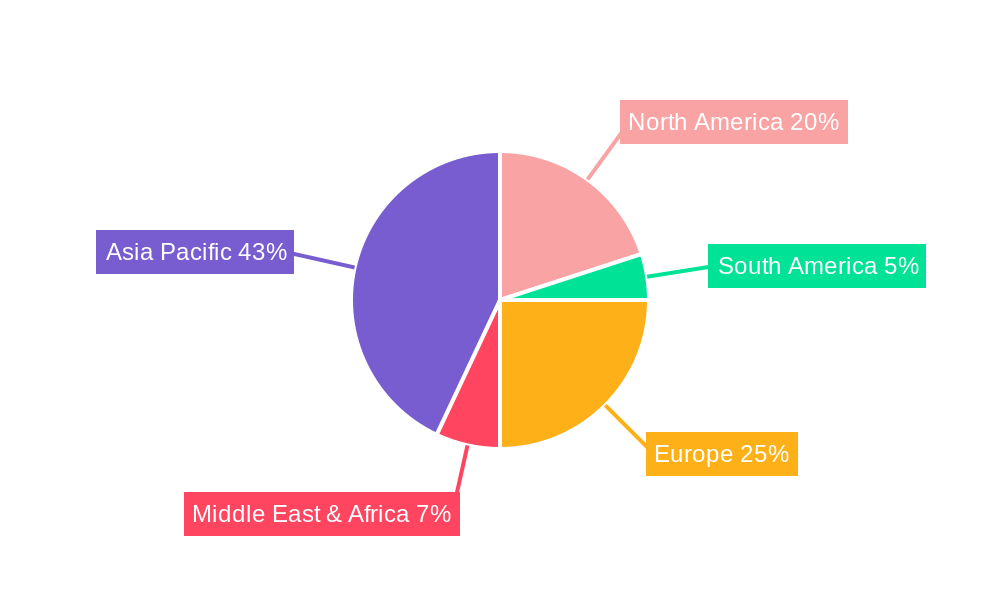
Several key trends are shaping the MOS circuit landscape. The development of advanced 3D MOS circuits, offering enhanced performance and reduced power consumption compared to traditional 2D designs, is gaining significant traction. This technological evolution is crucial for meeting the ever-increasing computational demands of modern applications. Geographically, the Asia Pacific region, led by China and Japan, is anticipated to dominate the market share due to its strong manufacturing base and high consumer adoption rates for electronics. However, restraints such as the rising costs of raw materials and the complexity of advanced fabrication processes could pose challenges. Despite these, the relentless pursuit of higher integration, lower power consumption, and greater functionality in semiconductor technology by leading companies like Sony Semiconductor Solutions Corporation and ams-OSRAM AG will continue to drive market expansion and innovation.
This comprehensive market research report provides an in-depth analysis of the global Metal Oxide Semiconductor (MOS) Circuit market, encompassing historical data, current trends, and future projections. Covering the study period from 2019 to 2033, with a base year of 2025, this report offers actionable insights for industry stakeholders, including manufacturers, suppliers, investors, and end-users.
Metal Oxide Semiconductor Circuit Market Structure & Innovation Trends
The Metal Oxide Semiconductor Circuit market exhibits a moderately consolidated structure, with key players like Conventor Inc., Anitoa Systems, LLC, and Toshiba Electronic Devices & Storage holding significant market share. Innovation is a primary driver, with ongoing research and development focused on enhancing device performance, reducing power consumption, and increasing miniaturization. Regulatory frameworks, while generally supportive of technological advancement, also ensure adherence to safety and environmental standards, impacting product development cycles. Product substitutes, such as Gallium Nitride (GaN) and Silicon Carbide (SiC) based semiconductors, present a competitive challenge, particularly in high-power applications. End-user demographics are increasingly sophisticated, demanding higher levels of integration and intelligence in devices. Mergers and acquisitions (M&A) activity is notable, with an estimated aggregate deal value in the hundreds of millions of dollars, as companies strategically consolidate to gain market share, access new technologies, and expand their product portfolios. The market share of leading companies is estimated to be in the tens of millions of dollars.
Metal Oxide Semiconductor Circuit Market Dynamics & Trends
The Metal Oxide Semiconductor (MOS) Circuit market is poised for robust growth, driven by an insatiable demand for increasingly sophisticated electronic devices across diverse sectors. The Compound Annual Growth Rate (CAGR) is projected to be approximately 10-12% over the forecast period. This expansion is fueled by the escalating adoption of MOS circuits in consumer electronics, including smartphones, wearables, and smart home devices, where enhanced processing power and energy efficiency are paramount. The medical equipment segment is another significant growth engine, with MOS circuits playing a crucial role in advanced diagnostic tools, implantable devices, and imaging systems, necessitating high reliability and precision. Industrial equipment, encompassing automation, robotics, and IoT devices, also contributes substantially to market expansion, demanding robust and high-performance semiconductor solutions. The pervasive trend towards miniaturization and increased functionality in electronic components directly benefits MOS circuits, enabling the development of more compact and powerful devices. Technological disruptions, such as the advancement of advanced packaging techniques and novel materials, are continuously pushing the boundaries of MOS circuit capabilities. Consumer preferences are increasingly geared towards seamless connectivity, personalized experiences, and energy-efficient products, all of which are directly addressed by the evolving landscape of MOS circuit technology. The competitive dynamics are characterized by intense R&D investment, strategic partnerships, and a globalized supply chain, with companies continuously striving for technological leadership and cost competitiveness. Market penetration for advanced MOS circuits in emerging economies is also on a steady rise, presenting substantial untapped potential. The overall market size is projected to reach tens of billions of dollars by 2033.
Dominant Regions & Segments in Metal Oxide Semiconductor Circuit
The Asia Pacific region stands as the undisputed leader in the Metal Oxide Semiconductor (MOS) Circuit market, driven by its dominant position in global electronics manufacturing. Countries like China, South Korea, and Taiwan are at the forefront, benefiting from robust government support, extensive semiconductor infrastructure, and a massive domestic consumer base. In this region, Consumer Electronics represents the largest and most influential application segment, accounting for an estimated 40-50% of the total market value. This dominance is underpinned by rapid technological adoption, a thriving e-commerce ecosystem, and a constant demand for the latest gadgets.
Key drivers for Asia Pacific's leadership include:
- Extensive Manufacturing Ecosystem: A highly developed and integrated supply chain for semiconductor fabrication and assembly.
- Government Initiatives: Significant investments in R&D, tax incentives, and strategic policies aimed at fostering semiconductor self-sufficiency.
- Skilled Workforce: A large pool of highly skilled engineers and technicians specializing in semiconductor design and manufacturing.
- Massive Consumer Market: A burgeoning population with high disposable income, creating substantial demand for consumer electronics.
Within the Types segmentation, the 2D MOS Circuit continues to hold a dominant position due to its established manufacturing processes and widespread application. However, the 3D MOS Circuit segment is experiencing rapid growth, driven by its superior performance characteristics, such as increased density and improved power efficiency, making it increasingly attractive for high-end applications in medical and industrial sectors.
The Medical Equipment segment, while smaller than consumer electronics, is a high-growth area with an estimated CAGR of 12-15%. This is fueled by an aging global population, increasing healthcare expenditure, and the continuous innovation in diagnostic, therapeutic, and monitoring devices. MOS circuits are essential for the miniaturization and enhanced functionality of advanced medical technologies like MRI machines, CT scanners, and sophisticated implantable devices.
The Industrial Equipment segment also demonstrates strong growth potential, with an estimated CAGR of 10-13%. This growth is driven by the ongoing digital transformation of industries, including the widespread adoption of automation, robotics, IoT, and smart manufacturing processes. MOS circuits are critical for the reliability and performance of sensors, control systems, and data processing units within these industrial applications.
Metal Oxide Semiconductor Circuit Product Innovations
Product innovations in Metal Oxide Semiconductor (MOS) Circuits are primarily focused on enhancing performance metrics such as speed, power efficiency, and integration density. Advancements in materials science and fabrication techniques are enabling the creation of smaller, more powerful, and more energy-efficient components. Key developments include novel device architectures that minimize leakage current and improve signal integrity, crucial for applications in advanced imaging sensors and high-frequency communication systems. Competitive advantages are being gained through the development of specialized MOS circuits tailored for specific market needs, such as low-power consumption for IoT devices and high-speed processing for AI applications.
Report Scope & Segmentation Analysis
This report segments the Metal Oxide Semiconductor Circuit market across key applications and circuit types. The Consumer Electronics segment, valued at approximately twenty billion dollars, is expected to grow at a CAGR of 10%, driven by the relentless demand for smartphones, wearables, and smart home devices. The Medical Equipment segment, estimated at five billion dollars, projects a CAGR of 13%, propelled by innovations in diagnostic and therapeutic technologies. The Industrial Equipment segment, valued at eight billion dollars, forecasts a CAGR of 11%, supported by the growing adoption of automation and IoT. The Others segment, encompassing automotive and aerospace, is estimated at three billion dollars with a CAGR of 9%. In terms of types, 2D MOS Circuits dominate the market with a size of thirty billion dollars and a CAGR of 9%, while 3D MOS Circuits, valued at three billion dollars, are anticipated to grow at a rapid CAGR of 18%, driven by their advanced performance capabilities.
Key Drivers of Metal Oxide Semiconductor Circuit Growth
The Metal Oxide Semiconductor (MOS) Circuit market is experiencing substantial growth driven by several key factors. Technologically, the relentless demand for miniaturization, increased processing power, and reduced energy consumption in electronic devices is a primary catalyst. Advancements in fabrication technologies, such as extreme ultraviolet (EUV) lithography, are enabling smaller and more efficient chip designs. Economically, the burgeoning global demand for consumer electronics, coupled with significant investments in the automotive, industrial automation, and medical sectors, is fueling market expansion. Regulatory support for technological innovation and the increasing adoption of digital transformation initiatives across industries also act as significant growth accelerators.
Challenges in the Metal Oxide Semiconductor Circuit Sector
Despite the promising growth trajectory, the Metal Oxide Semiconductor (MOS) Circuit sector faces several challenges. Intense competition from alternative semiconductor technologies like Gallium Nitride (GaN) and Silicon Carbide (SiC) in specific high-performance applications poses a significant restraint. Supply chain disruptions, particularly concerning the availability of raw materials and manufacturing capacity, can lead to production delays and increased costs, impacting market stability. Furthermore, the high cost of research and development and the capital-intensive nature of semiconductor fabrication require substantial investment, creating barriers for smaller players. Evolving environmental regulations and the need for sustainable manufacturing practices also present ongoing challenges that require adaptation and innovation.
Emerging Opportunities in Metal Oxide Semiconductor Circuit
The Metal Oxide Semiconductor (MOS) Circuit market is rife with emerging opportunities. The rapid growth of the Internet of Things (IoT) ecosystem presents a massive market for low-power, high-performance MOS circuits for sensors and connectivity devices. The increasing adoption of artificial intelligence (AI) and machine learning (ML) is driving demand for specialized processors and accelerators that leverage MOS technology. The expansion of 5G infrastructure and the development of next-generation wireless communication systems also require advanced MOS circuits for base stations and user equipment. Furthermore, emerging applications in augmented reality (AR), virtual reality (VR), and autonomous driving systems will create new avenues for innovation and market penetration.
Leading Players in the Metal Oxide Semiconductor Circuit Market
- Conventor Inc.
- Anitoa Systems, LLC
- Toshiba Electronic Devices & Storage
- Hamamatsu Photonics K.K.
- ams-OSRAM AG
- Sony Semiconductor Solutions Corporation
- Canon Global
- Teledyne AnaFocus
- Brillnics
- Teledyne e2v (UK) Ltd
Key Developments in Metal Oxide Semiconductor Circuit Industry
- 2023 March: Sony Semiconductor Solutions Corporation launched a new generation of image sensors with enhanced low-light performance, leveraging advanced MOS technology for medical imaging.
- 2023 August: Toshiba Electronic Devices & Storage announced significant advancements in its power MOS transistors, improving energy efficiency for industrial applications.
- 2024 January: ams-OSRAM AG unveiled a new series of high-performance analog ICs based on MOS technology, targeting automotive applications.
- 2024 June: Teledyne e2v (UK) Ltd introduced innovative CMOS image sensors with integrated processing capabilities for demanding industrial vision systems.
- 2025 Q1 (Estimated): Conventor Inc. is expected to announce a new platform for advanced 3D MOS circuits, aiming to boost processing power and reduce form factors for next-generation consumer electronics.
Future Outlook for Metal Oxide Semiconductor Circuit Market
The future outlook for the Metal Oxide Semiconductor (MOS) Circuit market is exceptionally bright, characterized by sustained innovation and expanding applications. The continued evolution of artificial intelligence, the proliferation of the Internet of Things, and the ongoing demand for more powerful and energy-efficient consumer electronics will serve as potent growth accelerators. Advancements in 3D integration and novel materials are expected to unlock new performance benchmarks, enabling breakthrough functionalities in fields such as autonomous systems, advanced healthcare, and next-generation communication networks. Strategic collaborations and ongoing R&D investments by leading players will further propel the market forward, solidifying the indispensable role of MOS circuits in shaping the technological landscape of the future.
Metal Oxide Semiconductor Circuit Segmentation
-
1. Application
- 1.1. Consumer Electronics
- 1.2. Medical Equipment
- 1.3. Industrial Equipment
- 1.4. Others
-
2. Types
- 2.1. 2D MOS Circuit
- 2.2. 3D MOS Circuit
Metal Oxide Semiconductor Circuit Segmentation By Geography
-
1. North America
- 1.1. United States
- 1.2. Canada
- 1.3. Mexico
-
2. South America
- 2.1. Brazil
- 2.2. Argentina
- 2.3. Rest of South America
-
3. Europe
- 3.1. United Kingdom
- 3.2. Germany
- 3.3. France
- 3.4. Italy
- 3.5. Spain
- 3.6. Russia
- 3.7. Benelux
- 3.8. Nordics
- 3.9. Rest of Europe
-
4. Middle East & Africa
- 4.1. Turkey
- 4.2. Israel
- 4.3. GCC
- 4.4. North Africa
- 4.5. South Africa
- 4.6. Rest of Middle East & Africa
-
5. Asia Pacific
- 5.1. China
- 5.2. India
- 5.3. Japan
- 5.4. South Korea
- 5.5. ASEAN
- 5.6. Oceania
- 5.7. Rest of Asia Pacific
Metal Oxide Semiconductor Circuit REPORT HIGHLIGHTS
| Aspects | Details |
|---|---|
| Study Period | 2019-2033 |
| Base Year | 2024 |
| Estimated Year | 2025 |
| Forecast Period | 2025-2033 |
| Historical Period | 2019-2024 |
| Growth Rate | CAGR of XX% from 2019-2033 |
| Segmentation |
|
Table of Contents
- 1. Introduction
- 1.1. Research Scope
- 1.2. Market Segmentation
- 1.3. Research Methodology
- 1.4. Definitions and Assumptions
- 2. Executive Summary
- 2.1. Introduction
- 3. Market Dynamics
- 3.1. Introduction
- 3.2. Market Drivers
- 3.3. Market Restrains
- 3.4. Market Trends
- 4. Market Factor Analysis
- 4.1. Porters Five Forces
- 4.2. Supply/Value Chain
- 4.3. PESTEL analysis
- 4.4. Market Entropy
- 4.5. Patent/Trademark Analysis
- 5. Global Metal Oxide Semiconductor Circuit Analysis, Insights and Forecast, 2019-2031
- 5.1. Market Analysis, Insights and Forecast - by Application
- 5.1.1. Consumer Electronics
- 5.1.2. Medical Equipment
- 5.1.3. Industrial Equipment
- 5.1.4. Others
- 5.2. Market Analysis, Insights and Forecast - by Types
- 5.2.1. 2D MOS Circuit
- 5.2.2. 3D MOS Circuit
- 5.3. Market Analysis, Insights and Forecast - by Region
- 5.3.1. North America
- 5.3.2. South America
- 5.3.3. Europe
- 5.3.4. Middle East & Africa
- 5.3.5. Asia Pacific
- 5.1. Market Analysis, Insights and Forecast - by Application
- 6. North America Metal Oxide Semiconductor Circuit Analysis, Insights and Forecast, 2019-2031
- 6.1. Market Analysis, Insights and Forecast - by Application
- 6.1.1. Consumer Electronics
- 6.1.2. Medical Equipment
- 6.1.3. Industrial Equipment
- 6.1.4. Others
- 6.2. Market Analysis, Insights and Forecast - by Types
- 6.2.1. 2D MOS Circuit
- 6.2.2. 3D MOS Circuit
- 6.1. Market Analysis, Insights and Forecast - by Application
- 7. South America Metal Oxide Semiconductor Circuit Analysis, Insights and Forecast, 2019-2031
- 7.1. Market Analysis, Insights and Forecast - by Application
- 7.1.1. Consumer Electronics
- 7.1.2. Medical Equipment
- 7.1.3. Industrial Equipment
- 7.1.4. Others
- 7.2. Market Analysis, Insights and Forecast - by Types
- 7.2.1. 2D MOS Circuit
- 7.2.2. 3D MOS Circuit
- 7.1. Market Analysis, Insights and Forecast - by Application
- 8. Europe Metal Oxide Semiconductor Circuit Analysis, Insights and Forecast, 2019-2031
- 8.1. Market Analysis, Insights and Forecast - by Application
- 8.1.1. Consumer Electronics
- 8.1.2. Medical Equipment
- 8.1.3. Industrial Equipment
- 8.1.4. Others
- 8.2. Market Analysis, Insights and Forecast - by Types
- 8.2.1. 2D MOS Circuit
- 8.2.2. 3D MOS Circuit
- 8.1. Market Analysis, Insights and Forecast - by Application
- 9. Middle East & Africa Metal Oxide Semiconductor Circuit Analysis, Insights and Forecast, 2019-2031
- 9.1. Market Analysis, Insights and Forecast - by Application
- 9.1.1. Consumer Electronics
- 9.1.2. Medical Equipment
- 9.1.3. Industrial Equipment
- 9.1.4. Others
- 9.2. Market Analysis, Insights and Forecast - by Types
- 9.2.1. 2D MOS Circuit
- 9.2.2. 3D MOS Circuit
- 9.1. Market Analysis, Insights and Forecast - by Application
- 10. Asia Pacific Metal Oxide Semiconductor Circuit Analysis, Insights and Forecast, 2019-2031
- 10.1. Market Analysis, Insights and Forecast - by Application
- 10.1.1. Consumer Electronics
- 10.1.2. Medical Equipment
- 10.1.3. Industrial Equipment
- 10.1.4. Others
- 10.2. Market Analysis, Insights and Forecast - by Types
- 10.2.1. 2D MOS Circuit
- 10.2.2. 3D MOS Circuit
- 10.1. Market Analysis, Insights and Forecast - by Application
- 11. Competitive Analysis
- 11.1. Global Market Share Analysis 2024
- 11.2. Company Profiles
- 11.2.1 Conventor Inc.
- 11.2.1.1. Overview
- 11.2.1.2. Products
- 11.2.1.3. SWOT Analysis
- 11.2.1.4. Recent Developments
- 11.2.1.5. Financials (Based on Availability)
- 11.2.2 Anitoa Systems
- 11.2.2.1. Overview
- 11.2.2.2. Products
- 11.2.2.3. SWOT Analysis
- 11.2.2.4. Recent Developments
- 11.2.2.5. Financials (Based on Availability)
- 11.2.3 LLC
- 11.2.3.1. Overview
- 11.2.3.2. Products
- 11.2.3.3. SWOT Analysis
- 11.2.3.4. Recent Developments
- 11.2.3.5. Financials (Based on Availability)
- 11.2.4 Toshiba Electronic Devices & Storage
- 11.2.4.1. Overview
- 11.2.4.2. Products
- 11.2.4.3. SWOT Analysis
- 11.2.4.4. Recent Developments
- 11.2.4.5. Financials (Based on Availability)
- 11.2.5 Hamamatsu Photonics K.K.
- 11.2.5.1. Overview
- 11.2.5.2. Products
- 11.2.5.3. SWOT Analysis
- 11.2.5.4. Recent Developments
- 11.2.5.5. Financials (Based on Availability)
- 11.2.6 ams-OSRAM AG
- 11.2.6.1. Overview
- 11.2.6.2. Products
- 11.2.6.3. SWOT Analysis
- 11.2.6.4. Recent Developments
- 11.2.6.5. Financials (Based on Availability)
- 11.2.7 Sony Semiconductor Solutions Corporation
- 11.2.7.1. Overview
- 11.2.7.2. Products
- 11.2.7.3. SWOT Analysis
- 11.2.7.4. Recent Developments
- 11.2.7.5. Financials (Based on Availability)
- 11.2.8 Canon Global
- 11.2.8.1. Overview
- 11.2.8.2. Products
- 11.2.8.3. SWOT Analysis
- 11.2.8.4. Recent Developments
- 11.2.8.5. Financials (Based on Availability)
- 11.2.9 Teledyne AnaFocus
- 11.2.9.1. Overview
- 11.2.9.2. Products
- 11.2.9.3. SWOT Analysis
- 11.2.9.4. Recent Developments
- 11.2.9.5. Financials (Based on Availability)
- 11.2.10 Brillnics
- 11.2.10.1. Overview
- 11.2.10.2. Products
- 11.2.10.3. SWOT Analysis
- 11.2.10.4. Recent Developments
- 11.2.10.5. Financials (Based on Availability)
- 11.2.11 Teledyne e2v (UK) Ltd
- 11.2.11.1. Overview
- 11.2.11.2. Products
- 11.2.11.3. SWOT Analysis
- 11.2.11.4. Recent Developments
- 11.2.11.5. Financials (Based on Availability)
- 11.2.1 Conventor Inc.
List of Figures
- Figure 1: Global Metal Oxide Semiconductor Circuit Revenue Breakdown (million, %) by Region 2024 & 2032
- Figure 2: Global Metal Oxide Semiconductor Circuit Volume Breakdown (K, %) by Region 2024 & 2032
- Figure 3: North America Metal Oxide Semiconductor Circuit Revenue (million), by Application 2024 & 2032
- Figure 4: North America Metal Oxide Semiconductor Circuit Volume (K), by Application 2024 & 2032
- Figure 5: North America Metal Oxide Semiconductor Circuit Revenue Share (%), by Application 2024 & 2032
- Figure 6: North America Metal Oxide Semiconductor Circuit Volume Share (%), by Application 2024 & 2032
- Figure 7: North America Metal Oxide Semiconductor Circuit Revenue (million), by Types 2024 & 2032
- Figure 8: North America Metal Oxide Semiconductor Circuit Volume (K), by Types 2024 & 2032
- Figure 9: North America Metal Oxide Semiconductor Circuit Revenue Share (%), by Types 2024 & 2032
- Figure 10: North America Metal Oxide Semiconductor Circuit Volume Share (%), by Types 2024 & 2032
- Figure 11: North America Metal Oxide Semiconductor Circuit Revenue (million), by Country 2024 & 2032
- Figure 12: North America Metal Oxide Semiconductor Circuit Volume (K), by Country 2024 & 2032
- Figure 13: North America Metal Oxide Semiconductor Circuit Revenue Share (%), by Country 2024 & 2032
- Figure 14: North America Metal Oxide Semiconductor Circuit Volume Share (%), by Country 2024 & 2032
- Figure 15: South America Metal Oxide Semiconductor Circuit Revenue (million), by Application 2024 & 2032
- Figure 16: South America Metal Oxide Semiconductor Circuit Volume (K), by Application 2024 & 2032
- Figure 17: South America Metal Oxide Semiconductor Circuit Revenue Share (%), by Application 2024 & 2032
- Figure 18: South America Metal Oxide Semiconductor Circuit Volume Share (%), by Application 2024 & 2032
- Figure 19: South America Metal Oxide Semiconductor Circuit Revenue (million), by Types 2024 & 2032
- Figure 20: South America Metal Oxide Semiconductor Circuit Volume (K), by Types 2024 & 2032
- Figure 21: South America Metal Oxide Semiconductor Circuit Revenue Share (%), by Types 2024 & 2032
- Figure 22: South America Metal Oxide Semiconductor Circuit Volume Share (%), by Types 2024 & 2032
- Figure 23: South America Metal Oxide Semiconductor Circuit Revenue (million), by Country 2024 & 2032
- Figure 24: South America Metal Oxide Semiconductor Circuit Volume (K), by Country 2024 & 2032
- Figure 25: South America Metal Oxide Semiconductor Circuit Revenue Share (%), by Country 2024 & 2032
- Figure 26: South America Metal Oxide Semiconductor Circuit Volume Share (%), by Country 2024 & 2032
- Figure 27: Europe Metal Oxide Semiconductor Circuit Revenue (million), by Application 2024 & 2032
- Figure 28: Europe Metal Oxide Semiconductor Circuit Volume (K), by Application 2024 & 2032
- Figure 29: Europe Metal Oxide Semiconductor Circuit Revenue Share (%), by Application 2024 & 2032
- Figure 30: Europe Metal Oxide Semiconductor Circuit Volume Share (%), by Application 2024 & 2032
- Figure 31: Europe Metal Oxide Semiconductor Circuit Revenue (million), by Types 2024 & 2032
- Figure 32: Europe Metal Oxide Semiconductor Circuit Volume (K), by Types 2024 & 2032
- Figure 33: Europe Metal Oxide Semiconductor Circuit Revenue Share (%), by Types 2024 & 2032
- Figure 34: Europe Metal Oxide Semiconductor Circuit Volume Share (%), by Types 2024 & 2032
- Figure 35: Europe Metal Oxide Semiconductor Circuit Revenue (million), by Country 2024 & 2032
- Figure 36: Europe Metal Oxide Semiconductor Circuit Volume (K), by Country 2024 & 2032
- Figure 37: Europe Metal Oxide Semiconductor Circuit Revenue Share (%), by Country 2024 & 2032
- Figure 38: Europe Metal Oxide Semiconductor Circuit Volume Share (%), by Country 2024 & 2032
- Figure 39: Middle East & Africa Metal Oxide Semiconductor Circuit Revenue (million), by Application 2024 & 2032
- Figure 40: Middle East & Africa Metal Oxide Semiconductor Circuit Volume (K), by Application 2024 & 2032
- Figure 41: Middle East & Africa Metal Oxide Semiconductor Circuit Revenue Share (%), by Application 2024 & 2032
- Figure 42: Middle East & Africa Metal Oxide Semiconductor Circuit Volume Share (%), by Application 2024 & 2032
- Figure 43: Middle East & Africa Metal Oxide Semiconductor Circuit Revenue (million), by Types 2024 & 2032
- Figure 44: Middle East & Africa Metal Oxide Semiconductor Circuit Volume (K), by Types 2024 & 2032
- Figure 45: Middle East & Africa Metal Oxide Semiconductor Circuit Revenue Share (%), by Types 2024 & 2032
- Figure 46: Middle East & Africa Metal Oxide Semiconductor Circuit Volume Share (%), by Types 2024 & 2032
- Figure 47: Middle East & Africa Metal Oxide Semiconductor Circuit Revenue (million), by Country 2024 & 2032
- Figure 48: Middle East & Africa Metal Oxide Semiconductor Circuit Volume (K), by Country 2024 & 2032
- Figure 49: Middle East & Africa Metal Oxide Semiconductor Circuit Revenue Share (%), by Country 2024 & 2032
- Figure 50: Middle East & Africa Metal Oxide Semiconductor Circuit Volume Share (%), by Country 2024 & 2032
- Figure 51: Asia Pacific Metal Oxide Semiconductor Circuit Revenue (million), by Application 2024 & 2032
- Figure 52: Asia Pacific Metal Oxide Semiconductor Circuit Volume (K), by Application 2024 & 2032
- Figure 53: Asia Pacific Metal Oxide Semiconductor Circuit Revenue Share (%), by Application 2024 & 2032
- Figure 54: Asia Pacific Metal Oxide Semiconductor Circuit Volume Share (%), by Application 2024 & 2032
- Figure 55: Asia Pacific Metal Oxide Semiconductor Circuit Revenue (million), by Types 2024 & 2032
- Figure 56: Asia Pacific Metal Oxide Semiconductor Circuit Volume (K), by Types 2024 & 2032
- Figure 57: Asia Pacific Metal Oxide Semiconductor Circuit Revenue Share (%), by Types 2024 & 2032
- Figure 58: Asia Pacific Metal Oxide Semiconductor Circuit Volume Share (%), by Types 2024 & 2032
- Figure 59: Asia Pacific Metal Oxide Semiconductor Circuit Revenue (million), by Country 2024 & 2032
- Figure 60: Asia Pacific Metal Oxide Semiconductor Circuit Volume (K), by Country 2024 & 2032
- Figure 61: Asia Pacific Metal Oxide Semiconductor Circuit Revenue Share (%), by Country 2024 & 2032
- Figure 62: Asia Pacific Metal Oxide Semiconductor Circuit Volume Share (%), by Country 2024 & 2032
List of Tables
- Table 1: Global Metal Oxide Semiconductor Circuit Revenue million Forecast, by Region 2019 & 2032
- Table 2: Global Metal Oxide Semiconductor Circuit Volume K Forecast, by Region 2019 & 2032
- Table 3: Global Metal Oxide Semiconductor Circuit Revenue million Forecast, by Application 2019 & 2032
- Table 4: Global Metal Oxide Semiconductor Circuit Volume K Forecast, by Application 2019 & 2032
- Table 5: Global Metal Oxide Semiconductor Circuit Revenue million Forecast, by Types 2019 & 2032
- Table 6: Global Metal Oxide Semiconductor Circuit Volume K Forecast, by Types 2019 & 2032
- Table 7: Global Metal Oxide Semiconductor Circuit Revenue million Forecast, by Region 2019 & 2032
- Table 8: Global Metal Oxide Semiconductor Circuit Volume K Forecast, by Region 2019 & 2032
- Table 9: Global Metal Oxide Semiconductor Circuit Revenue million Forecast, by Application 2019 & 2032
- Table 10: Global Metal Oxide Semiconductor Circuit Volume K Forecast, by Application 2019 & 2032
- Table 11: Global Metal Oxide Semiconductor Circuit Revenue million Forecast, by Types 2019 & 2032
- Table 12: Global Metal Oxide Semiconductor Circuit Volume K Forecast, by Types 2019 & 2032
- Table 13: Global Metal Oxide Semiconductor Circuit Revenue million Forecast, by Country 2019 & 2032
- Table 14: Global Metal Oxide Semiconductor Circuit Volume K Forecast, by Country 2019 & 2032
- Table 15: United States Metal Oxide Semiconductor Circuit Revenue (million) Forecast, by Application 2019 & 2032
- Table 16: United States Metal Oxide Semiconductor Circuit Volume (K) Forecast, by Application 2019 & 2032
- Table 17: Canada Metal Oxide Semiconductor Circuit Revenue (million) Forecast, by Application 2019 & 2032
- Table 18: Canada Metal Oxide Semiconductor Circuit Volume (K) Forecast, by Application 2019 & 2032
- Table 19: Mexico Metal Oxide Semiconductor Circuit Revenue (million) Forecast, by Application 2019 & 2032
- Table 20: Mexico Metal Oxide Semiconductor Circuit Volume (K) Forecast, by Application 2019 & 2032
- Table 21: Global Metal Oxide Semiconductor Circuit Revenue million Forecast, by Application 2019 & 2032
- Table 22: Global Metal Oxide Semiconductor Circuit Volume K Forecast, by Application 2019 & 2032
- Table 23: Global Metal Oxide Semiconductor Circuit Revenue million Forecast, by Types 2019 & 2032
- Table 24: Global Metal Oxide Semiconductor Circuit Volume K Forecast, by Types 2019 & 2032
- Table 25: Global Metal Oxide Semiconductor Circuit Revenue million Forecast, by Country 2019 & 2032
- Table 26: Global Metal Oxide Semiconductor Circuit Volume K Forecast, by Country 2019 & 2032
- Table 27: Brazil Metal Oxide Semiconductor Circuit Revenue (million) Forecast, by Application 2019 & 2032
- Table 28: Brazil Metal Oxide Semiconductor Circuit Volume (K) Forecast, by Application 2019 & 2032
- Table 29: Argentina Metal Oxide Semiconductor Circuit Revenue (million) Forecast, by Application 2019 & 2032
- Table 30: Argentina Metal Oxide Semiconductor Circuit Volume (K) Forecast, by Application 2019 & 2032
- Table 31: Rest of South America Metal Oxide Semiconductor Circuit Revenue (million) Forecast, by Application 2019 & 2032
- Table 32: Rest of South America Metal Oxide Semiconductor Circuit Volume (K) Forecast, by Application 2019 & 2032
- Table 33: Global Metal Oxide Semiconductor Circuit Revenue million Forecast, by Application 2019 & 2032
- Table 34: Global Metal Oxide Semiconductor Circuit Volume K Forecast, by Application 2019 & 2032
- Table 35: Global Metal Oxide Semiconductor Circuit Revenue million Forecast, by Types 2019 & 2032
- Table 36: Global Metal Oxide Semiconductor Circuit Volume K Forecast, by Types 2019 & 2032
- Table 37: Global Metal Oxide Semiconductor Circuit Revenue million Forecast, by Country 2019 & 2032
- Table 38: Global Metal Oxide Semiconductor Circuit Volume K Forecast, by Country 2019 & 2032
- Table 39: United Kingdom Metal Oxide Semiconductor Circuit Revenue (million) Forecast, by Application 2019 & 2032
- Table 40: United Kingdom Metal Oxide Semiconductor Circuit Volume (K) Forecast, by Application 2019 & 2032
- Table 41: Germany Metal Oxide Semiconductor Circuit Revenue (million) Forecast, by Application 2019 & 2032
- Table 42: Germany Metal Oxide Semiconductor Circuit Volume (K) Forecast, by Application 2019 & 2032
- Table 43: France Metal Oxide Semiconductor Circuit Revenue (million) Forecast, by Application 2019 & 2032
- Table 44: France Metal Oxide Semiconductor Circuit Volume (K) Forecast, by Application 2019 & 2032
- Table 45: Italy Metal Oxide Semiconductor Circuit Revenue (million) Forecast, by Application 2019 & 2032
- Table 46: Italy Metal Oxide Semiconductor Circuit Volume (K) Forecast, by Application 2019 & 2032
- Table 47: Spain Metal Oxide Semiconductor Circuit Revenue (million) Forecast, by Application 2019 & 2032
- Table 48: Spain Metal Oxide Semiconductor Circuit Volume (K) Forecast, by Application 2019 & 2032
- Table 49: Russia Metal Oxide Semiconductor Circuit Revenue (million) Forecast, by Application 2019 & 2032
- Table 50: Russia Metal Oxide Semiconductor Circuit Volume (K) Forecast, by Application 2019 & 2032
- Table 51: Benelux Metal Oxide Semiconductor Circuit Revenue (million) Forecast, by Application 2019 & 2032
- Table 52: Benelux Metal Oxide Semiconductor Circuit Volume (K) Forecast, by Application 2019 & 2032
- Table 53: Nordics Metal Oxide Semiconductor Circuit Revenue (million) Forecast, by Application 2019 & 2032
- Table 54: Nordics Metal Oxide Semiconductor Circuit Volume (K) Forecast, by Application 2019 & 2032
- Table 55: Rest of Europe Metal Oxide Semiconductor Circuit Revenue (million) Forecast, by Application 2019 & 2032
- Table 56: Rest of Europe Metal Oxide Semiconductor Circuit Volume (K) Forecast, by Application 2019 & 2032
- Table 57: Global Metal Oxide Semiconductor Circuit Revenue million Forecast, by Application 2019 & 2032
- Table 58: Global Metal Oxide Semiconductor Circuit Volume K Forecast, by Application 2019 & 2032
- Table 59: Global Metal Oxide Semiconductor Circuit Revenue million Forecast, by Types 2019 & 2032
- Table 60: Global Metal Oxide Semiconductor Circuit Volume K Forecast, by Types 2019 & 2032
- Table 61: Global Metal Oxide Semiconductor Circuit Revenue million Forecast, by Country 2019 & 2032
- Table 62: Global Metal Oxide Semiconductor Circuit Volume K Forecast, by Country 2019 & 2032
- Table 63: Turkey Metal Oxide Semiconductor Circuit Revenue (million) Forecast, by Application 2019 & 2032
- Table 64: Turkey Metal Oxide Semiconductor Circuit Volume (K) Forecast, by Application 2019 & 2032
- Table 65: Israel Metal Oxide Semiconductor Circuit Revenue (million) Forecast, by Application 2019 & 2032
- Table 66: Israel Metal Oxide Semiconductor Circuit Volume (K) Forecast, by Application 2019 & 2032
- Table 67: GCC Metal Oxide Semiconductor Circuit Revenue (million) Forecast, by Application 2019 & 2032
- Table 68: GCC Metal Oxide Semiconductor Circuit Volume (K) Forecast, by Application 2019 & 2032
- Table 69: North Africa Metal Oxide Semiconductor Circuit Revenue (million) Forecast, by Application 2019 & 2032
- Table 70: North Africa Metal Oxide Semiconductor Circuit Volume (K) Forecast, by Application 2019 & 2032
- Table 71: South Africa Metal Oxide Semiconductor Circuit Revenue (million) Forecast, by Application 2019 & 2032
- Table 72: South Africa Metal Oxide Semiconductor Circuit Volume (K) Forecast, by Application 2019 & 2032
- Table 73: Rest of Middle East & Africa Metal Oxide Semiconductor Circuit Revenue (million) Forecast, by Application 2019 & 2032
- Table 74: Rest of Middle East & Africa Metal Oxide Semiconductor Circuit Volume (K) Forecast, by Application 2019 & 2032
- Table 75: Global Metal Oxide Semiconductor Circuit Revenue million Forecast, by Application 2019 & 2032
- Table 76: Global Metal Oxide Semiconductor Circuit Volume K Forecast, by Application 2019 & 2032
- Table 77: Global Metal Oxide Semiconductor Circuit Revenue million Forecast, by Types 2019 & 2032
- Table 78: Global Metal Oxide Semiconductor Circuit Volume K Forecast, by Types 2019 & 2032
- Table 79: Global Metal Oxide Semiconductor Circuit Revenue million Forecast, by Country 2019 & 2032
- Table 80: Global Metal Oxide Semiconductor Circuit Volume K Forecast, by Country 2019 & 2032
- Table 81: China Metal Oxide Semiconductor Circuit Revenue (million) Forecast, by Application 2019 & 2032
- Table 82: China Metal Oxide Semiconductor Circuit Volume (K) Forecast, by Application 2019 & 2032
- Table 83: India Metal Oxide Semiconductor Circuit Revenue (million) Forecast, by Application 2019 & 2032
- Table 84: India Metal Oxide Semiconductor Circuit Volume (K) Forecast, by Application 2019 & 2032
- Table 85: Japan Metal Oxide Semiconductor Circuit Revenue (million) Forecast, by Application 2019 & 2032
- Table 86: Japan Metal Oxide Semiconductor Circuit Volume (K) Forecast, by Application 2019 & 2032
- Table 87: South Korea Metal Oxide Semiconductor Circuit Revenue (million) Forecast, by Application 2019 & 2032
- Table 88: South Korea Metal Oxide Semiconductor Circuit Volume (K) Forecast, by Application 2019 & 2032
- Table 89: ASEAN Metal Oxide Semiconductor Circuit Revenue (million) Forecast, by Application 2019 & 2032
- Table 90: ASEAN Metal Oxide Semiconductor Circuit Volume (K) Forecast, by Application 2019 & 2032
- Table 91: Oceania Metal Oxide Semiconductor Circuit Revenue (million) Forecast, by Application 2019 & 2032
- Table 92: Oceania Metal Oxide Semiconductor Circuit Volume (K) Forecast, by Application 2019 & 2032
- Table 93: Rest of Asia Pacific Metal Oxide Semiconductor Circuit Revenue (million) Forecast, by Application 2019 & 2032
- Table 94: Rest of Asia Pacific Metal Oxide Semiconductor Circuit Volume (K) Forecast, by Application 2019 & 2032
Frequently Asked Questions
1. What is the projected Compound Annual Growth Rate (CAGR) of the Metal Oxide Semiconductor Circuit?
The projected CAGR is approximately XX%.
2. Which companies are prominent players in the Metal Oxide Semiconductor Circuit?
Key companies in the market include Conventor Inc., Anitoa Systems, LLC, Toshiba Electronic Devices & Storage, Hamamatsu Photonics K.K., ams-OSRAM AG, Sony Semiconductor Solutions Corporation, Canon Global, Teledyne AnaFocus, Brillnics, Teledyne e2v (UK) Ltd.
3. What are the main segments of the Metal Oxide Semiconductor Circuit?
The market segments include Application, Types.
4. Can you provide details about the market size?
The market size is estimated to be USD XXX million as of 2022.
5. What are some drivers contributing to market growth?
N/A
6. What are the notable trends driving market growth?
N/A
7. Are there any restraints impacting market growth?
N/A
8. Can you provide examples of recent developments in the market?
N/A
9. What pricing options are available for accessing the report?
Pricing options include single-user, multi-user, and enterprise licenses priced at USD 3350.00, USD 5025.00, and USD 6700.00 respectively.
10. Is the market size provided in terms of value or volume?
The market size is provided in terms of value, measured in million and volume, measured in K.
11. Are there any specific market keywords associated with the report?
Yes, the market keyword associated with the report is "Metal Oxide Semiconductor Circuit," which aids in identifying and referencing the specific market segment covered.
12. How do I determine which pricing option suits my needs best?
The pricing options vary based on user requirements and access needs. Individual users may opt for single-user licenses, while businesses requiring broader access may choose multi-user or enterprise licenses for cost-effective access to the report.
13. Are there any additional resources or data provided in the Metal Oxide Semiconductor Circuit report?
While the report offers comprehensive insights, it's advisable to review the specific contents or supplementary materials provided to ascertain if additional resources or data are available.
14. How can I stay updated on further developments or reports in the Metal Oxide Semiconductor Circuit?
To stay informed about further developments, trends, and reports in the Metal Oxide Semiconductor Circuit, consider subscribing to industry newsletters, following relevant companies and organizations, or regularly checking reputable industry news sources and publications.
Methodology
Step 1 - Identification of Relevant Samples Size from Population Database


Step 2 - Approaches for Defining Global Market Size (Value, Volume* & Price*)

Note*: In applicable scenarios
Step 3 - Data Sources
Primary Research
- Web Analytics
- Survey Reports
- Research Institute
- Latest Research Reports
- Opinion Leaders
Secondary Research
- Annual Reports
- White Paper
- Latest Press Release
- Industry Association
- Paid Database
- Investor Presentations

Step 4 - Data Triangulation
Involves using different sources of information in order to increase the validity of a study
These sources are likely to be stakeholders in a program - participants, other researchers, program staff, other community members, and so on.
Then we put all data in single framework & apply various statistical tools to find out the dynamic on the market.
During the analysis stage, feedback from the stakeholder groups would be compared to determine areas of agreement as well as areas of divergence


