
Key Insights
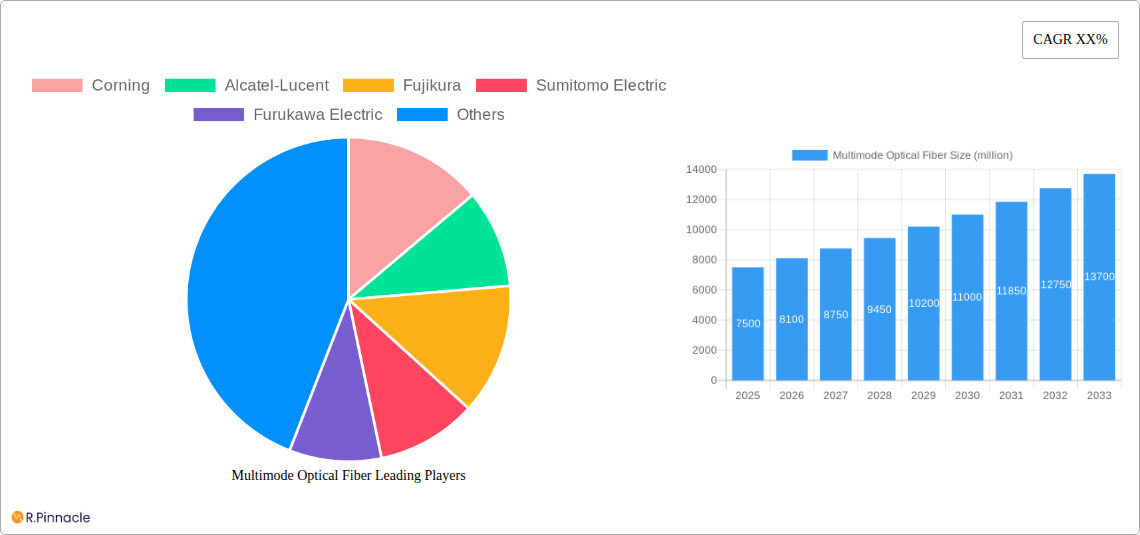
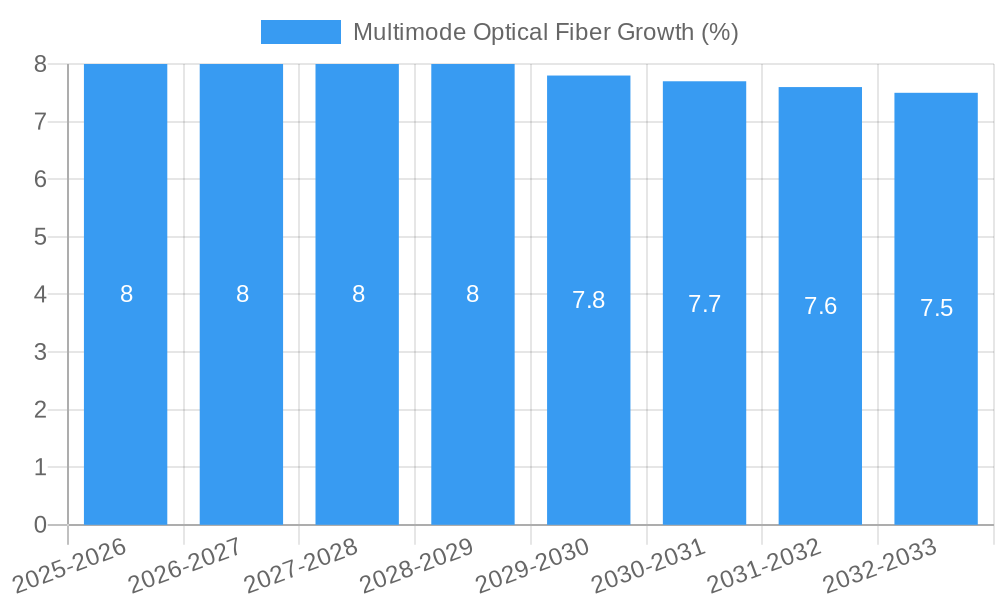
The Multimode Optical Fiber market is poised for robust expansion, projected to reach an estimated market size of $7,500 million by 2025. This growth is underpinned by a compelling Compound Annual Growth Rate (CAGR) of 8.5%, indicating sustained momentum throughout the forecast period ending in 2033. The primary drivers fueling this expansion are the escalating demand from the communication devices sector, driven by the relentless proliferation of high-speed internet, 5G deployment, and the burgeoning cloud computing landscape. Furthermore, the strategic investments in modernizing electric power systems and the increasing adoption of optical fiber in critical military and medical applications are significant contributors to market vitality. The dual benefits of cost-effectiveness and simplified installation for shorter-distance data transmission solidify multimode fiber's position as a preferred choice for a wide array of applications.
The market's dynamism is further amplified by several key trends. The increasing prevalence of higher bandwidth multimode fiber types, such as OM4 and OM5, designed to support next-generation data rates, is a prominent development. Innovations in fiber manufacturing processes are leading to improved performance and reduced attenuation, further enhancing their appeal. However, the market also faces certain restraints, including the ongoing advancements and increasing reach of single-mode optical fiber for longer-distance applications, which presents a competitive challenge. Additionally, the high initial capital expenditure for deploying fiber optic infrastructure, coupled with the need for specialized skilled labor, can pose adoption hurdles in certain regions and for specific end-users. Despite these challenges, the inherent advantages of multimode fiber in high-density, shorter-reach environments ensure its continued relevance and growth.
Multimode Optical Fiber Market: Comprehensive Analysis and Future Projections (2019-2033)
This in-depth report provides a detailed analysis of the global multimode optical fiber market, covering historical trends, current dynamics, and future growth trajectories from 2019 to 2033. Leveraging extensive research and industry expertise, this report offers actionable insights for stakeholders navigating this dynamic sector. Our comprehensive analysis focuses on key market segments, innovative technologies, competitive landscapes, and emerging opportunities, making it an indispensable resource for industry professionals. The study period encompasses historical data from 2019-2024, with 2025 serving as both the base and estimated year, and a robust forecast period from 2025-2033.
Multimode Optical Fiber Market Structure & Innovation Trends
The multimode optical fiber market exhibits a moderately concentrated structure, with key players like Corning, Alcatel-Lucent, Fujikura, Sumitomo Electric, Furukawa Electric, Pirelli, Yangtze Optical Fibre and Cable Company Ltd. (YOFC), Hengtong Optic-electric, Fiber Home Technologies Group, Futong Group, Tongding Group, Shenzhen Tefa Touchplus Information Corp, and Fasten Fiber optics Co.,Ltd (FPC) holding significant market share, estimated to be in the billions of dollars. Innovation is primarily driven by the demand for higher bandwidth, increased data transmission speeds, and improved signal integrity across various applications. Regulatory frameworks, particularly those pertaining to telecommunications infrastructure deployment and data privacy, play a crucial role in shaping market access and product development. Product substitutes, such as single-mode optical fiber and copper cabling, offer alternative solutions, but multimode fiber maintains its competitive edge in specific short-to-medium distance applications due to cost-effectiveness and ease of installation. End-user demographics are expanding beyond traditional telecommunications to include a growing demand from sectors like data centers, enterprise networks, and industrial automation. Mergers and acquisitions (M&A) activities are sporadic but significant, with estimated deal values in the hundreds of millions, aimed at consolidating market positions and acquiring new technologies. The overall market concentration is influenced by the significant R&D investments and proprietary technologies held by leading manufacturers.
Multimode Optical Fiber Market Dynamics & Trends
The multimode optical fiber market is poised for substantial growth, driven by a confluence of technological advancements, escalating data consumption, and the persistent digital transformation across industries. The Compound Annual Growth Rate (CAGR) for the multimode optical fiber market is projected to be robust, estimated between xx% and xx% throughout the forecast period (2025-2033). This growth is fueled by the insatiable demand for higher bandwidth solutions, essential for supporting emerging technologies such as 5G networks, artificial intelligence (AI), and the Internet of Things (IoT). As more devices become interconnected and data generation intensifies, the need for efficient and high-capacity data transmission mediums like multimode optical fiber becomes paramount. Technological disruptions, including advancements in fiber optic cable manufacturing processes and the development of higher-performance fiber types, are continually enhancing the capabilities of multimode fiber, making it a more attractive option for a wider range of applications. Consumer preferences are shifting towards solutions that offer superior performance, reliability, and scalability. In enterprise environments, the expansion of data centers and the growing adoption of cloud computing services necessitate robust backbone infrastructure, where multimode fiber plays a critical role in inter-building and intra-building connectivity. The competitive dynamics within the market are characterized by intense price competition, continuous product innovation, and strategic partnerships aimed at expanding market reach. Key players are investing heavily in research and development to introduce new fiber specifications that offer improved modal bandwidth and reduced signal loss, thereby enhancing transmission distances and data rates. Market penetration is steadily increasing, particularly in regions undergoing significant infrastructure upgrades and experiencing rapid industrialization. The increasing adoption of Ethernet and other high-speed networking standards further amplifies the demand for multimode optical fiber. The ongoing evolution of data transmission protocols and the relentless pursuit of faster data speeds ensure a sustained upward trajectory for the multimode optical fiber market.
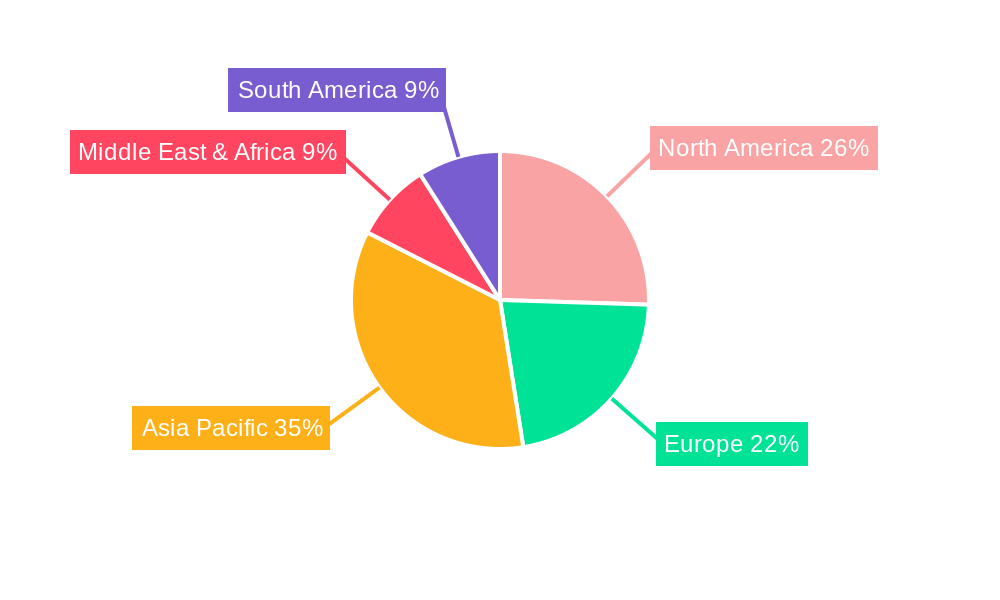
Dominant Regions & Segments in Multimode Optical Fiber
The global multimode optical fiber market is experiencing significant growth across various regions and application segments. North America, particularly the United States, and Asia Pacific, driven by countries like China, are emerging as dominant regions. This dominance is propelled by substantial investments in telecommunications infrastructure, rapid adoption of advanced networking technologies, and a robust presence of key market players. Economic policies that encourage digital transformation and infrastructure development, coupled with government initiatives supporting broadband expansion, are critical drivers in these regions. The Communication Devices segment stands out as the leading application, accounting for an estimated market share of over xx% of the total multimode optical fiber market value. This is directly attributable to the exponential growth in data traffic fueled by mobile broadband, cloud computing, and the proliferation of connected devices. The ongoing deployment of 5G networks, which require high-capacity fiber optic backhaul and fronthaul, significantly boosts demand.
Key Drivers for Dominance:
- North America: High adoption rates of advanced technologies, significant data center investments, and extensive fiber optic network deployments. Supportive regulatory environments and a strong R&D ecosystem.
- Asia Pacific (especially China): Massive government investments in digital infrastructure, the rapid expansion of telecommunications networks, and the growing demand from the manufacturing and industrial sectors. Lower manufacturing costs also contribute to regional dominance.
Within the Types segmentation, the 50/125μm multimode optical fiber is experiencing the highest demand. This type offers superior bandwidth and reach compared to older standards, making it ideal for high-speed data transmission in data centers, enterprise networks, and short-to-medium reach telecommunications applications. Its market share is estimated to be in the billions of dollars, outperforming the 62.5/125μm type due to its enhanced performance characteristics.
Dominance Analysis by Segment:
- Communication Devices: This segment's dominance is driven by the need for high-speed data transmission in smartphones, routers, switches, and other networking equipment. The transition to higher data rates within enterprise networks and the backbone of the internet infrastructure heavily relies on multimode fiber.
- 50/125μm Type: This fiber type's prevalence is linked to its compatibility with modern high-speed networking standards like 10GbE, 40GbE, and 100GbE. Its ability to support longer reach with higher data rates than older multimode fibers makes it the preferred choice for new installations and upgrades, especially in data centers where space and performance are critical.
Other segments like Military, Electric Power System, Medical, and Energy/Rail Transit are also contributing to market growth, albeit at a more moderate pace. The increasing digitalization and automation in these sectors are creating new avenues for multimode fiber adoption, particularly for critical infrastructure and specialized applications requiring robust and reliable data connectivity.
Multimode Optical Fiber Product Innovations
Multimode optical fiber manufacturers are continuously innovating to meet the escalating bandwidth demands. Recent product developments focus on enhancing modal bandwidth and reducing signal attenuation, enabling higher data rates over longer distances. Innovations include the development of OM4 and OM5 fiber categories, specifically designed for high-speed data center applications, offering significant improvements in performance for 40GbE and 100GbE Ethernet links, and even paving the way for 400GbE. These advancements provide competitive advantages by allowing for greater network flexibility, reduced cabling complexity, and cost savings in terms of infrastructure expansion. The market fit for these innovations is primarily within data centers, enterprise networks, and telecommunications backbones, where performance and scalability are paramount.
Report Scope & Segmentation Analysis
This report meticulously segments the multimode optical fiber market based on key parameters to provide a granular understanding of its structure and growth potential. The market is categorized by Application and Type.
Application Segments:
- Communication Devices: This segment encompasses the use of multimode optical fiber in telecommunications equipment, networking hardware, and data centers. It is projected to witness substantial growth due to the surging demand for data transmission.
- Military: Applications in military communications, radar systems, and electronic warfare systems. This segment is characterized by a need for robust and reliable fiber optic solutions.
- Electric Power System: Deployment in smart grids, substation automation, and monitoring systems, requiring high reliability and resistance to electromagnetic interference.
- Medical: Use in diagnostic equipment, surgical robots, and medical imaging systems, demanding high bandwidth and signal integrity for precision.
- Energy/Rail Transit: Applications in industrial automation, control systems, and telecommunications along energy pipelines and railway networks, where durability and consistent performance are critical.
Type Segments:
- 50/125μm: This fiber type is a significant market contributor, offering enhanced performance for high-speed applications. Its growth projection is strong, driven by data center expansion and enterprise network upgrades.
- 62.5/125μm: An older but still relevant standard, particularly in legacy systems. While its growth is slower compared to 50/125μm, it continues to hold a market share in specific applications and maintenance.
The analysis within each segment includes detailed market size estimations, growth projections, and an overview of the competitive landscape, providing a comprehensive view of the market's future trajectory.
Key Drivers of Multimode Optical Fiber Growth
The growth of the multimode optical fiber market is propelled by several interconnected factors. Technologically, the relentless demand for higher data speeds and increased bandwidth is a primary driver, fueled by the proliferation of bandwidth-intensive applications like high-definition video streaming, cloud computing, and virtual reality. Economically, the ongoing digital transformation across all sectors, coupled with significant investments in telecommunications infrastructure and data center expansion, creates a robust market for fiber optic solutions. Regulatory factors, such as government initiatives promoting broadband deployment and the standardization of high-speed networking technologies, also play a crucial role in stimulating market growth. For instance, initiatives like the EU's Digital Agenda and the US's Broadband Equity, Access, and Deployment (BEAD) program directly contribute to the increased demand for optical fiber.
Challenges in the Multimode Optical Fiber Sector
Despite its robust growth, the multimode optical fiber sector faces several challenges. Regulatory hurdles can arise from complex permitting processes for infrastructure deployment and varying national standards for telecommunications. Supply chain issues, including the availability of raw materials like silica and specialized manufacturing equipment, can impact production capacity and lead times. Competitive pressures, particularly from single-mode optical fiber in long-haul applications and copper cabling in very short-reach scenarios, necessitate continuous innovation and cost optimization. Furthermore, the skilled labor shortage for fiber optic installation and maintenance can also pose a restraint on market expansion. These challenges, if not addressed, could potentially impact the market's overall growth trajectory, with estimated impacts on market expansion ranging from xx% to xx% in affected regions.
Emerging Opportunities in Multimode Optical Fiber
The multimode optical fiber market is ripe with emerging opportunities, driven by technological advancements and evolving market demands. The expansion of edge computing and the increasing deployment of IoT devices create a growing need for high-speed, low-latency connectivity within shorter distances, a niche where multimode fiber excels. advancements in active optical cables (AOCs) and direct attach copper (DAC) alternatives are also presenting new competitive landscapes and application possibilities. Furthermore, the increasing focus on sustainable infrastructure and energy-efficient data centers opens avenues for multimode fiber solutions that offer improved power efficiency. The continuous evolution of network architectures, such as the growing adoption of Ethernet as a backbone for various industries, presents a sustained opportunity for multimode fiber. The exploration of new materials and manufacturing techniques could also lead to cost reductions and performance enhancements, further expanding its market reach.
Leading Players in the Multimode Optical Fiber Market
Corning Alcatel-Lucent Fujikura Sumitomo Electric Furukawa Electric Pirelli Yangtze Optical Fibre and Cable Company Ltd. (YOFC) Hengtong Optic-electric Fiber Home Technologies Group Futong Group Tongding Group Shenzhen Tefa Touchplus Information Corp Fasten Fiber optics Co.,Ltd (FPC)
Key Developments in Multimode Optical Fiber Industry
- 2023/05: Launch of new OM5 multimode fiber specifications by leading manufacturers, supporting 400GbE applications and beyond.
- 2022/11: Significant increase in data center construction globally, driving demand for high-density multimode fiber cabling.
- 2021/07: Increased R&D investment in bend-insensitive multimode fibers for improved installation flexibility.
- 2020/03: Growth in the adoption of 25GbE and 100GbE Ethernet in enterprise networks, boosting multimode fiber demand.
- 2019/10: Strategic partnerships formed between fiber manufacturers and networking equipment providers to offer integrated solutions.
Future Outlook for Multimode Optical Fiber Market
The future outlook for the multimode optical fiber market is exceptionally positive, characterized by sustained growth and continuous innovation. The escalating demand for data transmission, driven by emerging technologies and the ever-increasing digital footprint of businesses and consumers, will remain the primary growth accelerator. Strategic opportunities lie in further penetrating the rapidly expanding data center market, the development of specialized fibers for industrial IoT applications, and the integration of multimode fiber into next-generation communication networks. The market's ability to adapt to evolving bandwidth requirements and cost-efficiency demands will be crucial for its continued success. Investments in research and development to enhance performance metrics like modal bandwidth and signal integrity will further solidify multimode fiber's position as a vital component of global digital infrastructure, with projections indicating market expansion to reach billions of dollars by 2033.
Multimode Optical Fiber Segmentation
-
1. Application
- 1.1. Communication Devices
- 1.2. Military
- 1.3. Electric Power System
- 1.4. Medical
- 1.5. Energy/Rail Transit
-
2. Types
- 2.1. 50/125μm
- 2.2. 62.5/125μm
Multimode Optical Fiber Segmentation By Geography
-
1. North America
- 1.1. United States
- 1.2. Canada
- 1.3. Mexico
-
2. South America
- 2.1. Brazil
- 2.2. Argentina
- 2.3. Rest of South America
-
3. Europe
- 3.1. United Kingdom
- 3.2. Germany
- 3.3. France
- 3.4. Italy
- 3.5. Spain
- 3.6. Russia
- 3.7. Benelux
- 3.8. Nordics
- 3.9. Rest of Europe
-
4. Middle East & Africa
- 4.1. Turkey
- 4.2. Israel
- 4.3. GCC
- 4.4. North Africa
- 4.5. South Africa
- 4.6. Rest of Middle East & Africa
-
5. Asia Pacific
- 5.1. China
- 5.2. India
- 5.3. Japan
- 5.4. South Korea
- 5.5. ASEAN
- 5.6. Oceania
- 5.7. Rest of Asia Pacific
Multimode Optical Fiber REPORT HIGHLIGHTS
| Aspects | Details |
|---|---|
| Study Period | 2019-2033 |
| Base Year | 2024 |
| Estimated Year | 2025 |
| Forecast Period | 2025-2033 |
| Historical Period | 2019-2024 |
| Growth Rate | CAGR of XX% from 2019-2033 |
| Segmentation |
|
Table of Contents
- 1. Introduction
- 1.1. Research Scope
- 1.2. Market Segmentation
- 1.3. Research Methodology
- 1.4. Definitions and Assumptions
- 2. Executive Summary
- 2.1. Introduction
- 3. Market Dynamics
- 3.1. Introduction
- 3.2. Market Drivers
- 3.3. Market Restrains
- 3.4. Market Trends
- 4. Market Factor Analysis
- 4.1. Porters Five Forces
- 4.2. Supply/Value Chain
- 4.3. PESTEL analysis
- 4.4. Market Entropy
- 4.5. Patent/Trademark Analysis
- 5. Global Multimode Optical Fiber Analysis, Insights and Forecast, 2019-2031
- 5.1. Market Analysis, Insights and Forecast - by Application
- 5.1.1. Communication Devices
- 5.1.2. Military
- 5.1.3. Electric Power System
- 5.1.4. Medical
- 5.1.5. Energy/Rail Transit
- 5.2. Market Analysis, Insights and Forecast - by Types
- 5.2.1. 50/125μm
- 5.2.2. 62.5/125μm
- 5.3. Market Analysis, Insights and Forecast - by Region
- 5.3.1. North America
- 5.3.2. South America
- 5.3.3. Europe
- 5.3.4. Middle East & Africa
- 5.3.5. Asia Pacific
- 5.1. Market Analysis, Insights and Forecast - by Application
- 6. North America Multimode Optical Fiber Analysis, Insights and Forecast, 2019-2031
- 6.1. Market Analysis, Insights and Forecast - by Application
- 6.1.1. Communication Devices
- 6.1.2. Military
- 6.1.3. Electric Power System
- 6.1.4. Medical
- 6.1.5. Energy/Rail Transit
- 6.2. Market Analysis, Insights and Forecast - by Types
- 6.2.1. 50/125μm
- 6.2.2. 62.5/125μm
- 6.1. Market Analysis, Insights and Forecast - by Application
- 7. South America Multimode Optical Fiber Analysis, Insights and Forecast, 2019-2031
- 7.1. Market Analysis, Insights and Forecast - by Application
- 7.1.1. Communication Devices
- 7.1.2. Military
- 7.1.3. Electric Power System
- 7.1.4. Medical
- 7.1.5. Energy/Rail Transit
- 7.2. Market Analysis, Insights and Forecast - by Types
- 7.2.1. 50/125μm
- 7.2.2. 62.5/125μm
- 7.1. Market Analysis, Insights and Forecast - by Application
- 8. Europe Multimode Optical Fiber Analysis, Insights and Forecast, 2019-2031
- 8.1. Market Analysis, Insights and Forecast - by Application
- 8.1.1. Communication Devices
- 8.1.2. Military
- 8.1.3. Electric Power System
- 8.1.4. Medical
- 8.1.5. Energy/Rail Transit
- 8.2. Market Analysis, Insights and Forecast - by Types
- 8.2.1. 50/125μm
- 8.2.2. 62.5/125μm
- 8.1. Market Analysis, Insights and Forecast - by Application
- 9. Middle East & Africa Multimode Optical Fiber Analysis, Insights and Forecast, 2019-2031
- 9.1. Market Analysis, Insights and Forecast - by Application
- 9.1.1. Communication Devices
- 9.1.2. Military
- 9.1.3. Electric Power System
- 9.1.4. Medical
- 9.1.5. Energy/Rail Transit
- 9.2. Market Analysis, Insights and Forecast - by Types
- 9.2.1. 50/125μm
- 9.2.2. 62.5/125μm
- 9.1. Market Analysis, Insights and Forecast - by Application
- 10. Asia Pacific Multimode Optical Fiber Analysis, Insights and Forecast, 2019-2031
- 10.1. Market Analysis, Insights and Forecast - by Application
- 10.1.1. Communication Devices
- 10.1.2. Military
- 10.1.3. Electric Power System
- 10.1.4. Medical
- 10.1.5. Energy/Rail Transit
- 10.2. Market Analysis, Insights and Forecast - by Types
- 10.2.1. 50/125μm
- 10.2.2. 62.5/125μm
- 10.1. Market Analysis, Insights and Forecast - by Application
- 11. Competitive Analysis
- 11.1. Global Market Share Analysis 2024
- 11.2. Company Profiles
- 11.2.1 Corning
- 11.2.1.1. Overview
- 11.2.1.2. Products
- 11.2.1.3. SWOT Analysis
- 11.2.1.4. Recent Developments
- 11.2.1.5. Financials (Based on Availability)
- 11.2.2 Alcatel-Lucent
- 11.2.2.1. Overview
- 11.2.2.2. Products
- 11.2.2.3. SWOT Analysis
- 11.2.2.4. Recent Developments
- 11.2.2.5. Financials (Based on Availability)
- 11.2.3 Fujikura
- 11.2.3.1. Overview
- 11.2.3.2. Products
- 11.2.3.3. SWOT Analysis
- 11.2.3.4. Recent Developments
- 11.2.3.5. Financials (Based on Availability)
- 11.2.4 Sumitomo Electric
- 11.2.4.1. Overview
- 11.2.4.2. Products
- 11.2.4.3. SWOT Analysis
- 11.2.4.4. Recent Developments
- 11.2.4.5. Financials (Based on Availability)
- 11.2.5 Furukawa Electric
- 11.2.5.1. Overview
- 11.2.5.2. Products
- 11.2.5.3. SWOT Analysis
- 11.2.5.4. Recent Developments
- 11.2.5.5. Financials (Based on Availability)
- 11.2.6 Pirelli
- 11.2.6.1. Overview
- 11.2.6.2. Products
- 11.2.6.3. SWOT Analysis
- 11.2.6.4. Recent Developments
- 11.2.6.5. Financials (Based on Availability)
- 11.2.7 Yangtze Optical Fibre and Cable Company Ltd. (YOFC)
- 11.2.7.1. Overview
- 11.2.7.2. Products
- 11.2.7.3. SWOT Analysis
- 11.2.7.4. Recent Developments
- 11.2.7.5. Financials (Based on Availability)
- 11.2.8 Hengtong Optic-electric
- 11.2.8.1. Overview
- 11.2.8.2. Products
- 11.2.8.3. SWOT Analysis
- 11.2.8.4. Recent Developments
- 11.2.8.5. Financials (Based on Availability)
- 11.2.9 Fiber Home Technologies Group
- 11.2.9.1. Overview
- 11.2.9.2. Products
- 11.2.9.3. SWOT Analysis
- 11.2.9.4. Recent Developments
- 11.2.9.5. Financials (Based on Availability)
- 11.2.10 Futong Group
- 11.2.10.1. Overview
- 11.2.10.2. Products
- 11.2.10.3. SWOT Analysis
- 11.2.10.4. Recent Developments
- 11.2.10.5. Financials (Based on Availability)
- 11.2.11 Tongding Group
- 11.2.11.1. Overview
- 11.2.11.2. Products
- 11.2.11.3. SWOT Analysis
- 11.2.11.4. Recent Developments
- 11.2.11.5. Financials (Based on Availability)
- 11.2.12 Shenzhen Tefa Touchplus Information Corp
- 11.2.12.1. Overview
- 11.2.12.2. Products
- 11.2.12.3. SWOT Analysis
- 11.2.12.4. Recent Developments
- 11.2.12.5. Financials (Based on Availability)
- 11.2.13 Fasten Fiber optics Co.
- 11.2.13.1. Overview
- 11.2.13.2. Products
- 11.2.13.3. SWOT Analysis
- 11.2.13.4. Recent Developments
- 11.2.13.5. Financials (Based on Availability)
- 11.2.14 Ltd (FPC)
- 11.2.14.1. Overview
- 11.2.14.2. Products
- 11.2.14.3. SWOT Analysis
- 11.2.14.4. Recent Developments
- 11.2.14.5. Financials (Based on Availability)
- 11.2.1 Corning
List of Figures
- Figure 1: Global Multimode Optical Fiber Revenue Breakdown (million, %) by Region 2024 & 2032
- Figure 2: Global Multimode Optical Fiber Volume Breakdown (K, %) by Region 2024 & 2032
- Figure 3: North America Multimode Optical Fiber Revenue (million), by Application 2024 & 2032
- Figure 4: North America Multimode Optical Fiber Volume (K), by Application 2024 & 2032
- Figure 5: North America Multimode Optical Fiber Revenue Share (%), by Application 2024 & 2032
- Figure 6: North America Multimode Optical Fiber Volume Share (%), by Application 2024 & 2032
- Figure 7: North America Multimode Optical Fiber Revenue (million), by Types 2024 & 2032
- Figure 8: North America Multimode Optical Fiber Volume (K), by Types 2024 & 2032
- Figure 9: North America Multimode Optical Fiber Revenue Share (%), by Types 2024 & 2032
- Figure 10: North America Multimode Optical Fiber Volume Share (%), by Types 2024 & 2032
- Figure 11: North America Multimode Optical Fiber Revenue (million), by Country 2024 & 2032
- Figure 12: North America Multimode Optical Fiber Volume (K), by Country 2024 & 2032
- Figure 13: North America Multimode Optical Fiber Revenue Share (%), by Country 2024 & 2032
- Figure 14: North America Multimode Optical Fiber Volume Share (%), by Country 2024 & 2032
- Figure 15: South America Multimode Optical Fiber Revenue (million), by Application 2024 & 2032
- Figure 16: South America Multimode Optical Fiber Volume (K), by Application 2024 & 2032
- Figure 17: South America Multimode Optical Fiber Revenue Share (%), by Application 2024 & 2032
- Figure 18: South America Multimode Optical Fiber Volume Share (%), by Application 2024 & 2032
- Figure 19: South America Multimode Optical Fiber Revenue (million), by Types 2024 & 2032
- Figure 20: South America Multimode Optical Fiber Volume (K), by Types 2024 & 2032
- Figure 21: South America Multimode Optical Fiber Revenue Share (%), by Types 2024 & 2032
- Figure 22: South America Multimode Optical Fiber Volume Share (%), by Types 2024 & 2032
- Figure 23: South America Multimode Optical Fiber Revenue (million), by Country 2024 & 2032
- Figure 24: South America Multimode Optical Fiber Volume (K), by Country 2024 & 2032
- Figure 25: South America Multimode Optical Fiber Revenue Share (%), by Country 2024 & 2032
- Figure 26: South America Multimode Optical Fiber Volume Share (%), by Country 2024 & 2032
- Figure 27: Europe Multimode Optical Fiber Revenue (million), by Application 2024 & 2032
- Figure 28: Europe Multimode Optical Fiber Volume (K), by Application 2024 & 2032
- Figure 29: Europe Multimode Optical Fiber Revenue Share (%), by Application 2024 & 2032
- Figure 30: Europe Multimode Optical Fiber Volume Share (%), by Application 2024 & 2032
- Figure 31: Europe Multimode Optical Fiber Revenue (million), by Types 2024 & 2032
- Figure 32: Europe Multimode Optical Fiber Volume (K), by Types 2024 & 2032
- Figure 33: Europe Multimode Optical Fiber Revenue Share (%), by Types 2024 & 2032
- Figure 34: Europe Multimode Optical Fiber Volume Share (%), by Types 2024 & 2032
- Figure 35: Europe Multimode Optical Fiber Revenue (million), by Country 2024 & 2032
- Figure 36: Europe Multimode Optical Fiber Volume (K), by Country 2024 & 2032
- Figure 37: Europe Multimode Optical Fiber Revenue Share (%), by Country 2024 & 2032
- Figure 38: Europe Multimode Optical Fiber Volume Share (%), by Country 2024 & 2032
- Figure 39: Middle East & Africa Multimode Optical Fiber Revenue (million), by Application 2024 & 2032
- Figure 40: Middle East & Africa Multimode Optical Fiber Volume (K), by Application 2024 & 2032
- Figure 41: Middle East & Africa Multimode Optical Fiber Revenue Share (%), by Application 2024 & 2032
- Figure 42: Middle East & Africa Multimode Optical Fiber Volume Share (%), by Application 2024 & 2032
- Figure 43: Middle East & Africa Multimode Optical Fiber Revenue (million), by Types 2024 & 2032
- Figure 44: Middle East & Africa Multimode Optical Fiber Volume (K), by Types 2024 & 2032
- Figure 45: Middle East & Africa Multimode Optical Fiber Revenue Share (%), by Types 2024 & 2032
- Figure 46: Middle East & Africa Multimode Optical Fiber Volume Share (%), by Types 2024 & 2032
- Figure 47: Middle East & Africa Multimode Optical Fiber Revenue (million), by Country 2024 & 2032
- Figure 48: Middle East & Africa Multimode Optical Fiber Volume (K), by Country 2024 & 2032
- Figure 49: Middle East & Africa Multimode Optical Fiber Revenue Share (%), by Country 2024 & 2032
- Figure 50: Middle East & Africa Multimode Optical Fiber Volume Share (%), by Country 2024 & 2032
- Figure 51: Asia Pacific Multimode Optical Fiber Revenue (million), by Application 2024 & 2032
- Figure 52: Asia Pacific Multimode Optical Fiber Volume (K), by Application 2024 & 2032
- Figure 53: Asia Pacific Multimode Optical Fiber Revenue Share (%), by Application 2024 & 2032
- Figure 54: Asia Pacific Multimode Optical Fiber Volume Share (%), by Application 2024 & 2032
- Figure 55: Asia Pacific Multimode Optical Fiber Revenue (million), by Types 2024 & 2032
- Figure 56: Asia Pacific Multimode Optical Fiber Volume (K), by Types 2024 & 2032
- Figure 57: Asia Pacific Multimode Optical Fiber Revenue Share (%), by Types 2024 & 2032
- Figure 58: Asia Pacific Multimode Optical Fiber Volume Share (%), by Types 2024 & 2032
- Figure 59: Asia Pacific Multimode Optical Fiber Revenue (million), by Country 2024 & 2032
- Figure 60: Asia Pacific Multimode Optical Fiber Volume (K), by Country 2024 & 2032
- Figure 61: Asia Pacific Multimode Optical Fiber Revenue Share (%), by Country 2024 & 2032
- Figure 62: Asia Pacific Multimode Optical Fiber Volume Share (%), by Country 2024 & 2032
List of Tables
- Table 1: Global Multimode Optical Fiber Revenue million Forecast, by Region 2019 & 2032
- Table 2: Global Multimode Optical Fiber Volume K Forecast, by Region 2019 & 2032
- Table 3: Global Multimode Optical Fiber Revenue million Forecast, by Application 2019 & 2032
- Table 4: Global Multimode Optical Fiber Volume K Forecast, by Application 2019 & 2032
- Table 5: Global Multimode Optical Fiber Revenue million Forecast, by Types 2019 & 2032
- Table 6: Global Multimode Optical Fiber Volume K Forecast, by Types 2019 & 2032
- Table 7: Global Multimode Optical Fiber Revenue million Forecast, by Region 2019 & 2032
- Table 8: Global Multimode Optical Fiber Volume K Forecast, by Region 2019 & 2032
- Table 9: Global Multimode Optical Fiber Revenue million Forecast, by Application 2019 & 2032
- Table 10: Global Multimode Optical Fiber Volume K Forecast, by Application 2019 & 2032
- Table 11: Global Multimode Optical Fiber Revenue million Forecast, by Types 2019 & 2032
- Table 12: Global Multimode Optical Fiber Volume K Forecast, by Types 2019 & 2032
- Table 13: Global Multimode Optical Fiber Revenue million Forecast, by Country 2019 & 2032
- Table 14: Global Multimode Optical Fiber Volume K Forecast, by Country 2019 & 2032
- Table 15: United States Multimode Optical Fiber Revenue (million) Forecast, by Application 2019 & 2032
- Table 16: United States Multimode Optical Fiber Volume (K) Forecast, by Application 2019 & 2032
- Table 17: Canada Multimode Optical Fiber Revenue (million) Forecast, by Application 2019 & 2032
- Table 18: Canada Multimode Optical Fiber Volume (K) Forecast, by Application 2019 & 2032
- Table 19: Mexico Multimode Optical Fiber Revenue (million) Forecast, by Application 2019 & 2032
- Table 20: Mexico Multimode Optical Fiber Volume (K) Forecast, by Application 2019 & 2032
- Table 21: Global Multimode Optical Fiber Revenue million Forecast, by Application 2019 & 2032
- Table 22: Global Multimode Optical Fiber Volume K Forecast, by Application 2019 & 2032
- Table 23: Global Multimode Optical Fiber Revenue million Forecast, by Types 2019 & 2032
- Table 24: Global Multimode Optical Fiber Volume K Forecast, by Types 2019 & 2032
- Table 25: Global Multimode Optical Fiber Revenue million Forecast, by Country 2019 & 2032
- Table 26: Global Multimode Optical Fiber Volume K Forecast, by Country 2019 & 2032
- Table 27: Brazil Multimode Optical Fiber Revenue (million) Forecast, by Application 2019 & 2032
- Table 28: Brazil Multimode Optical Fiber Volume (K) Forecast, by Application 2019 & 2032
- Table 29: Argentina Multimode Optical Fiber Revenue (million) Forecast, by Application 2019 & 2032
- Table 30: Argentina Multimode Optical Fiber Volume (K) Forecast, by Application 2019 & 2032
- Table 31: Rest of South America Multimode Optical Fiber Revenue (million) Forecast, by Application 2019 & 2032
- Table 32: Rest of South America Multimode Optical Fiber Volume (K) Forecast, by Application 2019 & 2032
- Table 33: Global Multimode Optical Fiber Revenue million Forecast, by Application 2019 & 2032
- Table 34: Global Multimode Optical Fiber Volume K Forecast, by Application 2019 & 2032
- Table 35: Global Multimode Optical Fiber Revenue million Forecast, by Types 2019 & 2032
- Table 36: Global Multimode Optical Fiber Volume K Forecast, by Types 2019 & 2032
- Table 37: Global Multimode Optical Fiber Revenue million Forecast, by Country 2019 & 2032
- Table 38: Global Multimode Optical Fiber Volume K Forecast, by Country 2019 & 2032
- Table 39: United Kingdom Multimode Optical Fiber Revenue (million) Forecast, by Application 2019 & 2032
- Table 40: United Kingdom Multimode Optical Fiber Volume (K) Forecast, by Application 2019 & 2032
- Table 41: Germany Multimode Optical Fiber Revenue (million) Forecast, by Application 2019 & 2032
- Table 42: Germany Multimode Optical Fiber Volume (K) Forecast, by Application 2019 & 2032
- Table 43: France Multimode Optical Fiber Revenue (million) Forecast, by Application 2019 & 2032
- Table 44: France Multimode Optical Fiber Volume (K) Forecast, by Application 2019 & 2032
- Table 45: Italy Multimode Optical Fiber Revenue (million) Forecast, by Application 2019 & 2032
- Table 46: Italy Multimode Optical Fiber Volume (K) Forecast, by Application 2019 & 2032
- Table 47: Spain Multimode Optical Fiber Revenue (million) Forecast, by Application 2019 & 2032
- Table 48: Spain Multimode Optical Fiber Volume (K) Forecast, by Application 2019 & 2032
- Table 49: Russia Multimode Optical Fiber Revenue (million) Forecast, by Application 2019 & 2032
- Table 50: Russia Multimode Optical Fiber Volume (K) Forecast, by Application 2019 & 2032
- Table 51: Benelux Multimode Optical Fiber Revenue (million) Forecast, by Application 2019 & 2032
- Table 52: Benelux Multimode Optical Fiber Volume (K) Forecast, by Application 2019 & 2032
- Table 53: Nordics Multimode Optical Fiber Revenue (million) Forecast, by Application 2019 & 2032
- Table 54: Nordics Multimode Optical Fiber Volume (K) Forecast, by Application 2019 & 2032
- Table 55: Rest of Europe Multimode Optical Fiber Revenue (million) Forecast, by Application 2019 & 2032
- Table 56: Rest of Europe Multimode Optical Fiber Volume (K) Forecast, by Application 2019 & 2032
- Table 57: Global Multimode Optical Fiber Revenue million Forecast, by Application 2019 & 2032
- Table 58: Global Multimode Optical Fiber Volume K Forecast, by Application 2019 & 2032
- Table 59: Global Multimode Optical Fiber Revenue million Forecast, by Types 2019 & 2032
- Table 60: Global Multimode Optical Fiber Volume K Forecast, by Types 2019 & 2032
- Table 61: Global Multimode Optical Fiber Revenue million Forecast, by Country 2019 & 2032
- Table 62: Global Multimode Optical Fiber Volume K Forecast, by Country 2019 & 2032
- Table 63: Turkey Multimode Optical Fiber Revenue (million) Forecast, by Application 2019 & 2032
- Table 64: Turkey Multimode Optical Fiber Volume (K) Forecast, by Application 2019 & 2032
- Table 65: Israel Multimode Optical Fiber Revenue (million) Forecast, by Application 2019 & 2032
- Table 66: Israel Multimode Optical Fiber Volume (K) Forecast, by Application 2019 & 2032
- Table 67: GCC Multimode Optical Fiber Revenue (million) Forecast, by Application 2019 & 2032
- Table 68: GCC Multimode Optical Fiber Volume (K) Forecast, by Application 2019 & 2032
- Table 69: North Africa Multimode Optical Fiber Revenue (million) Forecast, by Application 2019 & 2032
- Table 70: North Africa Multimode Optical Fiber Volume (K) Forecast, by Application 2019 & 2032
- Table 71: South Africa Multimode Optical Fiber Revenue (million) Forecast, by Application 2019 & 2032
- Table 72: South Africa Multimode Optical Fiber Volume (K) Forecast, by Application 2019 & 2032
- Table 73: Rest of Middle East & Africa Multimode Optical Fiber Revenue (million) Forecast, by Application 2019 & 2032
- Table 74: Rest of Middle East & Africa Multimode Optical Fiber Volume (K) Forecast, by Application 2019 & 2032
- Table 75: Global Multimode Optical Fiber Revenue million Forecast, by Application 2019 & 2032
- Table 76: Global Multimode Optical Fiber Volume K Forecast, by Application 2019 & 2032
- Table 77: Global Multimode Optical Fiber Revenue million Forecast, by Types 2019 & 2032
- Table 78: Global Multimode Optical Fiber Volume K Forecast, by Types 2019 & 2032
- Table 79: Global Multimode Optical Fiber Revenue million Forecast, by Country 2019 & 2032
- Table 80: Global Multimode Optical Fiber Volume K Forecast, by Country 2019 & 2032
- Table 81: China Multimode Optical Fiber Revenue (million) Forecast, by Application 2019 & 2032
- Table 82: China Multimode Optical Fiber Volume (K) Forecast, by Application 2019 & 2032
- Table 83: India Multimode Optical Fiber Revenue (million) Forecast, by Application 2019 & 2032
- Table 84: India Multimode Optical Fiber Volume (K) Forecast, by Application 2019 & 2032
- Table 85: Japan Multimode Optical Fiber Revenue (million) Forecast, by Application 2019 & 2032
- Table 86: Japan Multimode Optical Fiber Volume (K) Forecast, by Application 2019 & 2032
- Table 87: South Korea Multimode Optical Fiber Revenue (million) Forecast, by Application 2019 & 2032
- Table 88: South Korea Multimode Optical Fiber Volume (K) Forecast, by Application 2019 & 2032
- Table 89: ASEAN Multimode Optical Fiber Revenue (million) Forecast, by Application 2019 & 2032
- Table 90: ASEAN Multimode Optical Fiber Volume (K) Forecast, by Application 2019 & 2032
- Table 91: Oceania Multimode Optical Fiber Revenue (million) Forecast, by Application 2019 & 2032
- Table 92: Oceania Multimode Optical Fiber Volume (K) Forecast, by Application 2019 & 2032
- Table 93: Rest of Asia Pacific Multimode Optical Fiber Revenue (million) Forecast, by Application 2019 & 2032
- Table 94: Rest of Asia Pacific Multimode Optical Fiber Volume (K) Forecast, by Application 2019 & 2032
Frequently Asked Questions
1. What is the projected Compound Annual Growth Rate (CAGR) of the Multimode Optical Fiber?
The projected CAGR is approximately XX%.
2. Which companies are prominent players in the Multimode Optical Fiber?
Key companies in the market include Corning, Alcatel-Lucent, Fujikura, Sumitomo Electric, Furukawa Electric, Pirelli, Yangtze Optical Fibre and Cable Company Ltd. (YOFC), Hengtong Optic-electric, Fiber Home Technologies Group, Futong Group, Tongding Group, Shenzhen Tefa Touchplus Information Corp, Fasten Fiber optics Co., Ltd (FPC).
3. What are the main segments of the Multimode Optical Fiber?
The market segments include Application, Types.
4. Can you provide details about the market size?
The market size is estimated to be USD XXX million as of 2022.
5. What are some drivers contributing to market growth?
N/A
6. What are the notable trends driving market growth?
N/A
7. Are there any restraints impacting market growth?
N/A
8. Can you provide examples of recent developments in the market?
N/A
9. What pricing options are available for accessing the report?
Pricing options include single-user, multi-user, and enterprise licenses priced at USD 3350.00, USD 5025.00, and USD 6700.00 respectively.
10. Is the market size provided in terms of value or volume?
The market size is provided in terms of value, measured in million and volume, measured in K.
11. Are there any specific market keywords associated with the report?
Yes, the market keyword associated with the report is "Multimode Optical Fiber," which aids in identifying and referencing the specific market segment covered.
12. How do I determine which pricing option suits my needs best?
The pricing options vary based on user requirements and access needs. Individual users may opt for single-user licenses, while businesses requiring broader access may choose multi-user or enterprise licenses for cost-effective access to the report.
13. Are there any additional resources or data provided in the Multimode Optical Fiber report?
While the report offers comprehensive insights, it's advisable to review the specific contents or supplementary materials provided to ascertain if additional resources or data are available.
14. How can I stay updated on further developments or reports in the Multimode Optical Fiber?
To stay informed about further developments, trends, and reports in the Multimode Optical Fiber, consider subscribing to industry newsletters, following relevant companies and organizations, or regularly checking reputable industry news sources and publications.
Methodology
Step 1 - Identification of Relevant Samples Size from Population Database


Step 2 - Approaches for Defining Global Market Size (Value, Volume* & Price*)

Note*: In applicable scenarios
Step 3 - Data Sources
Primary Research
- Web Analytics
- Survey Reports
- Research Institute
- Latest Research Reports
- Opinion Leaders
Secondary Research
- Annual Reports
- White Paper
- Latest Press Release
- Industry Association
- Paid Database
- Investor Presentations

Step 4 - Data Triangulation
Involves using different sources of information in order to increase the validity of a study
These sources are likely to be stakeholders in a program - participants, other researchers, program staff, other community members, and so on.
Then we put all data in single framework & apply various statistical tools to find out the dynamic on the market.
During the analysis stage, feedback from the stakeholder groups would be compared to determine areas of agreement as well as areas of divergence


