
Key Insights
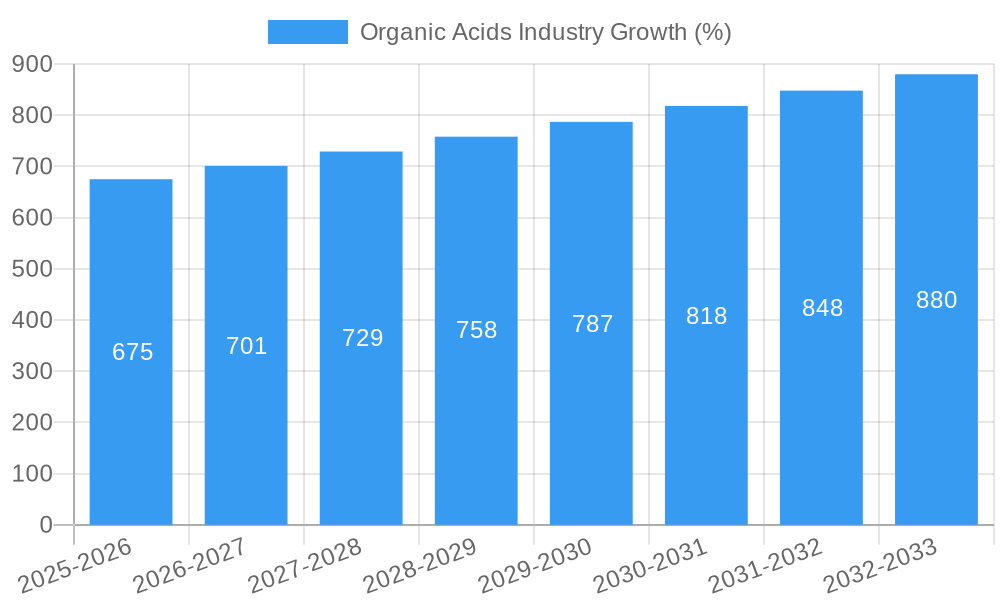
The global organic acids market, valued at approximately $XX million in 2025, is projected to experience robust growth, exhibiting a Compound Annual Growth Rate (CAGR) of 4.50% from 2025 to 2033. This expansion is fueled by several key drivers. The increasing demand for organic and natural food preservatives in the food and beverage industry significantly contributes to market growth. Furthermore, the rising adoption of organic acids in animal feed to improve animal health and productivity is a major catalyst. The pharmaceutical industry's utilization of organic acids in drug formulations and as excipients further boosts market demand. Expanding applications in various other sectors, including cosmetics and cleaning products, also contribute to overall market expansion. Growth is further supported by the increasing consumer awareness of health and wellness, leading to a preference for naturally derived ingredients.
However, market growth faces certain restraints. Fluctuations in raw material prices, especially agricultural commodities, can impact production costs and profitability. Strict regulatory frameworks and stringent quality control measures for organic acids used in food and pharmaceutical applications pose challenges for manufacturers. Furthermore, the presence of numerous substitute ingredients and the competition from synthetic acids can impede market growth. Despite these constraints, the market is expected to witness substantial growth across key segments. The food and beverage segment is projected to maintain its dominant position, followed by the animal feed and pharmaceutical sectors. Among the various types, acetic acid, citric acid, and lactic acid are expected to hold significant market shares, driven by their wide range of applications and established market presence. Geographically, North America and Europe are expected to dominate the market in the forecast period, but Asia-Pacific is expected to witness the fastest growth due to increasing food processing and industrial activity. Key players like Cargill, ADM, Tate & Lyle, BASF, DSM, and DuPont are expected to drive innovation and consolidate their market positions through strategic partnerships and product diversification.
Organic Acids Industry Market Report: 2019-2033
This comprehensive report provides an in-depth analysis of the global organic acids market, offering invaluable insights for industry professionals, investors, and strategic decision-makers. The report covers the period from 2019 to 2033, with a focus on the estimated year 2025 and a forecast period spanning 2025-2033. Key players like Cargill Incorporated, Archer Daniels Midland Company, Tate & Lyle PLC, BASF SE, Koninklijke DSM N.V., DuPont, and Eastman Chemical Company are analyzed, alongside market segmentation by application (Food & Beverage, Animal Feed, Pharmaceuticals, Others) and type (Acetic acid, Citric acid, Lactic acid, Others). The report's market size estimations are in Millions.

Organic Acids Industry Market Structure & Innovation Trends
This section analyzes the competitive landscape, highlighting market concentration, innovation drivers, and regulatory influences within the organic acids industry. The report delves into M&A activities, examining deal values and their impact on market share distribution. The xx% market share held by the top 5 players demonstrates industry consolidation. Innovation is driven by the need for sustainable production methods, with significant investments in R&D focused on improving fermentation technologies and reducing environmental impact. Stringent regulatory frameworks regarding food safety and environmental protection also shape industry practices. Product substitutes, like synthetic acids, pose a competitive threat, yet the increasing demand for natural and organic products continues to fuel the growth of the organic acids market. The report further examines end-user demographics and their evolving preferences, providing a comprehensive view of market structure and dynamics. Major M&A deals are detailed, with an estimated xx Million in total deal value in the analyzed period.
Organic Acids Industry Market Dynamics & Trends
The global organic acids market is experiencing robust growth, driven by factors such as the increasing demand for natural food preservatives and additives in the food and beverage sector. The rising consumption of processed foods and the growing animal feed industry contribute significantly to market expansion. Technological advancements, particularly in fermentation processes, are enhancing production efficiency and reducing costs. This contributes to a Compound Annual Growth Rate (CAGR) of xx% during the forecast period. Consumer preferences for health-conscious products, and increasing awareness of the benefits of organic acids in various applications, are also driving market growth. Competitive dynamics are shaping the market through product innovation, capacity expansion, and strategic alliances. Market penetration in emerging economies remains significant, offering immense growth potential.
Dominant Regions & Segments in Organic Acids Industry
This section identifies the leading regions and segments within the organic acids market. The Asia-Pacific region is currently the dominant market, driven by factors such as:
- Rapid economic growth and rising disposable incomes.
- Expanding food and beverage industry.
- Increasing demand for animal feed.
- Favorable government policies promoting the food processing sector.
Within applications, the Food & Beverage segment holds the largest market share, followed by the Animal Feed segment. Within types, Acetic Acid holds the highest volume, followed by Citric Acid and Lactic Acid. The report provides a detailed analysis of each segment's growth drivers, market size, and competitive landscape. Europe and North America also maintain significant market shares, driven by established industries and high consumer demand for organic and natural products. The dominance of these regions and segments is analyzed in detail, examining market size and growth projections.
Organic Acids Industry Product Innovations
Recent product innovations focus on enhancing the purity and efficiency of organic acid production through improved fermentation technologies and process optimization. New applications are emerging in the pharmaceuticals and biomaterials sectors. Companies are focusing on developing sustainable and environmentally friendly production methods to meet growing consumer demand for green and ethically sourced products. This aligns with the overall shift towards sustainability in various industries.
Report Scope & Segmentation Analysis
This report provides a comprehensive analysis of the organic acids market, segmented by application (Food & Beverage, Animal Feed, Pharmaceuticals, Cosmetics, and others) and type (Acetic acid, Citric acid, Lactic acid, Malic acid, Fumaric acid, and others). Each segment is meticulously analyzed, offering granular insights into market size, growth projections, CAGR, and competitive dynamics. The Food & Beverage segment, for instance, is poised for substantial growth driven by the escalating demand for natural preservatives, flavor enhancers, and clean-label ingredients. Similarly, the increasing use of acetic acid in various industries contributes to its robust market share. The report projects a market size of [Insert Precise Figure] Million USD for the Food & Beverage segment by 2033, representing a CAGR of [Insert CAGR Percentage]%. Detailed regional breakdowns are also included, offering a nuanced understanding of market performance across different geographical areas.
Key Drivers of Organic Acids Industry Growth
The organic acids market is driven by several factors, including the increasing demand for natural food preservatives and additives, the growth of the animal feed industry, and advancements in fermentation technology. Government regulations promoting the use of natural ingredients also contribute to market growth. The rising health consciousness among consumers further boosts demand for organic acids. The expanding pharmaceutical sector, with its requirement for organic acids in the production of various drugs, adds to the industry’s expansion.
Challenges in the Organic Acids Industry Sector
The organic acids industry navigates several key challenges. Fluctuations in raw material prices (e.g., corn, sugarcane) and supply chain disruptions, exacerbated by geopolitical instability and climate change, significantly impact production costs and profitability. Stringent regulatory compliance requirements concerning food safety, environmental protection (e.g., waste management), and worker safety add to operational complexities and costs. Intense competition from synthetic acids and bio-based alternatives necessitates continuous innovation and cost optimization strategies. Furthermore, the growing emphasis on sustainability and ethical sourcing places additional pressure on manufacturers to adopt environmentally friendly practices. These challenges have resulted in an estimated [Insert Precise Figure]% decline in profitability for certain segments during specific periods within the study timeframe.
Emerging Opportunities in Organic Acids Industry
Despite the challenges, significant growth opportunities exist for the organic acids industry. The expanding bioplastics and biofuels sectors represent promising new application areas for organic acids. The surging global demand for sustainable and eco-friendly products creates a favorable market environment. Expansion into untapped geographical markets, particularly in rapidly developing economies, offers considerable potential for growth. Technological advancements in fermentation processes, including precision fermentation and metabolic engineering, are enabling improved efficiency, reduced production costs, and the development of novel organic acid derivatives. Furthermore, the increasing focus on personalized nutrition and functional foods is driving demand for specific organic acids with health-promoting properties.
Leading Players in the Organic Acids Industry Market
- Cargill Incorporated
- Archer Daniels Midland Company
- Tate & Lyle PLC
- BASF SE
- Koninklijke DSM N.V.
- DuPont
- Eastman Chemical Company
- Jungbunzlauer
Key Developments in Organic Acids Industry
- 2022 Q4: Cargill invests in a new acetic acid production facility in China, enhancing its production capacity and market reach in the Asia-Pacific region.
- 2023 Q1: ADM expands its citric acid production capacity in Europe, responding to the growing demand for citric acid in the food and beverage industry.
- 2023 Q2: DSM launches a new lactic acid fermentation technology, improving production efficiency and reducing environmental impact.
- 2024 Q1: Tate & Lyle acquires a leading organic acid manufacturer, strengthening its position in the market and expanding its product portfolio.
- [Add another recent development with details]
Future Outlook for Organic Acids Industry Market
The organic acids market is poised for continued growth, driven by increasing demand from various sectors and technological advancements. Strategic partnerships and collaborations among key players are expected to shape the future market landscape. The growing focus on sustainability and the development of innovative applications will drive further expansion. The market is expected to show a positive growth trajectory for the foreseeable future, with significant expansion anticipated in emerging markets.
Organic Acids Industry Segmentation
-
1. Type
- 1.1. Acetic acid
- 1.2. Citric acid
- 1.3. Lactic acid
- 1.4. Others
-
2. Application
- 2.1. Food & Beverage
- 2.2. Animal Feed
- 2.3. Pharmaceuticals
- 2.4. Others
Organic Acids Industry Segmentation By Geography
-
1. North America
- 1.1. United States
- 1.2. Canada
- 1.3. Mexico
- 1.4. Rest of North America
-
2. Europe
- 2.1. United Kingdom
- 2.2. Germany
- 2.3. France
- 2.4. Russia
- 2.5. Italy
- 2.6. Spain
- 2.7. Rest of Europe
-
3. Asia Pacific
- 3.1. India
- 3.2. China
- 3.3. Japan
- 3.4. Australia
- 3.5. Rest of Asia Pacific
-
4. South America
- 4.1. Brazil
- 4.2. Argentina
- 4.3. Rest of South America
- 5. Middle East
-
6. South Africa
- 6.1. Saudi Arabia
- 6.2. Rest of Middle East

Organic Acids Industry REPORT HIGHLIGHTS
| Aspects | Details |
|---|---|
| Study Period | 2019-2033 |
| Base Year | 2024 |
| Estimated Year | 2025 |
| Forecast Period | 2025-2033 |
| Historical Period | 2019-2024 |
| Growth Rate | CAGR of 4.50% from 2019-2033 |
| Segmentation |
|
Table of Contents
- 1. Introduction
- 1.1. Research Scope
- 1.2. Market Segmentation
- 1.3. Research Methodology
- 1.4. Definitions and Assumptions
- 2. Executive Summary
- 2.1. Introduction
- 3. Market Dynamics
- 3.1. Introduction
- 3.2. Market Drivers
- 3.2.1. Increasing Demand for Low-Fat and Low-Calorie Food; Increasing Product Innovation
- 3.3. Market Restrains
- 3.3.1. ; Threat of New Entrants; Bargaining Power of Buyers/Consumers; Bargaining Power of Suppliers; Threat of Substitute Products; Degree Of Competition
- 3.4. Market Trends
- 3.4.1. Rising Demand of Citric Acid in Food and Beverage Industries
- 4. Market Factor Analysis
- 4.1. Porters Five Forces
- 4.2. Supply/Value Chain
- 4.3. PESTEL analysis
- 4.4. Market Entropy
- 4.5. Patent/Trademark Analysis
- 5. Global Organic Acids Industry Analysis, Insights and Forecast, 2019-2031
- 5.1. Market Analysis, Insights and Forecast - by Type
- 5.1.1. Acetic acid
- 5.1.2. Citric acid
- 5.1.3. Lactic acid
- 5.1.4. Others
- 5.2. Market Analysis, Insights and Forecast - by Application
- 5.2.1. Food & Beverage
- 5.2.2. Animal Feed
- 5.2.3. Pharmaceuticals
- 5.2.4. Others
- 5.3. Market Analysis, Insights and Forecast - by Region
- 5.3.1. North America
- 5.3.2. Europe
- 5.3.3. Asia Pacific
- 5.3.4. South America
- 5.3.5. Middle East
- 5.3.6. South Africa
- 5.1. Market Analysis, Insights and Forecast - by Type
- 6. North America Organic Acids Industry Analysis, Insights and Forecast, 2019-2031
- 6.1. Market Analysis, Insights and Forecast - by Type
- 6.1.1. Acetic acid
- 6.1.2. Citric acid
- 6.1.3. Lactic acid
- 6.1.4. Others
- 6.2. Market Analysis, Insights and Forecast - by Application
- 6.2.1. Food & Beverage
- 6.2.2. Animal Feed
- 6.2.3. Pharmaceuticals
- 6.2.4. Others
- 6.1. Market Analysis, Insights and Forecast - by Type
- 7. Europe Organic Acids Industry Analysis, Insights and Forecast, 2019-2031
- 7.1. Market Analysis, Insights and Forecast - by Type
- 7.1.1. Acetic acid
- 7.1.2. Citric acid
- 7.1.3. Lactic acid
- 7.1.4. Others
- 7.2. Market Analysis, Insights and Forecast - by Application
- 7.2.1. Food & Beverage
- 7.2.2. Animal Feed
- 7.2.3. Pharmaceuticals
- 7.2.4. Others
- 7.1. Market Analysis, Insights and Forecast - by Type
- 8. Asia Pacific Organic Acids Industry Analysis, Insights and Forecast, 2019-2031
- 8.1. Market Analysis, Insights and Forecast - by Type
- 8.1.1. Acetic acid
- 8.1.2. Citric acid
- 8.1.3. Lactic acid
- 8.1.4. Others
- 8.2. Market Analysis, Insights and Forecast - by Application
- 8.2.1. Food & Beverage
- 8.2.2. Animal Feed
- 8.2.3. Pharmaceuticals
- 8.2.4. Others
- 8.1. Market Analysis, Insights and Forecast - by Type
- 9. South America Organic Acids Industry Analysis, Insights and Forecast, 2019-2031
- 9.1. Market Analysis, Insights and Forecast - by Type
- 9.1.1. Acetic acid
- 9.1.2. Citric acid
- 9.1.3. Lactic acid
- 9.1.4. Others
- 9.2. Market Analysis, Insights and Forecast - by Application
- 9.2.1. Food & Beverage
- 9.2.2. Animal Feed
- 9.2.3. Pharmaceuticals
- 9.2.4. Others
- 9.1. Market Analysis, Insights and Forecast - by Type
- 10. Middle East Organic Acids Industry Analysis, Insights and Forecast, 2019-2031
- 10.1. Market Analysis, Insights and Forecast - by Type
- 10.1.1. Acetic acid
- 10.1.2. Citric acid
- 10.1.3. Lactic acid
- 10.1.4. Others
- 10.2. Market Analysis, Insights and Forecast - by Application
- 10.2.1. Food & Beverage
- 10.2.2. Animal Feed
- 10.2.3. Pharmaceuticals
- 10.2.4. Others
- 10.1. Market Analysis, Insights and Forecast - by Type
- 11. South Africa Organic Acids Industry Analysis, Insights and Forecast, 2019-2031
- 11.1. Market Analysis, Insights and Forecast - by Type
- 11.1.1. Acetic acid
- 11.1.2. Citric acid
- 11.1.3. Lactic acid
- 11.1.4. Others
- 11.2. Market Analysis, Insights and Forecast - by Application
- 11.2.1. Food & Beverage
- 11.2.2. Animal Feed
- 11.2.3. Pharmaceuticals
- 11.2.4. Others
- 11.1. Market Analysis, Insights and Forecast - by Type
- 12. North America Organic Acids Industry Analysis, Insights and Forecast, 2019-2031
- 12.1. Market Analysis, Insights and Forecast - By Country/Sub-region
- 12.1.1 United States
- 12.1.2 Canada
- 12.1.3 Mexico
- 12.1.4 Rest of North America
- 13. Europe Organic Acids Industry Analysis, Insights and Forecast, 2019-2031
- 13.1. Market Analysis, Insights and Forecast - By Country/Sub-region
- 13.1.1 United Kingdom
- 13.1.2 Germany
- 13.1.3 France
- 13.1.4 Russia
- 13.1.5 Italy
- 13.1.6 Spain
- 13.1.7 Rest of Europe
- 14. Asia Pacific Organic Acids Industry Analysis, Insights and Forecast, 2019-2031
- 14.1. Market Analysis, Insights and Forecast - By Country/Sub-region
- 14.1.1 India
- 14.1.2 China
- 14.1.3 Japan
- 14.1.4 Australia
- 14.1.5 Rest of Asia Pacific
- 15. South America Organic Acids Industry Analysis, Insights and Forecast, 2019-2031
- 15.1. Market Analysis, Insights and Forecast - By Country/Sub-region
- 15.1.1 Brazil
- 15.1.2 Argentina
- 15.1.3 Rest of South America
- 16. South Africa Organic Acids Industry Analysis, Insights and Forecast, 2019-2031
- 16.1. Market Analysis, Insights and Forecast - By Country/Sub-region
- 16.1.1 Saudi Arabia
- 16.1.2 Rest of Middle East
- 17. Competitive Analysis
- 17.1. Global Market Share Analysis 2024
- 17.2. Company Profiles
- 17.2.1 Cargill Incorporated
- 17.2.1.1. Overview
- 17.2.1.2. Products
- 17.2.1.3. SWOT Analysis
- 17.2.1.4. Recent Developments
- 17.2.1.5. Financials (Based on Availability)
- 17.2.2 Archer Daniels Midland Company
- 17.2.2.1. Overview
- 17.2.2.2. Products
- 17.2.2.3. SWOT Analysis
- 17.2.2.4. Recent Developments
- 17.2.2.5. Financials (Based on Availability)
- 17.2.3 Tate & Lyle PLC
- 17.2.3.1. Overview
- 17.2.3.2. Products
- 17.2.3.3. SWOT Analysis
- 17.2.3.4. Recent Developments
- 17.2.3.5. Financials (Based on Availability)
- 17.2.4 BASF SE
- 17.2.4.1. Overview
- 17.2.4.2. Products
- 17.2.4.3. SWOT Analysis
- 17.2.4.4. Recent Developments
- 17.2.4.5. Financials (Based on Availability)
- 17.2.5 Koninklijke DSM N V
- 17.2.5.1. Overview
- 17.2.5.2. Products
- 17.2.5.3. SWOT Analysis
- 17.2.5.4. Recent Developments
- 17.2.5.5. Financials (Based on Availability)
- 17.2.6 DuPont*List Not Exhaustive
- 17.2.6.1. Overview
- 17.2.6.2. Products
- 17.2.6.3. SWOT Analysis
- 17.2.6.4. Recent Developments
- 17.2.6.5. Financials (Based on Availability)
- 17.2.7 Eastman Chemical Company
- 17.2.7.1. Overview
- 17.2.7.2. Products
- 17.2.7.3. SWOT Analysis
- 17.2.7.4. Recent Developments
- 17.2.7.5. Financials (Based on Availability)
- 17.2.1 Cargill Incorporated
List of Figures
- Figure 1: Global Organic Acids Industry Revenue Breakdown (Million, %) by Region 2024 & 2032
- Figure 2: North America Organic Acids Industry Revenue (Million), by Country 2024 & 2032
- Figure 3: North America Organic Acids Industry Revenue Share (%), by Country 2024 & 2032
- Figure 4: Europe Organic Acids Industry Revenue (Million), by Country 2024 & 2032
- Figure 5: Europe Organic Acids Industry Revenue Share (%), by Country 2024 & 2032
- Figure 6: Asia Pacific Organic Acids Industry Revenue (Million), by Country 2024 & 2032
- Figure 7: Asia Pacific Organic Acids Industry Revenue Share (%), by Country 2024 & 2032
- Figure 8: South America Organic Acids Industry Revenue (Million), by Country 2024 & 2032
- Figure 9: South America Organic Acids Industry Revenue Share (%), by Country 2024 & 2032
- Figure 10: South Africa Organic Acids Industry Revenue (Million), by Country 2024 & 2032
- Figure 11: South Africa Organic Acids Industry Revenue Share (%), by Country 2024 & 2032
- Figure 12: North America Organic Acids Industry Revenue (Million), by Type 2024 & 2032
- Figure 13: North America Organic Acids Industry Revenue Share (%), by Type 2024 & 2032
- Figure 14: North America Organic Acids Industry Revenue (Million), by Application 2024 & 2032
- Figure 15: North America Organic Acids Industry Revenue Share (%), by Application 2024 & 2032
- Figure 16: North America Organic Acids Industry Revenue (Million), by Country 2024 & 2032
- Figure 17: North America Organic Acids Industry Revenue Share (%), by Country 2024 & 2032
- Figure 18: Europe Organic Acids Industry Revenue (Million), by Type 2024 & 2032
- Figure 19: Europe Organic Acids Industry Revenue Share (%), by Type 2024 & 2032
- Figure 20: Europe Organic Acids Industry Revenue (Million), by Application 2024 & 2032
- Figure 21: Europe Organic Acids Industry Revenue Share (%), by Application 2024 & 2032
- Figure 22: Europe Organic Acids Industry Revenue (Million), by Country 2024 & 2032
- Figure 23: Europe Organic Acids Industry Revenue Share (%), by Country 2024 & 2032
- Figure 24: Asia Pacific Organic Acids Industry Revenue (Million), by Type 2024 & 2032
- Figure 25: Asia Pacific Organic Acids Industry Revenue Share (%), by Type 2024 & 2032
- Figure 26: Asia Pacific Organic Acids Industry Revenue (Million), by Application 2024 & 2032
- Figure 27: Asia Pacific Organic Acids Industry Revenue Share (%), by Application 2024 & 2032
- Figure 28: Asia Pacific Organic Acids Industry Revenue (Million), by Country 2024 & 2032
- Figure 29: Asia Pacific Organic Acids Industry Revenue Share (%), by Country 2024 & 2032
- Figure 30: South America Organic Acids Industry Revenue (Million), by Type 2024 & 2032
- Figure 31: South America Organic Acids Industry Revenue Share (%), by Type 2024 & 2032
- Figure 32: South America Organic Acids Industry Revenue (Million), by Application 2024 & 2032
- Figure 33: South America Organic Acids Industry Revenue Share (%), by Application 2024 & 2032
- Figure 34: South America Organic Acids Industry Revenue (Million), by Country 2024 & 2032
- Figure 35: South America Organic Acids Industry Revenue Share (%), by Country 2024 & 2032
- Figure 36: Middle East Organic Acids Industry Revenue (Million), by Type 2024 & 2032
- Figure 37: Middle East Organic Acids Industry Revenue Share (%), by Type 2024 & 2032
- Figure 38: Middle East Organic Acids Industry Revenue (Million), by Application 2024 & 2032
- Figure 39: Middle East Organic Acids Industry Revenue Share (%), by Application 2024 & 2032
- Figure 40: Middle East Organic Acids Industry Revenue (Million), by Country 2024 & 2032
- Figure 41: Middle East Organic Acids Industry Revenue Share (%), by Country 2024 & 2032
- Figure 42: South Africa Organic Acids Industry Revenue (Million), by Type 2024 & 2032
- Figure 43: South Africa Organic Acids Industry Revenue Share (%), by Type 2024 & 2032
- Figure 44: South Africa Organic Acids Industry Revenue (Million), by Application 2024 & 2032
- Figure 45: South Africa Organic Acids Industry Revenue Share (%), by Application 2024 & 2032
- Figure 46: South Africa Organic Acids Industry Revenue (Million), by Country 2024 & 2032
- Figure 47: South Africa Organic Acids Industry Revenue Share (%), by Country 2024 & 2032
List of Tables
- Table 1: Global Organic Acids Industry Revenue Million Forecast, by Region 2019 & 2032
- Table 2: Global Organic Acids Industry Revenue Million Forecast, by Type 2019 & 2032
- Table 3: Global Organic Acids Industry Revenue Million Forecast, by Application 2019 & 2032
- Table 4: Global Organic Acids Industry Revenue Million Forecast, by Region 2019 & 2032
- Table 5: Global Organic Acids Industry Revenue Million Forecast, by Country 2019 & 2032
- Table 6: United States Organic Acids Industry Revenue (Million) Forecast, by Application 2019 & 2032
- Table 7: Canada Organic Acids Industry Revenue (Million) Forecast, by Application 2019 & 2032
- Table 8: Mexico Organic Acids Industry Revenue (Million) Forecast, by Application 2019 & 2032
- Table 9: Rest of North America Organic Acids Industry Revenue (Million) Forecast, by Application 2019 & 2032
- Table 10: Global Organic Acids Industry Revenue Million Forecast, by Country 2019 & 2032
- Table 11: United Kingdom Organic Acids Industry Revenue (Million) Forecast, by Application 2019 & 2032
- Table 12: Germany Organic Acids Industry Revenue (Million) Forecast, by Application 2019 & 2032
- Table 13: France Organic Acids Industry Revenue (Million) Forecast, by Application 2019 & 2032
- Table 14: Russia Organic Acids Industry Revenue (Million) Forecast, by Application 2019 & 2032
- Table 15: Italy Organic Acids Industry Revenue (Million) Forecast, by Application 2019 & 2032
- Table 16: Spain Organic Acids Industry Revenue (Million) Forecast, by Application 2019 & 2032
- Table 17: Rest of Europe Organic Acids Industry Revenue (Million) Forecast, by Application 2019 & 2032
- Table 18: Global Organic Acids Industry Revenue Million Forecast, by Country 2019 & 2032
- Table 19: India Organic Acids Industry Revenue (Million) Forecast, by Application 2019 & 2032
- Table 20: China Organic Acids Industry Revenue (Million) Forecast, by Application 2019 & 2032
- Table 21: Japan Organic Acids Industry Revenue (Million) Forecast, by Application 2019 & 2032
- Table 22: Australia Organic Acids Industry Revenue (Million) Forecast, by Application 2019 & 2032
- Table 23: Rest of Asia Pacific Organic Acids Industry Revenue (Million) Forecast, by Application 2019 & 2032
- Table 24: Global Organic Acids Industry Revenue Million Forecast, by Country 2019 & 2032
- Table 25: Brazil Organic Acids Industry Revenue (Million) Forecast, by Application 2019 & 2032
- Table 26: Argentina Organic Acids Industry Revenue (Million) Forecast, by Application 2019 & 2032
- Table 27: Rest of South America Organic Acids Industry Revenue (Million) Forecast, by Application 2019 & 2032
- Table 28: Global Organic Acids Industry Revenue Million Forecast, by Country 2019 & 2032
- Table 29: Saudi Arabia Organic Acids Industry Revenue (Million) Forecast, by Application 2019 & 2032
- Table 30: Rest of Middle East Organic Acids Industry Revenue (Million) Forecast, by Application 2019 & 2032
- Table 31: Global Organic Acids Industry Revenue Million Forecast, by Type 2019 & 2032
- Table 32: Global Organic Acids Industry Revenue Million Forecast, by Application 2019 & 2032
- Table 33: Global Organic Acids Industry Revenue Million Forecast, by Country 2019 & 2032
- Table 34: United States Organic Acids Industry Revenue (Million) Forecast, by Application 2019 & 2032
- Table 35: Canada Organic Acids Industry Revenue (Million) Forecast, by Application 2019 & 2032
- Table 36: Mexico Organic Acids Industry Revenue (Million) Forecast, by Application 2019 & 2032
- Table 37: Rest of North America Organic Acids Industry Revenue (Million) Forecast, by Application 2019 & 2032
- Table 38: Global Organic Acids Industry Revenue Million Forecast, by Type 2019 & 2032
- Table 39: Global Organic Acids Industry Revenue Million Forecast, by Application 2019 & 2032
- Table 40: Global Organic Acids Industry Revenue Million Forecast, by Country 2019 & 2032
- Table 41: United Kingdom Organic Acids Industry Revenue (Million) Forecast, by Application 2019 & 2032
- Table 42: Germany Organic Acids Industry Revenue (Million) Forecast, by Application 2019 & 2032
- Table 43: France Organic Acids Industry Revenue (Million) Forecast, by Application 2019 & 2032
- Table 44: Russia Organic Acids Industry Revenue (Million) Forecast, by Application 2019 & 2032
- Table 45: Italy Organic Acids Industry Revenue (Million) Forecast, by Application 2019 & 2032
- Table 46: Spain Organic Acids Industry Revenue (Million) Forecast, by Application 2019 & 2032
- Table 47: Rest of Europe Organic Acids Industry Revenue (Million) Forecast, by Application 2019 & 2032
- Table 48: Global Organic Acids Industry Revenue Million Forecast, by Type 2019 & 2032
- Table 49: Global Organic Acids Industry Revenue Million Forecast, by Application 2019 & 2032
- Table 50: Global Organic Acids Industry Revenue Million Forecast, by Country 2019 & 2032
- Table 51: India Organic Acids Industry Revenue (Million) Forecast, by Application 2019 & 2032
- Table 52: China Organic Acids Industry Revenue (Million) Forecast, by Application 2019 & 2032
- Table 53: Japan Organic Acids Industry Revenue (Million) Forecast, by Application 2019 & 2032
- Table 54: Australia Organic Acids Industry Revenue (Million) Forecast, by Application 2019 & 2032
- Table 55: Rest of Asia Pacific Organic Acids Industry Revenue (Million) Forecast, by Application 2019 & 2032
- Table 56: Global Organic Acids Industry Revenue Million Forecast, by Type 2019 & 2032
- Table 57: Global Organic Acids Industry Revenue Million Forecast, by Application 2019 & 2032
- Table 58: Global Organic Acids Industry Revenue Million Forecast, by Country 2019 & 2032
- Table 59: Brazil Organic Acids Industry Revenue (Million) Forecast, by Application 2019 & 2032
- Table 60: Argentina Organic Acids Industry Revenue (Million) Forecast, by Application 2019 & 2032
- Table 61: Rest of South America Organic Acids Industry Revenue (Million) Forecast, by Application 2019 & 2032
- Table 62: Global Organic Acids Industry Revenue Million Forecast, by Type 2019 & 2032
- Table 63: Global Organic Acids Industry Revenue Million Forecast, by Application 2019 & 2032
- Table 64: Global Organic Acids Industry Revenue Million Forecast, by Country 2019 & 2032
- Table 65: Global Organic Acids Industry Revenue Million Forecast, by Type 2019 & 2032
- Table 66: Global Organic Acids Industry Revenue Million Forecast, by Application 2019 & 2032
- Table 67: Global Organic Acids Industry Revenue Million Forecast, by Country 2019 & 2032
- Table 68: Saudi Arabia Organic Acids Industry Revenue (Million) Forecast, by Application 2019 & 2032
- Table 69: Rest of Middle East Organic Acids Industry Revenue (Million) Forecast, by Application 2019 & 2032
Frequently Asked Questions
1. What is the projected Compound Annual Growth Rate (CAGR) of the Organic Acids Industry?
The projected CAGR is approximately 4.50%.
2. Which companies are prominent players in the Organic Acids Industry?
Key companies in the market include Cargill Incorporated, Archer Daniels Midland Company, Tate & Lyle PLC, BASF SE, Koninklijke DSM N V, DuPont*List Not Exhaustive, Eastman Chemical Company.
3. What are the main segments of the Organic Acids Industry?
The market segments include Type, Application.
4. Can you provide details about the market size?
The market size is estimated to be USD XX Million as of 2022.
5. What are some drivers contributing to market growth?
Increasing Demand for Low-Fat and Low-Calorie Food; Increasing Product Innovation.
6. What are the notable trends driving market growth?
Rising Demand of Citric Acid in Food and Beverage Industries.
7. Are there any restraints impacting market growth?
; Threat of New Entrants; Bargaining Power of Buyers/Consumers; Bargaining Power of Suppliers; Threat of Substitute Products; Degree Of Competition.
8. Can you provide examples of recent developments in the market?
1. Cargill invests in a new acetic acid production facility in China 2. ADM expands its citric acid production capacity in Europe 3. DSM launches a new lactic acid fermentation technology 4. Tate & Lyle acquires a leading organic acid manufacturer
9. What pricing options are available for accessing the report?
Pricing options include single-user, multi-user, and enterprise licenses priced at USD 4750, USD 5250, and USD 8750 respectively.
10. Is the market size provided in terms of value or volume?
The market size is provided in terms of value, measured in Million.
11. Are there any specific market keywords associated with the report?
Yes, the market keyword associated with the report is "Organic Acids Industry," which aids in identifying and referencing the specific market segment covered.
12. How do I determine which pricing option suits my needs best?
The pricing options vary based on user requirements and access needs. Individual users may opt for single-user licenses, while businesses requiring broader access may choose multi-user or enterprise licenses for cost-effective access to the report.
13. Are there any additional resources or data provided in the Organic Acids Industry report?
While the report offers comprehensive insights, it's advisable to review the specific contents or supplementary materials provided to ascertain if additional resources or data are available.
14. How can I stay updated on further developments or reports in the Organic Acids Industry?
To stay informed about further developments, trends, and reports in the Organic Acids Industry, consider subscribing to industry newsletters, following relevant companies and organizations, or regularly checking reputable industry news sources and publications.
Methodology
Step 1 - Identification of Relevant Samples Size from Population Database


Step 2 - Approaches for Defining Global Market Size (Value, Volume* & Price*)

Note*: In applicable scenarios
Step 3 - Data Sources
Primary Research
- Web Analytics
- Survey Reports
- Research Institute
- Latest Research Reports
- Opinion Leaders
Secondary Research
- Annual Reports
- White Paper
- Latest Press Release
- Industry Association
- Paid Database
- Investor Presentations

Step 4 - Data Triangulation
Involves using different sources of information in order to increase the validity of a study
These sources are likely to be stakeholders in a program - participants, other researchers, program staff, other community members, and so on.
Then we put all data in single framework & apply various statistical tools to find out the dynamic on the market.
During the analysis stage, feedback from the stakeholder groups would be compared to determine areas of agreement as well as areas of divergence


