
Key Insights
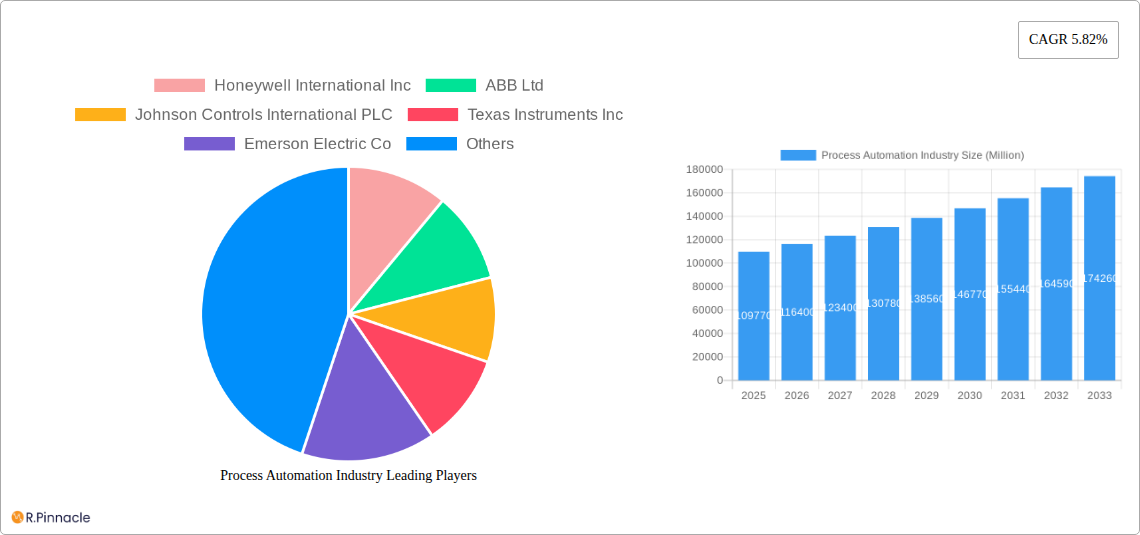
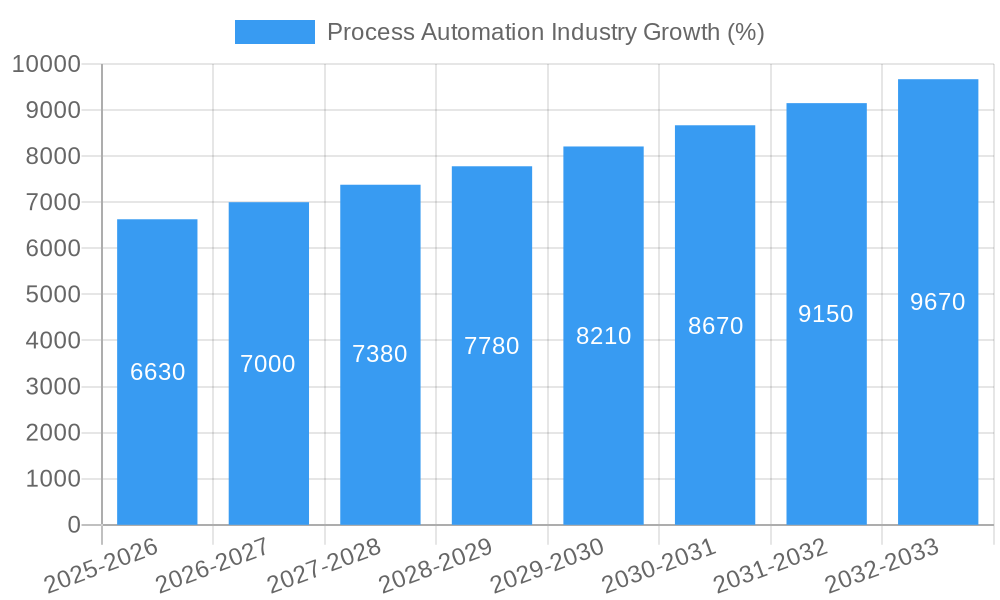
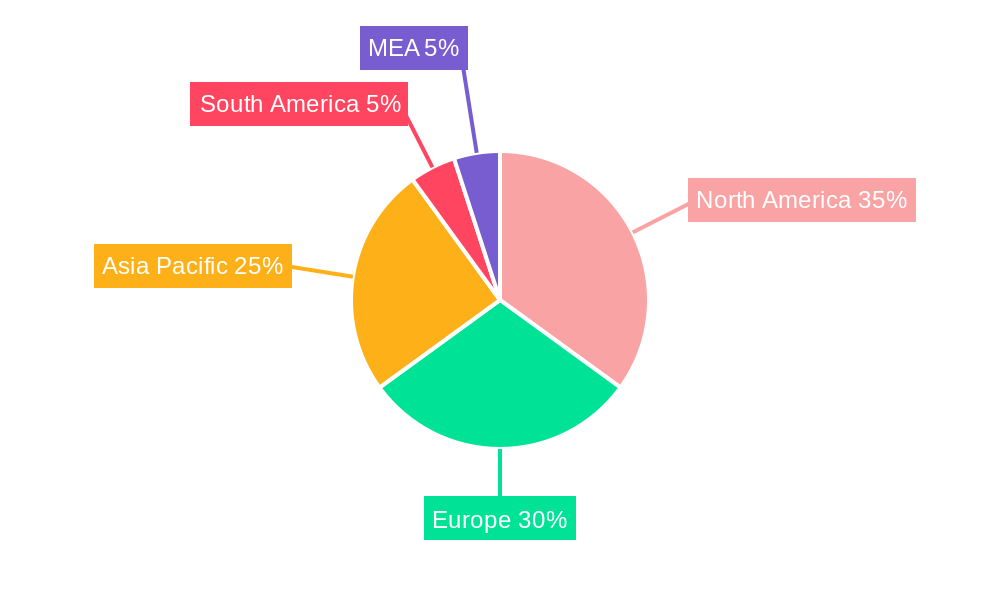
The global process automation market, valued at $109.77 billion in 2025, is projected to experience robust growth, driven by increasing demand for enhanced operational efficiency and safety across various industries. A compound annual growth rate (CAGR) of 5.82% from 2025 to 2033 indicates a significant expansion, fueled by several key factors. The rising adoption of advanced technologies like artificial intelligence (AI) and the Industrial Internet of Things (IIoT) in industrial processes is a major catalyst. Furthermore, the growing need for real-time monitoring and control across sectors such as oil and gas, chemicals, and pharmaceuticals is bolstering market growth. Stringent safety regulations and the imperative to reduce operational costs are also contributing factors. Within the market, segments like SCADA, DCS, and PLC systems are experiencing strong demand, reflecting a shift towards sophisticated automation solutions. The increasing integration of wireless communication protocols enhances flexibility and reduces infrastructure costs, furthering market expansion. Geographically, North America and Europe currently hold significant market share, but the Asia-Pacific region is poised for substantial growth due to rapid industrialization and infrastructure development. However, challenges like high initial investment costs and the need for skilled workforce may act as potential restraints.
The competitive landscape is marked by the presence of several prominent players, including Honeywell, ABB, Siemens, and Rockwell Automation, each vying for market dominance through innovation and strategic partnerships. Future growth will likely be influenced by technological advancements, such as the development of more robust and secure cyber-physical systems, the broader adoption of cloud-based automation solutions, and the integration of advanced analytics for predictive maintenance. The market's expansion will be further shaped by governmental initiatives promoting digital transformation in industries and the ongoing focus on sustainability and environmental compliance. Considering the interplay of these factors, the process automation market is expected to maintain a healthy growth trajectory over the forecast period, presenting significant opportunities for businesses involved in the development and deployment of automation technologies.
Process Automation Industry Market Report: A Comprehensive Analysis (2019-2033)
This in-depth report provides a comprehensive analysis of the Process Automation Industry, offering valuable insights for industry professionals, investors, and strategic decision-makers. With a market value exceeding $XXX Million in 2025 and projected to reach $XXX Million by 2033, this burgeoning sector presents significant opportunities and challenges. The report covers the period 2019-2033, with 2025 as the base year and a forecast period spanning 2025-2033. The study meticulously analyzes market structure, dynamics, key players, and future trends, providing actionable intelligence for informed decision-making.
Process Automation Industry Market Structure & Innovation Trends
The Process Automation market is characterized by a moderately concentrated landscape with several multinational giants commanding significant market share. Honeywell International Inc, ABB Ltd, and Siemens Corporation are among the leading players, each holding a substantial portion of the overall market, estimated at xx% , xx% and xx% respectively in 2025. Innovation is driven by the increasing demand for enhanced efficiency, improved safety, and reduced operational costs across various end-user industries. Stringent regulatory frameworks, particularly concerning safety and environmental compliance, are also significant drivers. The market witnesses continuous M&A activities, with deal values reaching $XX Million in 2024. Key examples include the acquisition of [mention specific M&A deal, if any data available, otherwise leave blank], impacting market consolidation and competitive dynamics. Product substitution is primarily driven by technological advancements, with newer, more efficient technologies gradually replacing older systems. The end-user demographics are diverse, spanning various industries with varying degrees of automation adoption.
Process Automation Industry Market Dynamics & Trends
The Process Automation market is experiencing robust growth, driven by factors such as increasing industrial automation adoption, the burgeoning digitalization of industrial processes, and the growing need for enhanced operational efficiency and data-driven decision-making. The market is projected to register a CAGR of xx% during the forecast period (2025-2033). Technological disruptions, particularly in areas like Artificial Intelligence (AI), Machine Learning (ML), and Industrial Internet of Things (IIoT), are transforming the market landscape, fostering the development of smarter, more interconnected systems. Consumer preferences are shifting towards customized solutions, demanding greater flexibility and scalability. Competitive dynamics are intense, with established players focusing on innovation and strategic partnerships to maintain their market share while new entrants challenge the status quo with disruptive technologies. Market penetration of advanced automation solutions is rapidly increasing across diverse sectors, with a notable surge observed in the [mention specific sector with high penetration, if any data available otherwise leave blank] sector.
Dominant Regions & Segments in Process Automation Industry
North America currently dominates the Process Automation market, owing to robust industrial infrastructure, advanced technological capabilities, and high levels of automation adoption. Within this region, the United States holds a leading position.
- Key Drivers for North American Dominance:
- Strong economic policies supporting industrial growth.
- Well-established industrial infrastructure.
- High levels of technological advancement and R&D investment.
Other significant regions include Europe and Asia-Pacific. Within the segment analysis:
- System Type: PLC and DCS segments hold the largest market share, driven by their widespread adoption across various industries.
- Communication Protocol: Wired protocols currently dominate, but wireless protocols are witnessing significant growth due to their flexibility and cost-effectiveness.
- End-user Industry: The Chemical and Petrochemical, Oil and Gas, and Energy and Utilities sectors are major consumers of process automation solutions, driving significant market growth.
Detailed dominance analysis reveals a high concentration of market share in specific geographical areas due to factors like strong governmental support, industrial base, and consumer demand.
Process Automation Industry Product Innovations
Recent innovations focus on enhancing system integration, improving data analytics capabilities, and enhancing cybersecurity features. Advanced analytics dashboards offer real-time insights into operational parameters, allowing for improved decision-making and predictive maintenance. The integration of AI and ML algorithms further augments the predictive capabilities of these systems, optimizing efficiency and minimizing downtime. These advancements cater to the growing demand for intelligent automation solutions that are adaptable, secure, and user-friendly, improving market fit.
Report Scope & Segmentation Analysis
This report comprehensively segments the Process Automation market based on system type (SCADA, PLC, DCS, MES, Valves and Actuators, Electric Motors, HMI, Process Safety Systems, Sensors and Transmitters, Other Systems), communication protocol (Wired, Wireless), and end-user industry (Chemical and Petrochemical, Paper and Pulp, Water and Wastewater Treatment, Energy and Utilities, Oil and Gas, Pharmaceutical, Food and Beverages, Other End-user Industries). Each segment’s growth projections, market size, and competitive dynamics are thoroughly analyzed to provide a holistic view of the market landscape. For instance, the DCS segment is expected to exhibit significant growth due to [mention reason for growth, if any data available, otherwise leave blank].
Key Drivers of Process Automation Industry Growth
The Process Automation industry's growth is propelled by several key factors:
- Technological Advancements: The continuous development of advanced technologies like AI, ML, and IIoT is driving innovation and improving the efficiency and effectiveness of automation systems.
- Economic Growth: The global economic expansion, particularly in emerging economies, fuels demand for automation solutions across various industries.
- Regulatory Compliance: Stringent regulations regarding safety, environmental protection, and data security are driving the adoption of advanced automation technologies.
Challenges in the Process Automation Industry Sector
The industry faces challenges including:
- High Initial Investment Costs: The implementation of advanced automation systems requires significant upfront investment, potentially hindering adoption for smaller companies.
- Cybersecurity Concerns: The increasing interconnectedness of automation systems raises cybersecurity risks, necessitating robust security measures.
- Integration Complexity: Integrating diverse automation systems across different platforms and manufacturers can be complex and costly.
These factors can negatively impact overall market growth, although their effects are projected to be mitigated in the long term due to increasing technological advancements and improvements in integration practices.
Emerging Opportunities in Process Automation Industry
Emerging opportunities include:
- Growth in Emerging Markets: Rapid industrialization and infrastructure development in emerging economies present significant growth potential for process automation solutions.
- Advancements in AI and ML: The increasing sophistication of AI and ML algorithms is creating new opportunities for process optimization and predictive maintenance.
- Cloud-Based Solutions: The shift towards cloud-based automation platforms enhances scalability, accessibility, and cost-effectiveness.
Leading Players in the Process Automation Industry Market
- Honeywell International Inc
- ABB Ltd
- Johnson Controls International PLC
- Texas Instruments Inc
- Emerson Electric Co
- Mitsubishi Electric Corporation
- Schneider Electric SE
- Eaton Corporation PLC
- Siemens Corporation
- Rockwell Automation Inc
- Bosch Rexroth AG (Robert Bosch GmBH)
- Dassault Systemes SE
- Yokogawa Electric Corporation
Key Developments in Process Automation Industry
- 2023-03: ABB launched its new [mention specific product/technology if available. Otherwise remove this bullet point.].
- 2022-10: Honeywell and [mention partner company if available. Otherwise remove this bullet point.] announced a strategic partnership. (Add further bullet points with specific examples if data is available, otherwise remove section)
Future Outlook for Process Automation Industry Market
The future of the Process Automation market is bright, with strong growth expected to continue throughout the forecast period. The convergence of advanced technologies, increasing industrial automation adoption, and the growing demand for enhanced operational efficiency and sustainability will drive market expansion. Strategic partnerships, investments in R&D, and the development of innovative solutions will play a crucial role in shaping the future competitive landscape. The market presents significant opportunities for companies that can adapt to the evolving technological landscape and meet the growing demands of various end-user industries.
Process Automation Industry Segmentation
-
1. System Type
- 1.1. Supervisory Control and Data Acquisition (SCADA)
- 1.2. Programmable Logic Controller (PLC)
- 1.3. Distributed Control System (DCS)
- 1.4. Machine Execution System (MES)
- 1.5. Valves and Actuators
- 1.6. Electric Motors
- 1.7. Human Machine Interface (HMI)
- 1.8. Process Safety Systems
- 1.9. Sensors and Transmitters
- 1.10. Other Systems
-
2. Communication Protocol
- 2.1. Wired Protocol
- 2.2. Wireless Protocol
-
3. End-user Industry
- 3.1. Chemical and Petrochemical
- 3.2. Paper and Pulp
- 3.3. Water and Wastewater Treatment
- 3.4. Energy and Utilities
- 3.5. Oil and Gas
- 3.6. Pharmaceutical
- 3.7. Food and Beverages
- 3.8. Other End-user Industries
Process Automation Industry Segmentation By Geography
-
1. North America
- 1.1. United States
- 1.2. Canada
-
2. Europe
- 2.1. United Kingdom
- 2.2. Germany
- 2.3. France
- 2.4. Rest of Europe
-
3. Asia Pacific
- 3.1. China
- 3.2. India
- 3.3. Japan
- 3.4. Rest of Asia Pacific
- 4. Latin America
- 5. Middle East and Africa
Process Automation Industry REPORT HIGHLIGHTS
| Aspects | Details |
|---|---|
| Study Period | 2019-2033 |
| Base Year | 2024 |
| Estimated Year | 2025 |
| Forecast Period | 2025-2033 |
| Historical Period | 2019-2024 |
| Growth Rate | CAGR of 5.82% from 2019-2033 |
| Segmentation |
|
Table of Contents
- 1. Introduction
- 1.1. Research Scope
- 1.2. Market Segmentation
- 1.3. Research Methodology
- 1.4. Definitions and Assumptions
- 2. Executive Summary
- 2.1. Introduction
- 3. Market Dynamics
- 3.1. Introduction
- 3.2. Market Drivers
- 3.2.1. ; Rising Adoption of Robotics; Growing Emphasis on Energy Efficiency and Cost Reduction; Emergence of IIoT; Demand for Safety Automation Systems
- 3.3. Market Restrains
- 3.3.1. High Up-front Installation Costs and Interoperability Issues; Unavailability for Skilled Workforce
- 3.4. Market Trends
- 3.4.1. Paper and Pulp Segment is Expected to Register a Significant Growth
- 4. Market Factor Analysis
- 4.1. Porters Five Forces
- 4.2. Supply/Value Chain
- 4.3. PESTEL analysis
- 4.4. Market Entropy
- 4.5. Patent/Trademark Analysis
- 5. Global Process Automation Industry Analysis, Insights and Forecast, 2019-2031
- 5.1. Market Analysis, Insights and Forecast - by System Type
- 5.1.1. Supervisory Control and Data Acquisition (SCADA)
- 5.1.2. Programmable Logic Controller (PLC)
- 5.1.3. Distributed Control System (DCS)
- 5.1.4. Machine Execution System (MES)
- 5.1.5. Valves and Actuators
- 5.1.6. Electric Motors
- 5.1.7. Human Machine Interface (HMI)
- 5.1.8. Process Safety Systems
- 5.1.9. Sensors and Transmitters
- 5.1.10. Other Systems
- 5.2. Market Analysis, Insights and Forecast - by Communication Protocol
- 5.2.1. Wired Protocol
- 5.2.2. Wireless Protocol
- 5.3. Market Analysis, Insights and Forecast - by End-user Industry
- 5.3.1. Chemical and Petrochemical
- 5.3.2. Paper and Pulp
- 5.3.3. Water and Wastewater Treatment
- 5.3.4. Energy and Utilities
- 5.3.5. Oil and Gas
- 5.3.6. Pharmaceutical
- 5.3.7. Food and Beverages
- 5.3.8. Other End-user Industries
- 5.4. Market Analysis, Insights and Forecast - by Region
- 5.4.1. North America
- 5.4.2. Europe
- 5.4.3. Asia Pacific
- 5.4.4. Latin America
- 5.4.5. Middle East and Africa
- 5.1. Market Analysis, Insights and Forecast - by System Type
- 6. North America Process Automation Industry Analysis, Insights and Forecast, 2019-2031
- 6.1. Market Analysis, Insights and Forecast - by System Type
- 6.1.1. Supervisory Control and Data Acquisition (SCADA)
- 6.1.2. Programmable Logic Controller (PLC)
- 6.1.3. Distributed Control System (DCS)
- 6.1.4. Machine Execution System (MES)
- 6.1.5. Valves and Actuators
- 6.1.6. Electric Motors
- 6.1.7. Human Machine Interface (HMI)
- 6.1.8. Process Safety Systems
- 6.1.9. Sensors and Transmitters
- 6.1.10. Other Systems
- 6.2. Market Analysis, Insights and Forecast - by Communication Protocol
- 6.2.1. Wired Protocol
- 6.2.2. Wireless Protocol
- 6.3. Market Analysis, Insights and Forecast - by End-user Industry
- 6.3.1. Chemical and Petrochemical
- 6.3.2. Paper and Pulp
- 6.3.3. Water and Wastewater Treatment
- 6.3.4. Energy and Utilities
- 6.3.5. Oil and Gas
- 6.3.6. Pharmaceutical
- 6.3.7. Food and Beverages
- 6.3.8. Other End-user Industries
- 6.1. Market Analysis, Insights and Forecast - by System Type
- 7. Europe Process Automation Industry Analysis, Insights and Forecast, 2019-2031
- 7.1. Market Analysis, Insights and Forecast - by System Type
- 7.1.1. Supervisory Control and Data Acquisition (SCADA)
- 7.1.2. Programmable Logic Controller (PLC)
- 7.1.3. Distributed Control System (DCS)
- 7.1.4. Machine Execution System (MES)
- 7.1.5. Valves and Actuators
- 7.1.6. Electric Motors
- 7.1.7. Human Machine Interface (HMI)
- 7.1.8. Process Safety Systems
- 7.1.9. Sensors and Transmitters
- 7.1.10. Other Systems
- 7.2. Market Analysis, Insights and Forecast - by Communication Protocol
- 7.2.1. Wired Protocol
- 7.2.2. Wireless Protocol
- 7.3. Market Analysis, Insights and Forecast - by End-user Industry
- 7.3.1. Chemical and Petrochemical
- 7.3.2. Paper and Pulp
- 7.3.3. Water and Wastewater Treatment
- 7.3.4. Energy and Utilities
- 7.3.5. Oil and Gas
- 7.3.6. Pharmaceutical
- 7.3.7. Food and Beverages
- 7.3.8. Other End-user Industries
- 7.1. Market Analysis, Insights and Forecast - by System Type
- 8. Asia Pacific Process Automation Industry Analysis, Insights and Forecast, 2019-2031
- 8.1. Market Analysis, Insights and Forecast - by System Type
- 8.1.1. Supervisory Control and Data Acquisition (SCADA)
- 8.1.2. Programmable Logic Controller (PLC)
- 8.1.3. Distributed Control System (DCS)
- 8.1.4. Machine Execution System (MES)
- 8.1.5. Valves and Actuators
- 8.1.6. Electric Motors
- 8.1.7. Human Machine Interface (HMI)
- 8.1.8. Process Safety Systems
- 8.1.9. Sensors and Transmitters
- 8.1.10. Other Systems
- 8.2. Market Analysis, Insights and Forecast - by Communication Protocol
- 8.2.1. Wired Protocol
- 8.2.2. Wireless Protocol
- 8.3. Market Analysis, Insights and Forecast - by End-user Industry
- 8.3.1. Chemical and Petrochemical
- 8.3.2. Paper and Pulp
- 8.3.3. Water and Wastewater Treatment
- 8.3.4. Energy and Utilities
- 8.3.5. Oil and Gas
- 8.3.6. Pharmaceutical
- 8.3.7. Food and Beverages
- 8.3.8. Other End-user Industries
- 8.1. Market Analysis, Insights and Forecast - by System Type
- 9. Latin America Process Automation Industry Analysis, Insights and Forecast, 2019-2031
- 9.1. Market Analysis, Insights and Forecast - by System Type
- 9.1.1. Supervisory Control and Data Acquisition (SCADA)
- 9.1.2. Programmable Logic Controller (PLC)
- 9.1.3. Distributed Control System (DCS)
- 9.1.4. Machine Execution System (MES)
- 9.1.5. Valves and Actuators
- 9.1.6. Electric Motors
- 9.1.7. Human Machine Interface (HMI)
- 9.1.8. Process Safety Systems
- 9.1.9. Sensors and Transmitters
- 9.1.10. Other Systems
- 9.2. Market Analysis, Insights and Forecast - by Communication Protocol
- 9.2.1. Wired Protocol
- 9.2.2. Wireless Protocol
- 9.3. Market Analysis, Insights and Forecast - by End-user Industry
- 9.3.1. Chemical and Petrochemical
- 9.3.2. Paper and Pulp
- 9.3.3. Water and Wastewater Treatment
- 9.3.4. Energy and Utilities
- 9.3.5. Oil and Gas
- 9.3.6. Pharmaceutical
- 9.3.7. Food and Beverages
- 9.3.8. Other End-user Industries
- 9.1. Market Analysis, Insights and Forecast - by System Type
- 10. Middle East and Africa Process Automation Industry Analysis, Insights and Forecast, 2019-2031
- 10.1. Market Analysis, Insights and Forecast - by System Type
- 10.1.1. Supervisory Control and Data Acquisition (SCADA)
- 10.1.2. Programmable Logic Controller (PLC)
- 10.1.3. Distributed Control System (DCS)
- 10.1.4. Machine Execution System (MES)
- 10.1.5. Valves and Actuators
- 10.1.6. Electric Motors
- 10.1.7. Human Machine Interface (HMI)
- 10.1.8. Process Safety Systems
- 10.1.9. Sensors and Transmitters
- 10.1.10. Other Systems
- 10.2. Market Analysis, Insights and Forecast - by Communication Protocol
- 10.2.1. Wired Protocol
- 10.2.2. Wireless Protocol
- 10.3. Market Analysis, Insights and Forecast - by End-user Industry
- 10.3.1. Chemical and Petrochemical
- 10.3.2. Paper and Pulp
- 10.3.3. Water and Wastewater Treatment
- 10.3.4. Energy and Utilities
- 10.3.5. Oil and Gas
- 10.3.6. Pharmaceutical
- 10.3.7. Food and Beverages
- 10.3.8. Other End-user Industries
- 10.1. Market Analysis, Insights and Forecast - by System Type
- 11. North America Process Automation Industry Analysis, Insights and Forecast, 2019-2031
- 11.1. Market Analysis, Insights and Forecast - By Country/Sub-region
- 11.1.1 United States
- 11.1.2 Canada
- 11.1.3 Mexico
- 12. Europe Process Automation Industry Analysis, Insights and Forecast, 2019-2031
- 12.1. Market Analysis, Insights and Forecast - By Country/Sub-region
- 12.1.1 Germany
- 12.1.2 United Kingdom
- 12.1.3 France
- 12.1.4 Spain
- 12.1.5 Italy
- 12.1.6 Spain
- 12.1.7 Belgium
- 12.1.8 Netherland
- 12.1.9 Nordics
- 12.1.10 Rest of Europe
- 13. Asia Pacific Process Automation Industry Analysis, Insights and Forecast, 2019-2031
- 13.1. Market Analysis, Insights and Forecast - By Country/Sub-region
- 13.1.1 China
- 13.1.2 Japan
- 13.1.3 India
- 13.1.4 South Korea
- 13.1.5 Southeast Asia
- 13.1.6 Australia
- 13.1.7 Indonesia
- 13.1.8 Phillipes
- 13.1.9 Singapore
- 13.1.10 Thailandc
- 13.1.11 Rest of Asia Pacific
- 14. South America Process Automation Industry Analysis, Insights and Forecast, 2019-2031
- 14.1. Market Analysis, Insights and Forecast - By Country/Sub-region
- 14.1.1 Brazil
- 14.1.2 Argentina
- 14.1.3 Peru
- 14.1.4 Chile
- 14.1.5 Colombia
- 14.1.6 Ecuador
- 14.1.7 Venezuela
- 14.1.8 Rest of South America
- 15. MEA Process Automation Industry Analysis, Insights and Forecast, 2019-2031
- 15.1. Market Analysis, Insights and Forecast - By Country/Sub-region
- 15.1.1 United Arab Emirates
- 15.1.2 Saudi Arabia
- 15.1.3 South Africa
- 15.1.4 Rest of Middle East and Africa
- 16. Competitive Analysis
- 16.1. Global Market Share Analysis 2024
- 16.2. Company Profiles
- 16.2.1 Honeywell International Inc
- 16.2.1.1. Overview
- 16.2.1.2. Products
- 16.2.1.3. SWOT Analysis
- 16.2.1.4. Recent Developments
- 16.2.1.5. Financials (Based on Availability)
- 16.2.2 ABB Ltd
- 16.2.2.1. Overview
- 16.2.2.2. Products
- 16.2.2.3. SWOT Analysis
- 16.2.2.4. Recent Developments
- 16.2.2.5. Financials (Based on Availability)
- 16.2.3 Johnson Controls International PLC
- 16.2.3.1. Overview
- 16.2.3.2. Products
- 16.2.3.3. SWOT Analysis
- 16.2.3.4. Recent Developments
- 16.2.3.5. Financials (Based on Availability)
- 16.2.4 Texas Instruments Inc
- 16.2.4.1. Overview
- 16.2.4.2. Products
- 16.2.4.3. SWOT Analysis
- 16.2.4.4. Recent Developments
- 16.2.4.5. Financials (Based on Availability)
- 16.2.5 Emerson Electric Co
- 16.2.5.1. Overview
- 16.2.5.2. Products
- 16.2.5.3. SWOT Analysis
- 16.2.5.4. Recent Developments
- 16.2.5.5. Financials (Based on Availability)
- 16.2.6 Mitsubishi Electric Corporation
- 16.2.6.1. Overview
- 16.2.6.2. Products
- 16.2.6.3. SWOT Analysis
- 16.2.6.4. Recent Developments
- 16.2.6.5. Financials (Based on Availability)
- 16.2.7 Schneider Electric SE
- 16.2.7.1. Overview
- 16.2.7.2. Products
- 16.2.7.3. SWOT Analysis
- 16.2.7.4. Recent Developments
- 16.2.7.5. Financials (Based on Availability)
- 16.2.8 Eaton Corporation PLC
- 16.2.8.1. Overview
- 16.2.8.2. Products
- 16.2.8.3. SWOT Analysis
- 16.2.8.4. Recent Developments
- 16.2.8.5. Financials (Based on Availability)
- 16.2.9 Siemens Corporation
- 16.2.9.1. Overview
- 16.2.9.2. Products
- 16.2.9.3. SWOT Analysis
- 16.2.9.4. Recent Developments
- 16.2.9.5. Financials (Based on Availability)
- 16.2.10 Rockwell Automation Inc
- 16.2.10.1. Overview
- 16.2.10.2. Products
- 16.2.10.3. SWOT Analysis
- 16.2.10.4. Recent Developments
- 16.2.10.5. Financials (Based on Availability)
- 16.2.11 Bosch Rexroth AG (Robert Bosch GmBH)
- 16.2.11.1. Overview
- 16.2.11.2. Products
- 16.2.11.3. SWOT Analysis
- 16.2.11.4. Recent Developments
- 16.2.11.5. Financials (Based on Availability)
- 16.2.12 Dassault Systemes SE
- 16.2.12.1. Overview
- 16.2.12.2. Products
- 16.2.12.3. SWOT Analysis
- 16.2.12.4. Recent Developments
- 16.2.12.5. Financials (Based on Availability)
- 16.2.13 Yokogawa Electric Corporation
- 16.2.13.1. Overview
- 16.2.13.2. Products
- 16.2.13.3. SWOT Analysis
- 16.2.13.4. Recent Developments
- 16.2.13.5. Financials (Based on Availability)
- 16.2.1 Honeywell International Inc
List of Figures
- Figure 1: Global Process Automation Industry Revenue Breakdown (Million, %) by Region 2024 & 2032
- Figure 2: North America Process Automation Industry Revenue (Million), by Country 2024 & 2032
- Figure 3: North America Process Automation Industry Revenue Share (%), by Country 2024 & 2032
- Figure 4: Europe Process Automation Industry Revenue (Million), by Country 2024 & 2032
- Figure 5: Europe Process Automation Industry Revenue Share (%), by Country 2024 & 2032
- Figure 6: Asia Pacific Process Automation Industry Revenue (Million), by Country 2024 & 2032
- Figure 7: Asia Pacific Process Automation Industry Revenue Share (%), by Country 2024 & 2032
- Figure 8: South America Process Automation Industry Revenue (Million), by Country 2024 & 2032
- Figure 9: South America Process Automation Industry Revenue Share (%), by Country 2024 & 2032
- Figure 10: MEA Process Automation Industry Revenue (Million), by Country 2024 & 2032
- Figure 11: MEA Process Automation Industry Revenue Share (%), by Country 2024 & 2032
- Figure 12: North America Process Automation Industry Revenue (Million), by System Type 2024 & 2032
- Figure 13: North America Process Automation Industry Revenue Share (%), by System Type 2024 & 2032
- Figure 14: North America Process Automation Industry Revenue (Million), by Communication Protocol 2024 & 2032
- Figure 15: North America Process Automation Industry Revenue Share (%), by Communication Protocol 2024 & 2032
- Figure 16: North America Process Automation Industry Revenue (Million), by End-user Industry 2024 & 2032
- Figure 17: North America Process Automation Industry Revenue Share (%), by End-user Industry 2024 & 2032
- Figure 18: North America Process Automation Industry Revenue (Million), by Country 2024 & 2032
- Figure 19: North America Process Automation Industry Revenue Share (%), by Country 2024 & 2032
- Figure 20: Europe Process Automation Industry Revenue (Million), by System Type 2024 & 2032
- Figure 21: Europe Process Automation Industry Revenue Share (%), by System Type 2024 & 2032
- Figure 22: Europe Process Automation Industry Revenue (Million), by Communication Protocol 2024 & 2032
- Figure 23: Europe Process Automation Industry Revenue Share (%), by Communication Protocol 2024 & 2032
- Figure 24: Europe Process Automation Industry Revenue (Million), by End-user Industry 2024 & 2032
- Figure 25: Europe Process Automation Industry Revenue Share (%), by End-user Industry 2024 & 2032
- Figure 26: Europe Process Automation Industry Revenue (Million), by Country 2024 & 2032
- Figure 27: Europe Process Automation Industry Revenue Share (%), by Country 2024 & 2032
- Figure 28: Asia Pacific Process Automation Industry Revenue (Million), by System Type 2024 & 2032
- Figure 29: Asia Pacific Process Automation Industry Revenue Share (%), by System Type 2024 & 2032
- Figure 30: Asia Pacific Process Automation Industry Revenue (Million), by Communication Protocol 2024 & 2032
- Figure 31: Asia Pacific Process Automation Industry Revenue Share (%), by Communication Protocol 2024 & 2032
- Figure 32: Asia Pacific Process Automation Industry Revenue (Million), by End-user Industry 2024 & 2032
- Figure 33: Asia Pacific Process Automation Industry Revenue Share (%), by End-user Industry 2024 & 2032
- Figure 34: Asia Pacific Process Automation Industry Revenue (Million), by Country 2024 & 2032
- Figure 35: Asia Pacific Process Automation Industry Revenue Share (%), by Country 2024 & 2032
- Figure 36: Latin America Process Automation Industry Revenue (Million), by System Type 2024 & 2032
- Figure 37: Latin America Process Automation Industry Revenue Share (%), by System Type 2024 & 2032
- Figure 38: Latin America Process Automation Industry Revenue (Million), by Communication Protocol 2024 & 2032
- Figure 39: Latin America Process Automation Industry Revenue Share (%), by Communication Protocol 2024 & 2032
- Figure 40: Latin America Process Automation Industry Revenue (Million), by End-user Industry 2024 & 2032
- Figure 41: Latin America Process Automation Industry Revenue Share (%), by End-user Industry 2024 & 2032
- Figure 42: Latin America Process Automation Industry Revenue (Million), by Country 2024 & 2032
- Figure 43: Latin America Process Automation Industry Revenue Share (%), by Country 2024 & 2032
- Figure 44: Middle East and Africa Process Automation Industry Revenue (Million), by System Type 2024 & 2032
- Figure 45: Middle East and Africa Process Automation Industry Revenue Share (%), by System Type 2024 & 2032
- Figure 46: Middle East and Africa Process Automation Industry Revenue (Million), by Communication Protocol 2024 & 2032
- Figure 47: Middle East and Africa Process Automation Industry Revenue Share (%), by Communication Protocol 2024 & 2032
- Figure 48: Middle East and Africa Process Automation Industry Revenue (Million), by End-user Industry 2024 & 2032
- Figure 49: Middle East and Africa Process Automation Industry Revenue Share (%), by End-user Industry 2024 & 2032
- Figure 50: Middle East and Africa Process Automation Industry Revenue (Million), by Country 2024 & 2032
- Figure 51: Middle East and Africa Process Automation Industry Revenue Share (%), by Country 2024 & 2032
List of Tables
- Table 1: Global Process Automation Industry Revenue Million Forecast, by Region 2019 & 2032
- Table 2: Global Process Automation Industry Revenue Million Forecast, by System Type 2019 & 2032
- Table 3: Global Process Automation Industry Revenue Million Forecast, by Communication Protocol 2019 & 2032
- Table 4: Global Process Automation Industry Revenue Million Forecast, by End-user Industry 2019 & 2032
- Table 5: Global Process Automation Industry Revenue Million Forecast, by Region 2019 & 2032
- Table 6: Global Process Automation Industry Revenue Million Forecast, by Country 2019 & 2032
- Table 7: United States Process Automation Industry Revenue (Million) Forecast, by Application 2019 & 2032
- Table 8: Canada Process Automation Industry Revenue (Million) Forecast, by Application 2019 & 2032
- Table 9: Mexico Process Automation Industry Revenue (Million) Forecast, by Application 2019 & 2032
- Table 10: Global Process Automation Industry Revenue Million Forecast, by Country 2019 & 2032
- Table 11: Germany Process Automation Industry Revenue (Million) Forecast, by Application 2019 & 2032
- Table 12: United Kingdom Process Automation Industry Revenue (Million) Forecast, by Application 2019 & 2032
- Table 13: France Process Automation Industry Revenue (Million) Forecast, by Application 2019 & 2032
- Table 14: Spain Process Automation Industry Revenue (Million) Forecast, by Application 2019 & 2032
- Table 15: Italy Process Automation Industry Revenue (Million) Forecast, by Application 2019 & 2032
- Table 16: Spain Process Automation Industry Revenue (Million) Forecast, by Application 2019 & 2032
- Table 17: Belgium Process Automation Industry Revenue (Million) Forecast, by Application 2019 & 2032
- Table 18: Netherland Process Automation Industry Revenue (Million) Forecast, by Application 2019 & 2032
- Table 19: Nordics Process Automation Industry Revenue (Million) Forecast, by Application 2019 & 2032
- Table 20: Rest of Europe Process Automation Industry Revenue (Million) Forecast, by Application 2019 & 2032
- Table 21: Global Process Automation Industry Revenue Million Forecast, by Country 2019 & 2032
- Table 22: China Process Automation Industry Revenue (Million) Forecast, by Application 2019 & 2032
- Table 23: Japan Process Automation Industry Revenue (Million) Forecast, by Application 2019 & 2032
- Table 24: India Process Automation Industry Revenue (Million) Forecast, by Application 2019 & 2032
- Table 25: South Korea Process Automation Industry Revenue (Million) Forecast, by Application 2019 & 2032
- Table 26: Southeast Asia Process Automation Industry Revenue (Million) Forecast, by Application 2019 & 2032
- Table 27: Australia Process Automation Industry Revenue (Million) Forecast, by Application 2019 & 2032
- Table 28: Indonesia Process Automation Industry Revenue (Million) Forecast, by Application 2019 & 2032
- Table 29: Phillipes Process Automation Industry Revenue (Million) Forecast, by Application 2019 & 2032
- Table 30: Singapore Process Automation Industry Revenue (Million) Forecast, by Application 2019 & 2032
- Table 31: Thailandc Process Automation Industry Revenue (Million) Forecast, by Application 2019 & 2032
- Table 32: Rest of Asia Pacific Process Automation Industry Revenue (Million) Forecast, by Application 2019 & 2032
- Table 33: Global Process Automation Industry Revenue Million Forecast, by Country 2019 & 2032
- Table 34: Brazil Process Automation Industry Revenue (Million) Forecast, by Application 2019 & 2032
- Table 35: Argentina Process Automation Industry Revenue (Million) Forecast, by Application 2019 & 2032
- Table 36: Peru Process Automation Industry Revenue (Million) Forecast, by Application 2019 & 2032
- Table 37: Chile Process Automation Industry Revenue (Million) Forecast, by Application 2019 & 2032
- Table 38: Colombia Process Automation Industry Revenue (Million) Forecast, by Application 2019 & 2032
- Table 39: Ecuador Process Automation Industry Revenue (Million) Forecast, by Application 2019 & 2032
- Table 40: Venezuela Process Automation Industry Revenue (Million) Forecast, by Application 2019 & 2032
- Table 41: Rest of South America Process Automation Industry Revenue (Million) Forecast, by Application 2019 & 2032
- Table 42: Global Process Automation Industry Revenue Million Forecast, by Country 2019 & 2032
- Table 43: United Arab Emirates Process Automation Industry Revenue (Million) Forecast, by Application 2019 & 2032
- Table 44: Saudi Arabia Process Automation Industry Revenue (Million) Forecast, by Application 2019 & 2032
- Table 45: South Africa Process Automation Industry Revenue (Million) Forecast, by Application 2019 & 2032
- Table 46: Rest of Middle East and Africa Process Automation Industry Revenue (Million) Forecast, by Application 2019 & 2032
- Table 47: Global Process Automation Industry Revenue Million Forecast, by System Type 2019 & 2032
- Table 48: Global Process Automation Industry Revenue Million Forecast, by Communication Protocol 2019 & 2032
- Table 49: Global Process Automation Industry Revenue Million Forecast, by End-user Industry 2019 & 2032
- Table 50: Global Process Automation Industry Revenue Million Forecast, by Country 2019 & 2032
- Table 51: United States Process Automation Industry Revenue (Million) Forecast, by Application 2019 & 2032
- Table 52: Canada Process Automation Industry Revenue (Million) Forecast, by Application 2019 & 2032
- Table 53: Global Process Automation Industry Revenue Million Forecast, by System Type 2019 & 2032
- Table 54: Global Process Automation Industry Revenue Million Forecast, by Communication Protocol 2019 & 2032
- Table 55: Global Process Automation Industry Revenue Million Forecast, by End-user Industry 2019 & 2032
- Table 56: Global Process Automation Industry Revenue Million Forecast, by Country 2019 & 2032
- Table 57: United Kingdom Process Automation Industry Revenue (Million) Forecast, by Application 2019 & 2032
- Table 58: Germany Process Automation Industry Revenue (Million) Forecast, by Application 2019 & 2032
- Table 59: France Process Automation Industry Revenue (Million) Forecast, by Application 2019 & 2032
- Table 60: Rest of Europe Process Automation Industry Revenue (Million) Forecast, by Application 2019 & 2032
- Table 61: Global Process Automation Industry Revenue Million Forecast, by System Type 2019 & 2032
- Table 62: Global Process Automation Industry Revenue Million Forecast, by Communication Protocol 2019 & 2032
- Table 63: Global Process Automation Industry Revenue Million Forecast, by End-user Industry 2019 & 2032
- Table 64: Global Process Automation Industry Revenue Million Forecast, by Country 2019 & 2032
- Table 65: China Process Automation Industry Revenue (Million) Forecast, by Application 2019 & 2032
- Table 66: India Process Automation Industry Revenue (Million) Forecast, by Application 2019 & 2032
- Table 67: Japan Process Automation Industry Revenue (Million) Forecast, by Application 2019 & 2032
- Table 68: Rest of Asia Pacific Process Automation Industry Revenue (Million) Forecast, by Application 2019 & 2032
- Table 69: Global Process Automation Industry Revenue Million Forecast, by System Type 2019 & 2032
- Table 70: Global Process Automation Industry Revenue Million Forecast, by Communication Protocol 2019 & 2032
- Table 71: Global Process Automation Industry Revenue Million Forecast, by End-user Industry 2019 & 2032
- Table 72: Global Process Automation Industry Revenue Million Forecast, by Country 2019 & 2032
- Table 73: Global Process Automation Industry Revenue Million Forecast, by System Type 2019 & 2032
- Table 74: Global Process Automation Industry Revenue Million Forecast, by Communication Protocol 2019 & 2032
- Table 75: Global Process Automation Industry Revenue Million Forecast, by End-user Industry 2019 & 2032
- Table 76: Global Process Automation Industry Revenue Million Forecast, by Country 2019 & 2032
Frequently Asked Questions
1. What is the projected Compound Annual Growth Rate (CAGR) of the Process Automation Industry?
The projected CAGR is approximately 5.82%.
2. Which companies are prominent players in the Process Automation Industry?
Key companies in the market include Honeywell International Inc, ABB Ltd, Johnson Controls International PLC, Texas Instruments Inc, Emerson Electric Co, Mitsubishi Electric Corporation, Schneider Electric SE, Eaton Corporation PLC, Siemens Corporation, Rockwell Automation Inc, Bosch Rexroth AG (Robert Bosch GmBH), Dassault Systemes SE, Yokogawa Electric Corporation.
3. What are the main segments of the Process Automation Industry?
The market segments include System Type, Communication Protocol, End-user Industry.
4. Can you provide details about the market size?
The market size is estimated to be USD 109.77 Million as of 2022.
5. What are some drivers contributing to market growth?
; Rising Adoption of Robotics; Growing Emphasis on Energy Efficiency and Cost Reduction; Emergence of IIoT; Demand for Safety Automation Systems.
6. What are the notable trends driving market growth?
Paper and Pulp Segment is Expected to Register a Significant Growth.
7. Are there any restraints impacting market growth?
High Up-front Installation Costs and Interoperability Issues; Unavailability for Skilled Workforce.
8. Can you provide examples of recent developments in the market?
N/A
9. What pricing options are available for accessing the report?
Pricing options include single-user, multi-user, and enterprise licenses priced at USD 4750, USD 5250, and USD 8750 respectively.
10. Is the market size provided in terms of value or volume?
The market size is provided in terms of value, measured in Million.
11. Are there any specific market keywords associated with the report?
Yes, the market keyword associated with the report is "Process Automation Industry," which aids in identifying and referencing the specific market segment covered.
12. How do I determine which pricing option suits my needs best?
The pricing options vary based on user requirements and access needs. Individual users may opt for single-user licenses, while businesses requiring broader access may choose multi-user or enterprise licenses for cost-effective access to the report.
13. Are there any additional resources or data provided in the Process Automation Industry report?
While the report offers comprehensive insights, it's advisable to review the specific contents or supplementary materials provided to ascertain if additional resources or data are available.
14. How can I stay updated on further developments or reports in the Process Automation Industry?
To stay informed about further developments, trends, and reports in the Process Automation Industry, consider subscribing to industry newsletters, following relevant companies and organizations, or regularly checking reputable industry news sources and publications.
Methodology
Step 1 - Identification of Relevant Samples Size from Population Database


Step 2 - Approaches for Defining Global Market Size (Value, Volume* & Price*)

Note*: In applicable scenarios
Step 3 - Data Sources
Primary Research
- Web Analytics
- Survey Reports
- Research Institute
- Latest Research Reports
- Opinion Leaders
Secondary Research
- Annual Reports
- White Paper
- Latest Press Release
- Industry Association
- Paid Database
- Investor Presentations

Step 4 - Data Triangulation
Involves using different sources of information in order to increase the validity of a study
These sources are likely to be stakeholders in a program - participants, other researchers, program staff, other community members, and so on.
Then we put all data in single framework & apply various statistical tools to find out the dynamic on the market.
During the analysis stage, feedback from the stakeholder groups would be compared to determine areas of agreement as well as areas of divergence


