

Key Insights
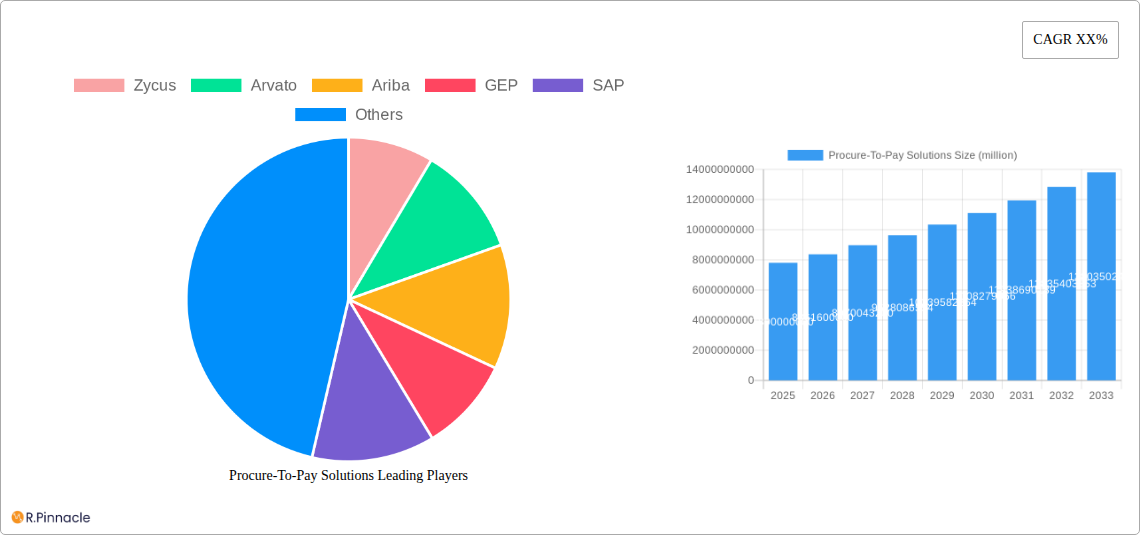
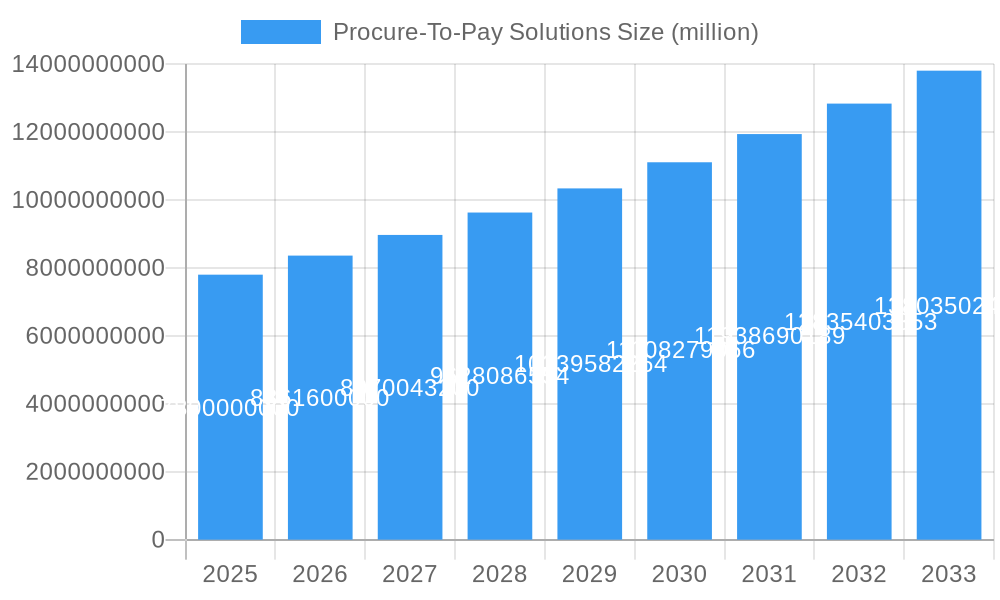
The Procure-to-Pay (P2P) solutions market, currently valued at approximately $11.08 billion in 2025, is experiencing robust growth, projected to expand at a Compound Annual Growth Rate (CAGR) of 6.8% from 2025 to 2033. This growth is fueled by several key factors. The increasing adoption of cloud-based solutions offers businesses greater scalability, accessibility, and cost-effectiveness compared to on-premises systems. Furthermore, the rising need for improved efficiency and transparency in procurement processes, particularly among Small and Medium-sized Enterprises (SMEs) and large enterprises alike, is driving demand. Automation of invoice processing, streamlined purchase order management, and enhanced supplier collaboration are key features that contribute to this market's expansion. The shift toward digital transformation across various industries is another significant driver, compelling businesses to seek sophisticated P2P systems for improved operational efficiency and reduced costs. While the market faces certain restraints such as the initial investment costs for implementation and integration challenges, the long-term benefits of improved financial control and reduced operational inefficiencies outweigh these drawbacks.
Procure To Pay Solutions Market Size (In Billion)
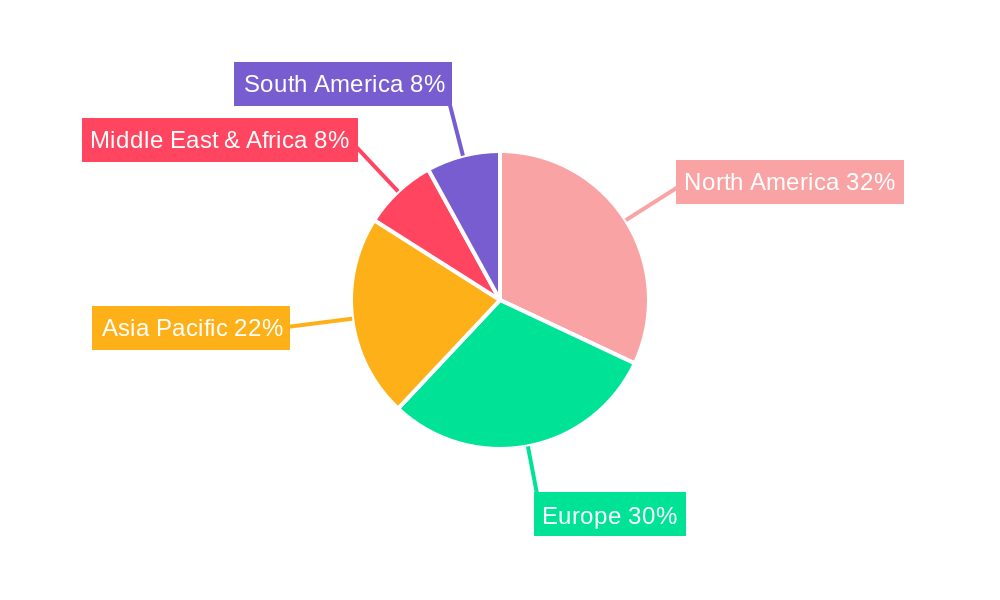
The market segmentation reveals a strong presence of both cloud-based and on-premises solutions catering to diverse business needs. Geographically, North America and Europe currently hold a significant market share, driven by early adoption and high technological maturity. However, the Asia-Pacific region is expected to witness substantial growth over the forecast period due to increasing digitalization efforts and economic expansion across countries like India and China. Key players like Zycus, Arvato, Ariba, GEP, SAP, Infosys, Comarch, and Proactis are actively shaping the competitive landscape through continuous innovation and strategic partnerships. The market is poised for further consolidation as companies seek to expand their offerings and cater to the evolving needs of businesses globally. The continuous integration of advanced technologies like AI and machine learning further enhances the capabilities of P2P solutions, creating new opportunities for market expansion and differentiation.
Procure To Pay Solutions Company Market Share
Unlock the Potential of Procure-to-Pay: A Comprehensive Market Report (2019-2033)
This in-depth report provides a comprehensive analysis of the Procure-to-Pay (P2P) solutions market, offering invaluable insights for industry professionals, investors, and strategic decision-makers. Covering the period from 2019 to 2033, with a focus on 2025, this report unveils the market's structure, dynamics, dominant segments, and future trajectory. Expect detailed analysis on market size (reaching billions), CAGR, and key players like Zycus, Arvato, Ariba, GEP, SAP, Infosys, Comarch, and Proactis, allowing you to navigate the complexities of this rapidly evolving landscape.
Procure To Pay Solutions Market Structure & Innovation Trends
This section analyzes the competitive landscape of the P2P solutions market, revealing market concentration, innovation drivers, and regulatory influences. We delve into the impact of mergers and acquisitions (M&A) activity, examining deal values and their effect on market share. The analysis includes:
- Market Concentration: The report will detail the market share held by key players like Zycus, Ariba, and SAP, illustrating the level of competition and dominance within the market. We predict a xx% market share for Zycus in 2025, and an overall market concentration ratio of xx.
- Innovation Drivers: Examination of factors driving innovation, including advancements in AI, automation, and cloud technologies. The report assesses the impact of these advancements on market growth and competitive advantage.
- Regulatory Frameworks: Analysis of relevant regulations and their effect on market dynamics, particularly regarding data privacy and security.
- Product Substitutes: Identification and evaluation of alternative solutions and their potential impact on market share.
- End-User Demographics: Detailed segmentation of the end-user market by industry, company size (SMEs and large enterprises), and geographical location.
- M&A Activities: Review of significant M&A deals in the P2P space during the historical period (2019-2024), including analysis of deal values (e.g., a xx million dollar acquisition of Company X by Company Y in 2022). We also project the number of M&A deals for the forecast period (2025-2033) to be around xx.
Procure To Pay Solutions Market Dynamics & Trends
This section provides a deep dive into the market dynamics, focusing on growth drivers, technological disruptions, consumer preferences, and competitive dynamics. Key aspects of this analysis include:
- Market Growth Drivers: Detailed exploration of factors fueling market expansion, including the rising demand for automation, enhanced efficiency, and improved cost savings. We project a CAGR of xx% for the forecast period (2025-2033).
- Technological Disruptions: Assessment of the impact of emerging technologies like AI, machine learning, and blockchain on the P2P market.
- Consumer Preferences: Analysis of evolving end-user needs and preferences, influencing the demand for specific P2P solutions.
- Competitive Dynamics: Examination of competitive strategies employed by key players, focusing on pricing, product differentiation, and market penetration. The market penetration rate is projected to reach xx% by 2033.
Dominant Regions & Segments in Procure To Pay Solutions
This section identifies the leading regions and segments within the P2P market. Detailed analysis will include:
Leading Regions: North America is expected to remain a dominant region due to high technological adoption and the presence of major players. However, the report analyzes the growth potential in other regions, including Europe and Asia-Pacific.
Application:
- SMEs: Analysis of market size, growth drivers (e.g., increasing adoption of cloud-based solutions, need for cost optimization), and challenges (e.g., limited budgets, lack of technical expertise). The market size for SMEs is projected to reach xx million by 2033.
- Large Enterprises: Analysis of market size, growth drivers (e.g., need for enhanced process visibility and control, complex procurement needs), and challenges (e.g., legacy systems, integration complexities). The market size for large enterprises is projected to reach xx million by 2033.
Type:
- Cloud-Based: Analysis of market size, growth drivers (e.g., scalability, cost-effectiveness, accessibility), and challenges (e.g., data security concerns, vendor lock-in). The market size for cloud-based solutions is projected to reach xx million by 2033.
- On-premises: Analysis of market size, growth drivers (e.g., greater control over data, enhanced security), and challenges (e.g., high upfront investment, limited scalability). The market size for on-premises solutions is projected to reach xx million by 2033.
Procure To Pay Solutions Product Innovations
This section summarizes the latest product developments, applications, and competitive advantages in the P2P market. Key technological trends and their market fit will be highlighted. The increasing integration of AI and machine learning into P2P platforms is driving significant innovation, enabling improved efficiency and cost savings. This leads to increased adoption across various industry segments and company sizes.
Report Scope & Segmentation Analysis
The report provides a detailed segmentation of the Procure-to-Pay solutions market based on application (SMEs, Large Enterprises) and type (Cloud-Based, On-premises). Each segment includes growth projections, market size estimations, and analysis of competitive dynamics. Market size for each segment is projected to xx million for the estimated year 2025.
Key Drivers of Procure To Pay Solutions Growth
Key drivers of P2P solutions market growth include the increasing need for automation, improved process efficiency, and reduced operational costs. Strong demand from large enterprises seeking to optimize their procurement processes and the increasing adoption of cloud-based solutions also contribute significantly. Government regulations and industry best practices further accelerate market growth.
Challenges in the Procure To Pay Solutions Sector
Challenges include the high initial investment required for implementation, the complexity of integrating with existing systems, and concerns regarding data security and privacy. Competition among established players and the emergence of new entrants also pose challenges. The potential for vendor lock-in and the need for skilled personnel are further constraints.
Emerging Opportunities in Procure To Pay Solutions
Emerging opportunities lie in the increasing adoption of AI and machine learning, the expansion into new geographical markets, and the development of specialized solutions for specific industries. The integration of blockchain technology for enhanced transparency and security also presents significant growth potential.
Leading Players in the Procure To Pay Solutions Market
- Zycus
- Arvato
- Ariba
- GEP
- SAP
- Infosys
- Comarch
- Proactis
Key Developments in Procure To Pay Solutions Industry
- 2022-Q3: Zycus launched a new AI-powered P2P solution.
- 2023-Q1: Ariba acquired a smaller P2P solution provider, expanding its market share.
- 2024-Q4: SAP announced a major upgrade to its P2P platform, incorporating enhanced analytics capabilities.
Future Outlook for Procure To Pay Solutions Market
The Procure-to-Pay solutions market is poised for significant growth in the coming years, driven by continued technological advancements, increasing demand for automation, and the expanding adoption of cloud-based solutions. The market will likely see further consolidation through mergers and acquisitions, along with the emergence of innovative solutions tailored to specific industry needs. This presents a plethora of opportunities for both established players and new entrants.
Procure To Pay Solutions Segmentation
-
1. Application
- 1.1. SMEs
- 1.2. Large Enterprises
-
2. Type
- 2.1. Cloud Based
- 2.2. On-premises
Procure To Pay Solutions Segmentation By Geography
-
1. North America
- 1.1. United States
- 1.2. Canada
- 1.3. Mexico
-
2. South America
- 2.1. Brazil
- 2.2. Argentina
- 2.3. Rest of South America
-
3. Europe
- 3.1. United Kingdom
- 3.2. Germany
- 3.3. France
- 3.4. Italy
- 3.5. Spain
- 3.6. Russia
- 3.7. Benelux
- 3.8. Nordics
- 3.9. Rest of Europe
-
4. Middle East & Africa
- 4.1. Turkey
- 4.2. Israel
- 4.3. GCC
- 4.4. North Africa
- 4.5. South Africa
- 4.6. Rest of Middle East & Africa
-
5. Asia Pacific
- 5.1. China
- 5.2. India
- 5.3. Japan
- 5.4. South Korea
- 5.5. ASEAN
- 5.6. Oceania
- 5.7. Rest of Asia Pacific
Procure To Pay Solutions Regional Market Share
Geographic Coverage of Procure To Pay Solutions
Procure To Pay Solutions REPORT HIGHLIGHTS
| Aspects | Details |
|---|---|
| Study Period | 2020-2034 |
| Base Year | 2025 |
| Estimated Year | 2026 |
| Forecast Period | 2026-2034 |
| Historical Period | 2020-2025 |
| Growth Rate | CAGR of 6.8% from 2020-2034 |
| Segmentation |
|
Table of Contents
- 1. Introduction
- 1.1. Research Scope
- 1.2. Market Segmentation
- 1.3. Research Objective
- 1.4. Definitions and Assumptions
- 2. Executive Summary
- 2.1. Market Snapshot
- 3. Market Dynamics
- 3.1. Market Drivers
- 3.2. Market Restrains
- 3.3. Market Trends
- 3.4. Market Opportunities
- 4. Market Factor Analysis
- 4.1. Porters Five Forces
- 4.1.1. Bargaining Power of Suppliers
- 4.1.2. Bargaining Power of Buyers
- 4.1.3. Threat of New Entrants
- 4.1.4. Threat of Substitutes
- 4.1.5. Competitive Rivalry
- 4.2. PESTEL analysis
- 4.3. BCG Analysis
- 4.3.1. Stars (High Growth, High Market Share)
- 4.3.2. Cash Cows (Low Growth, High Market Share)
- 4.3.3. Question Mark (High Growth, Low Market Share)
- 4.3.4. Dogs (Low Growth, Low Market Share)
- 4.4. Ansoff Matrix Analysis
- 4.5. Supply Chain Analysis
- 4.6. Regulatory Landscape
- 4.7. Current Market Potential and Opportunity Assessment (TAM–SAM–SOM Framework)
- 4.8. PRI Analyst Note
- 4.1. Porters Five Forces
- 5. Market Analysis, Insights and Forecast 2021-2033
- 5.1. Market Analysis, Insights and Forecast - by Application
- 5.1.1. SMEs
- 5.1.2. Large Enterprises
- 5.2. Market Analysis, Insights and Forecast - by Type
- 5.2.1. Cloud Based
- 5.2.2. On-premises
- 5.3. Market Analysis, Insights and Forecast - by Region
- 5.3.1. North America
- 5.3.2. South America
- 5.3.3. Europe
- 5.3.4. Middle East & Africa
- 5.3.5. Asia Pacific
- 5.1. Market Analysis, Insights and Forecast - by Application
- 6. Global Procure To Pay Solutions Analysis, Insights and Forecast, 2021-2033
- 6.1. Market Analysis, Insights and Forecast - by Application
- 6.1.1. SMEs
- 6.1.2. Large Enterprises
- 6.2. Market Analysis, Insights and Forecast - by Type
- 6.2.1. Cloud Based
- 6.2.2. On-premises
- 6.1. Market Analysis, Insights and Forecast - by Application
- 7. North America Procure To Pay Solutions Analysis, Insights and Forecast, 2020-2032
- 7.1. Market Analysis, Insights and Forecast - by Application
- 7.1.1. SMEs
- 7.1.2. Large Enterprises
- 7.2. Market Analysis, Insights and Forecast - by Type
- 7.2.1. Cloud Based
- 7.2.2. On-premises
- 7.1. Market Analysis, Insights and Forecast - by Application
- 8. South America Procure To Pay Solutions Analysis, Insights and Forecast, 2020-2032
- 8.1. Market Analysis, Insights and Forecast - by Application
- 8.1.1. SMEs
- 8.1.2. Large Enterprises
- 8.2. Market Analysis, Insights and Forecast - by Type
- 8.2.1. Cloud Based
- 8.2.2. On-premises
- 8.1. Market Analysis, Insights and Forecast - by Application
- 9. Europe Procure To Pay Solutions Analysis, Insights and Forecast, 2020-2032
- 9.1. Market Analysis, Insights and Forecast - by Application
- 9.1.1. SMEs
- 9.1.2. Large Enterprises
- 9.2. Market Analysis, Insights and Forecast - by Type
- 9.2.1. Cloud Based
- 9.2.2. On-premises
- 9.1. Market Analysis, Insights and Forecast - by Application
- 10. Middle East & Africa Procure To Pay Solutions Analysis, Insights and Forecast, 2020-2032
- 10.1. Market Analysis, Insights and Forecast - by Application
- 10.1.1. SMEs
- 10.1.2. Large Enterprises
- 10.2. Market Analysis, Insights and Forecast - by Type
- 10.2.1. Cloud Based
- 10.2.2. On-premises
- 10.1. Market Analysis, Insights and Forecast - by Application
- 11. Asia Pacific Procure To Pay Solutions Analysis, Insights and Forecast, 2020-2032
- 11.1. Market Analysis, Insights and Forecast - by Application
- 11.1.1. SMEs
- 11.1.2. Large Enterprises
- 11.2. Market Analysis, Insights and Forecast - by Type
- 11.2.1. Cloud Based
- 11.2.2. On-premises
- 11.1. Market Analysis, Insights and Forecast - by Application
- 12. Competitive Analysis
- 12.1. Company Profiles
- 12.1.1 Zycus
- 12.1.1.1. Company Overview
- 12.1.1.2. Products
- 12.1.1.3. Company Financials
- 12.1.1.4. SWOT Analysis
- 12.1.2 Arvato
- 12.1.2.1. Company Overview
- 12.1.2.2. Products
- 12.1.2.3. Company Financials
- 12.1.2.4. SWOT Analysis
- 12.1.3 Ariba
- 12.1.3.1. Company Overview
- 12.1.3.2. Products
- 12.1.3.3. Company Financials
- 12.1.3.4. SWOT Analysis
- 12.1.4 GEP
- 12.1.4.1. Company Overview
- 12.1.4.2. Products
- 12.1.4.3. Company Financials
- 12.1.4.4. SWOT Analysis
- 12.1.5 SAP
- 12.1.5.1. Company Overview
- 12.1.5.2. Products
- 12.1.5.3. Company Financials
- 12.1.5.4. SWOT Analysis
- 12.1.6 Infosys
- 12.1.6.1. Company Overview
- 12.1.6.2. Products
- 12.1.6.3. Company Financials
- 12.1.6.4. SWOT Analysis
- 12.1.7 Comarch
- 12.1.7.1. Company Overview
- 12.1.7.2. Products
- 12.1.7.3. Company Financials
- 12.1.7.4. SWOT Analysis
- 12.1.8 Proactis
- 12.1.8.1. Company Overview
- 12.1.8.2. Products
- 12.1.8.3. Company Financials
- 12.1.8.4. SWOT Analysis
- 12.1.1 Zycus
- 12.2. Market Entropy
- 12.2.1 Company's Key Areas Served
- 12.2.2 Recent Developments
- 12.3. Company Market Share Analysis 2025
- 12.3.1 Top 5 Companies Market Share Analysis
- 12.3.2 Top 3 Companies Market Share Analysis
- 12.4. List of Potential Customers
- 13. Research Methodology
List of Figures
- Figure 1: Global Procure To Pay Solutions Revenue Breakdown (million, %) by Region 2025 & 2033
- Figure 2: North America Procure To Pay Solutions Revenue (million), by Application 2025 & 2033
- Figure 3: North America Procure To Pay Solutions Revenue Share (%), by Application 2025 & 2033
- Figure 4: North America Procure To Pay Solutions Revenue (million), by Type 2025 & 2033
- Figure 5: North America Procure To Pay Solutions Revenue Share (%), by Type 2025 & 2033
- Figure 6: North America Procure To Pay Solutions Revenue (million), by Country 2025 & 2033
- Figure 7: North America Procure To Pay Solutions Revenue Share (%), by Country 2025 & 2033
- Figure 8: South America Procure To Pay Solutions Revenue (million), by Application 2025 & 2033
- Figure 9: South America Procure To Pay Solutions Revenue Share (%), by Application 2025 & 2033
- Figure 10: South America Procure To Pay Solutions Revenue (million), by Type 2025 & 2033
- Figure 11: South America Procure To Pay Solutions Revenue Share (%), by Type 2025 & 2033
- Figure 12: South America Procure To Pay Solutions Revenue (million), by Country 2025 & 2033
- Figure 13: South America Procure To Pay Solutions Revenue Share (%), by Country 2025 & 2033
- Figure 14: Europe Procure To Pay Solutions Revenue (million), by Application 2025 & 2033
- Figure 15: Europe Procure To Pay Solutions Revenue Share (%), by Application 2025 & 2033
- Figure 16: Europe Procure To Pay Solutions Revenue (million), by Type 2025 & 2033
- Figure 17: Europe Procure To Pay Solutions Revenue Share (%), by Type 2025 & 2033
- Figure 18: Europe Procure To Pay Solutions Revenue (million), by Country 2025 & 2033
- Figure 19: Europe Procure To Pay Solutions Revenue Share (%), by Country 2025 & 2033
- Figure 20: Middle East & Africa Procure To Pay Solutions Revenue (million), by Application 2025 & 2033
- Figure 21: Middle East & Africa Procure To Pay Solutions Revenue Share (%), by Application 2025 & 2033
- Figure 22: Middle East & Africa Procure To Pay Solutions Revenue (million), by Type 2025 & 2033
- Figure 23: Middle East & Africa Procure To Pay Solutions Revenue Share (%), by Type 2025 & 2033
- Figure 24: Middle East & Africa Procure To Pay Solutions Revenue (million), by Country 2025 & 2033
- Figure 25: Middle East & Africa Procure To Pay Solutions Revenue Share (%), by Country 2025 & 2033
- Figure 26: Asia Pacific Procure To Pay Solutions Revenue (million), by Application 2025 & 2033
- Figure 27: Asia Pacific Procure To Pay Solutions Revenue Share (%), by Application 2025 & 2033
- Figure 28: Asia Pacific Procure To Pay Solutions Revenue (million), by Type 2025 & 2033
- Figure 29: Asia Pacific Procure To Pay Solutions Revenue Share (%), by Type 2025 & 2033
- Figure 30: Asia Pacific Procure To Pay Solutions Revenue (million), by Country 2025 & 2033
- Figure 31: Asia Pacific Procure To Pay Solutions Revenue Share (%), by Country 2025 & 2033
List of Tables
- Table 1: Global Procure To Pay Solutions Revenue million Forecast, by Application 2020 & 2033
- Table 2: Global Procure To Pay Solutions Revenue million Forecast, by Type 2020 & 2033
- Table 3: Global Procure To Pay Solutions Revenue million Forecast, by Region 2020 & 2033
- Table 4: Global Procure To Pay Solutions Revenue million Forecast, by Application 2020 & 2033
- Table 5: Global Procure To Pay Solutions Revenue million Forecast, by Type 2020 & 2033
- Table 6: Global Procure To Pay Solutions Revenue million Forecast, by Country 2020 & 2033
- Table 7: United States Procure To Pay Solutions Revenue (million) Forecast, by Application 2020 & 2033
- Table 8: Canada Procure To Pay Solutions Revenue (million) Forecast, by Application 2020 & 2033
- Table 9: Mexico Procure To Pay Solutions Revenue (million) Forecast, by Application 2020 & 2033
- Table 10: Global Procure To Pay Solutions Revenue million Forecast, by Application 2020 & 2033
- Table 11: Global Procure To Pay Solutions Revenue million Forecast, by Type 2020 & 2033
- Table 12: Global Procure To Pay Solutions Revenue million Forecast, by Country 2020 & 2033
- Table 13: Brazil Procure To Pay Solutions Revenue (million) Forecast, by Application 2020 & 2033
- Table 14: Argentina Procure To Pay Solutions Revenue (million) Forecast, by Application 2020 & 2033
- Table 15: Rest of South America Procure To Pay Solutions Revenue (million) Forecast, by Application 2020 & 2033
- Table 16: Global Procure To Pay Solutions Revenue million Forecast, by Application 2020 & 2033
- Table 17: Global Procure To Pay Solutions Revenue million Forecast, by Type 2020 & 2033
- Table 18: Global Procure To Pay Solutions Revenue million Forecast, by Country 2020 & 2033
- Table 19: United Kingdom Procure To Pay Solutions Revenue (million) Forecast, by Application 2020 & 2033
- Table 20: Germany Procure To Pay Solutions Revenue (million) Forecast, by Application 2020 & 2033
- Table 21: France Procure To Pay Solutions Revenue (million) Forecast, by Application 2020 & 2033
- Table 22: Italy Procure To Pay Solutions Revenue (million) Forecast, by Application 2020 & 2033
- Table 23: Spain Procure To Pay Solutions Revenue (million) Forecast, by Application 2020 & 2033
- Table 24: Russia Procure To Pay Solutions Revenue (million) Forecast, by Application 2020 & 2033
- Table 25: Benelux Procure To Pay Solutions Revenue (million) Forecast, by Application 2020 & 2033
- Table 26: Nordics Procure To Pay Solutions Revenue (million) Forecast, by Application 2020 & 2033
- Table 27: Rest of Europe Procure To Pay Solutions Revenue (million) Forecast, by Application 2020 & 2033
- Table 28: Global Procure To Pay Solutions Revenue million Forecast, by Application 2020 & 2033
- Table 29: Global Procure To Pay Solutions Revenue million Forecast, by Type 2020 & 2033
- Table 30: Global Procure To Pay Solutions Revenue million Forecast, by Country 2020 & 2033
- Table 31: Turkey Procure To Pay Solutions Revenue (million) Forecast, by Application 2020 & 2033
- Table 32: Israel Procure To Pay Solutions Revenue (million) Forecast, by Application 2020 & 2033
- Table 33: GCC Procure To Pay Solutions Revenue (million) Forecast, by Application 2020 & 2033
- Table 34: North Africa Procure To Pay Solutions Revenue (million) Forecast, by Application 2020 & 2033
- Table 35: South Africa Procure To Pay Solutions Revenue (million) Forecast, by Application 2020 & 2033
- Table 36: Rest of Middle East & Africa Procure To Pay Solutions Revenue (million) Forecast, by Application 2020 & 2033
- Table 37: Global Procure To Pay Solutions Revenue million Forecast, by Application 2020 & 2033
- Table 38: Global Procure To Pay Solutions Revenue million Forecast, by Type 2020 & 2033
- Table 39: Global Procure To Pay Solutions Revenue million Forecast, by Country 2020 & 2033
- Table 40: China Procure To Pay Solutions Revenue (million) Forecast, by Application 2020 & 2033
- Table 41: India Procure To Pay Solutions Revenue (million) Forecast, by Application 2020 & 2033
- Table 42: Japan Procure To Pay Solutions Revenue (million) Forecast, by Application 2020 & 2033
- Table 43: South Korea Procure To Pay Solutions Revenue (million) Forecast, by Application 2020 & 2033
- Table 44: ASEAN Procure To Pay Solutions Revenue (million) Forecast, by Application 2020 & 2033
- Table 45: Oceania Procure To Pay Solutions Revenue (million) Forecast, by Application 2020 & 2033
- Table 46: Rest of Asia Pacific Procure To Pay Solutions Revenue (million) Forecast, by Application 2020 & 2033
Frequently Asked Questions
1. What is the projected Compound Annual Growth Rate (CAGR) of the Procure To Pay Solutions?
The projected CAGR is approximately 6.8%.
2. Which companies are prominent players in the Procure To Pay Solutions?
Key companies in the market include Zycus, Arvato, Ariba, GEP, SAP, Infosys, Comarch, Proactis.
3. What are the main segments of the Procure To Pay Solutions?
The market segments include Application, Type.
4. Can you provide details about the market size?
The market size is estimated to be USD 11080 million as of 2022.
5. What are some drivers contributing to market growth?
N/A
6. What are the notable trends driving market growth?
N/A
7. Are there any restraints impacting market growth?
N/A
8. Can you provide examples of recent developments in the market?
N/A
9. What pricing options are available for accessing the report?
Pricing options include single-user, multi-user, and enterprise licenses priced at USD 2900.00, USD 4350.00, and USD 5800.00 respectively.
10. Is the market size provided in terms of value or volume?
The market size is provided in terms of value, measured in million.
11. Are there any specific market keywords associated with the report?
Yes, the market keyword associated with the report is "Procure To Pay Solutions," which aids in identifying and referencing the specific market segment covered.
12. How do I determine which pricing option suits my needs best?
The pricing options vary based on user requirements and access needs. Individual users may opt for single-user licenses, while businesses requiring broader access may choose multi-user or enterprise licenses for cost-effective access to the report.
13. Are there any additional resources or data provided in the Procure To Pay Solutions report?
While the report offers comprehensive insights, it's advisable to review the specific contents or supplementary materials provided to ascertain if additional resources or data are available.
14. How can I stay updated on further developments or reports in the Procure To Pay Solutions?
To stay informed about further developments, trends, and reports in the Procure To Pay Solutions, consider subscribing to industry newsletters, following relevant companies and organizations, or regularly checking reputable industry news sources and publications.
Methodology
Step 1 - Identification of Relevant Samples Size from Population Database


Step 2 - Approaches for Defining Global Market Size (Value, Volume* & Price*)

Note*: In applicable scenarios
Step 3 - Data Sources
Primary Research
- Web Analytics
- Survey Reports
- Research Institute
- Latest Research Reports
- Opinion Leaders
Secondary Research
- Annual Reports
- White Paper
- Latest Press Release
- Industry Association
- Paid Database
- Investor Presentations

Step 4 - Data Triangulation
Involves using different sources of information in order to increase the validity of a study
These sources are likely to be stakeholders in a program - participants, other researchers, program staff, other community members, and so on.
Then we put all data in single framework & apply various statistical tools to find out the dynamic on the market.
During the analysis stage, feedback from the stakeholder groups would be compared to determine areas of agreement as well as areas of divergence