
Key Insights
The Service Integration and Management (SIAM) market is experiencing robust growth, driven by the increasing complexity of IT environments and the rising demand for efficient IT service delivery across diverse organizations. The market's Compound Annual Growth Rate (CAGR) of 9.20% from 2019 to 2024 suggests a strong upward trajectory, projected to continue into the forecast period (2025-2033). Key drivers include the growing adoption of cloud computing, the need for improved IT service visibility and control, and the increasing pressure on organizations to optimize IT costs and improve operational efficiency. The diverse range of end-user industries, including BFSI, IT and Telecom, Healthcare, and Retail, contribute to the market's expansion, with large enterprises currently representing a significant portion of the market share. However, the increasing adoption of SIAM solutions by small and medium enterprises (SMEs) presents a significant growth opportunity. Technological advancements, such as AI-powered automation and advanced analytics, are further fueling market expansion by improving service delivery, reducing operational costs, and enhancing the overall customer experience.
While the market exhibits strong growth potential, challenges such as the need for skilled professionals and the complexities of integrating disparate IT systems pose potential restraints. Overcoming these challenges through strategic partnerships, investment in employee training, and the adoption of robust integration platforms will be crucial for sustained growth. The competitive landscape is characterized by a mix of established players like Wipro, Infosys, Accenture, and IBM, alongside emerging niche providers. These companies are investing heavily in research and development to enhance their service offerings and cater to evolving market demands. The regional distribution shows a strong presence in North America and Europe, reflecting the high adoption rates in these regions. However, growth in the Asia Pacific region is expected to be significant in the coming years, driven by increasing digital transformation initiatives across various industries in countries like India, China, and Japan. The projected market size in 2025 serves as a strong base for continued expansion, indicating a lucrative market for both established and emerging players.
Service Integration and Management (SIAM) Market Report: 2019-2033
This comprehensive report provides an in-depth analysis of the Service Integration and Management (SIAM) industry, offering invaluable insights for industry professionals, investors, and strategic decision-makers. With a focus on market dynamics, key players, and future trends, this report covers the period from 2019 to 2033, with a base year of 2025 and a forecast period of 2025-2033. The report analyzes a market valued at millions of USD, providing actionable intelligence to navigate the complexities of this rapidly evolving sector.
Service Integration and Management Industry Market Structure & Innovation Trends
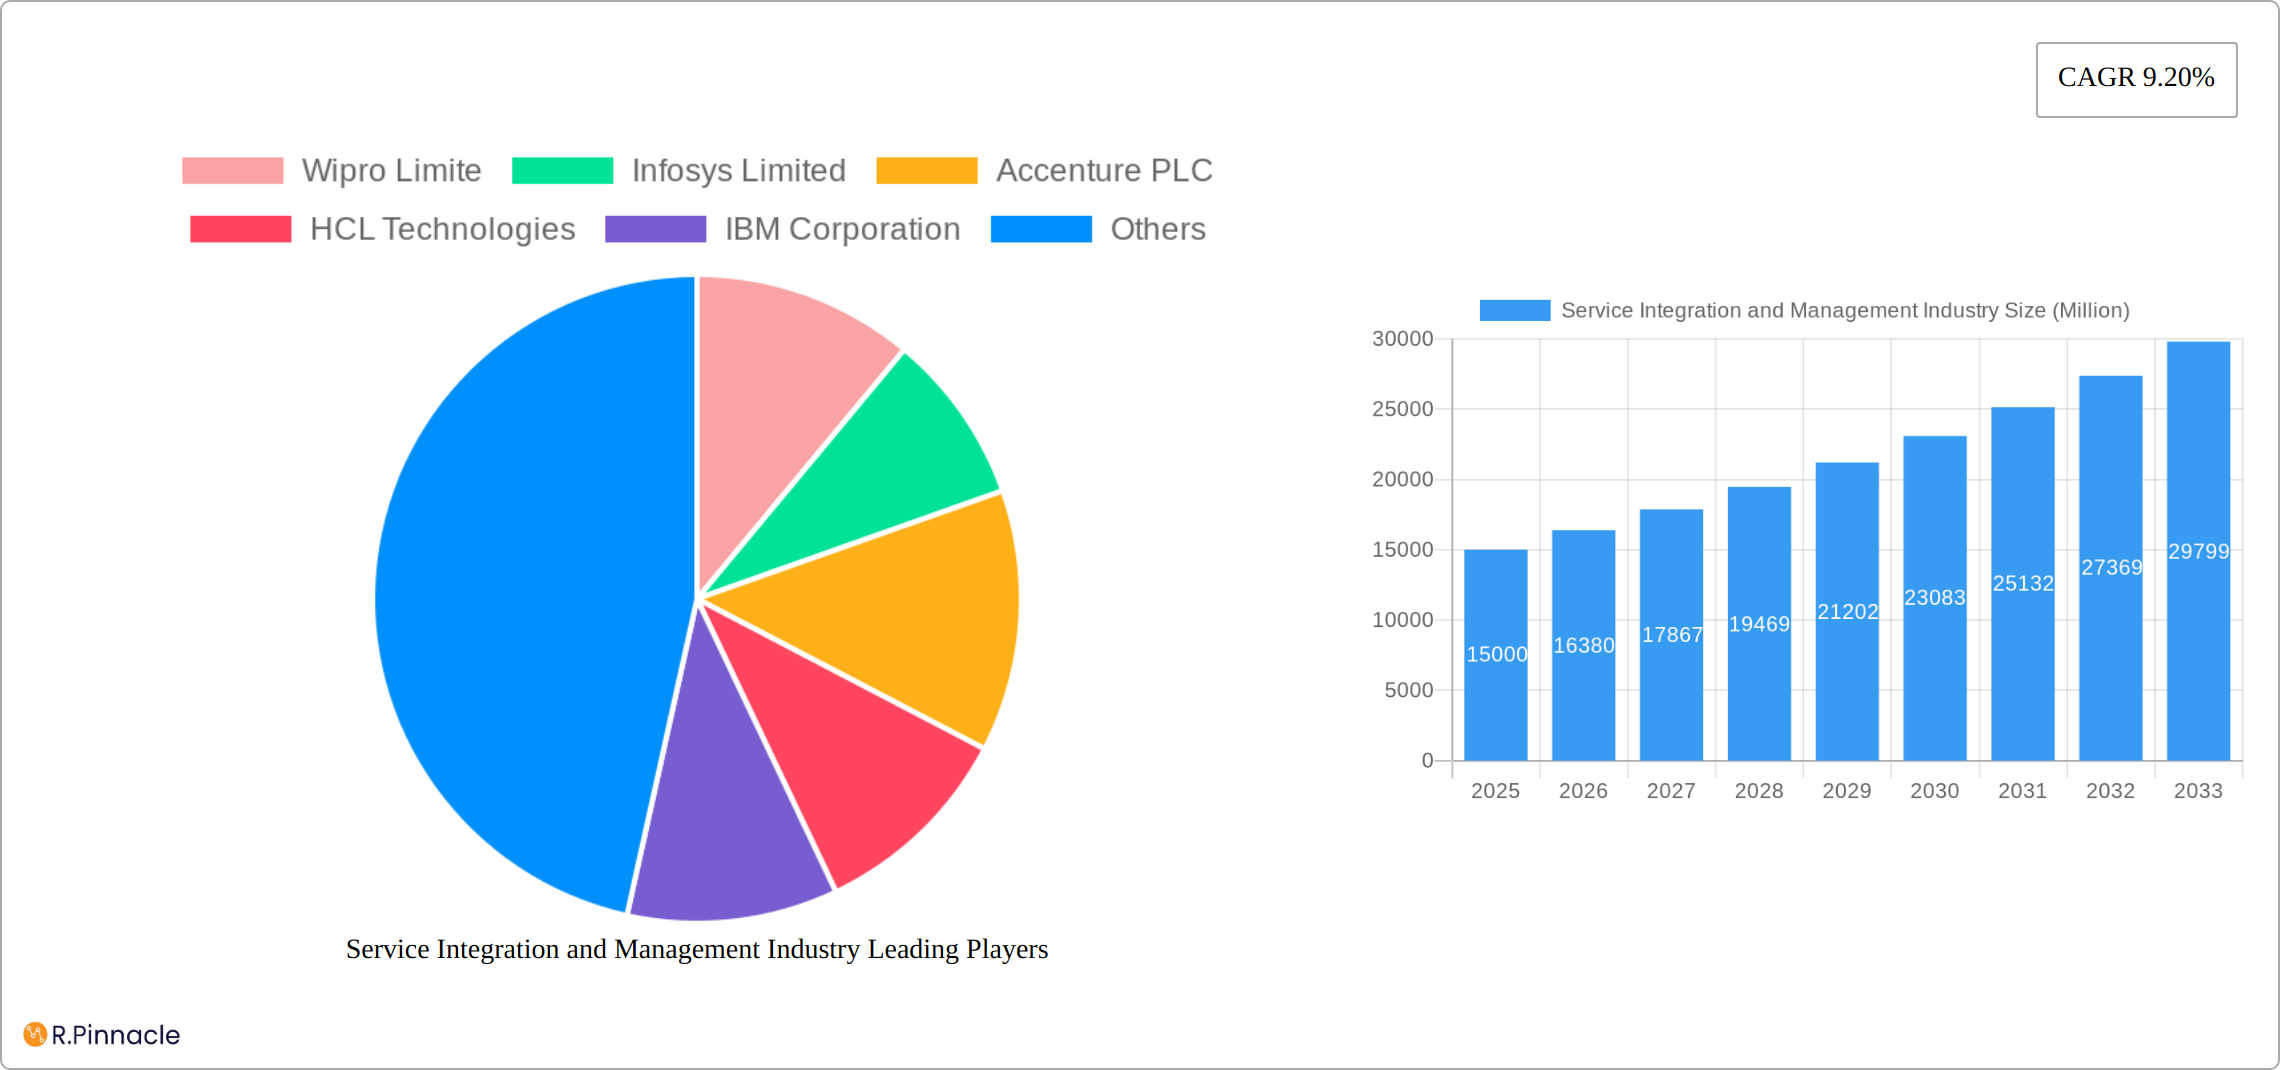
The SIAM market exhibits a moderately concentrated structure, with key players like Wipro, Infosys, Accenture, HCL Technologies, IBM, Capgemini, HPE, Fujitsu, Mindtree, and Atos holding significant market share. Precise market share figures for 2024 are unavailable (xx%), but competitive analysis reveals a dynamic landscape characterized by both organic growth and strategic mergers and acquisitions (M&A). Innovation is driven primarily by the increasing adoption of cloud computing, automation, and AI-powered solutions to enhance service integration capabilities. Regulatory frameworks, varying across geographies, influence market access and operational strategies. Product substitutes, such as bespoke in-house solutions, present a niche competitive threat, although the scalability and cost-effectiveness of SIAM solutions generally outweigh the benefits of alternative approaches. The end-user demographic comprises a diverse range of enterprises, from small and medium enterprises (SMEs) to large multinational corporations, across various sectors. M&A activity in recent years has involved deals valued at millions of USD, with larger players strategically acquiring smaller companies to expand their service portfolios and market reach. For instance, a recent acquisition worth approximately $XX million resulted in significant market share consolidation.
Service Integration and Management Industry Market Dynamics & Trends
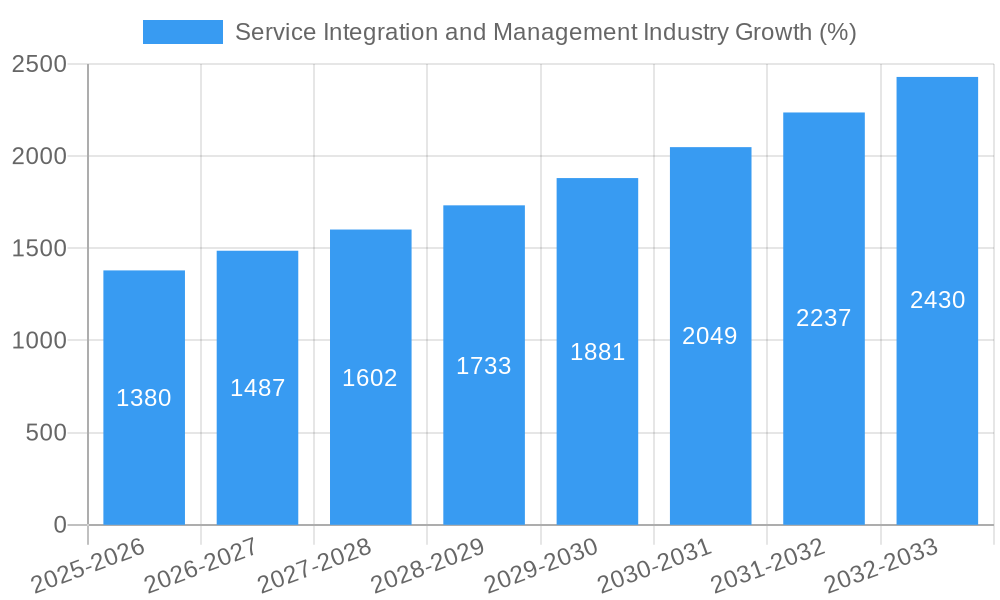
The Service Integration and Management (SIAM) market is experiencing a period of significant and sustained growth. This upward trajectory is being propelled by a confluence of factors, most notably the escalating complexity inherent in modern IT environments. As organizations grapple with increasingly intricate technology stacks, the demand for streamlined, efficient, and cost-optimized IT service delivery has become paramount. During the historical period spanning 2019-2024, the market demonstrated a robust Compound Annual Growth Rate (CAGR) of approximately [Insert Actual CAGR]%. Looking ahead, this strong momentum is projected to continue, with an estimated CAGR of [Insert Forecasted CAGR]% expected for the forecast period from 2025 to 2033.
The industry is being profoundly reshaped by rapid technological advancements. The pervasive adoption of cloud-based solutions, coupled with the transformative potential of Artificial Intelligence (AI) and Machine Learning (ML), is fundamentally altering how IT services are integrated and managed. Concurrently, evolving consumer preferences are driving a clear shift towards flexible, scalable, and economically viable SIAM solutions that can seamlessly integrate with existing IT infrastructures, minimizing disruption and maximizing utility.
The competitive landscape is characterized by its intensity. Established market leaders are actively engaged in continuous innovation and the expansion of their service portfolios to maintain their competitive edge. Simultaneously, a wave of new entrants is emerging, bringing disruptive technologies and agile business models to the fore. Market penetration varies considerably across different end-user industries. Sectors such as Banking, Financial Services, and Insurance (BFSI) and Information Technology & Telecommunications are exhibiting higher adoption rates, indicating a strong embrace of SIAM principles, while other industries are at various stages of engagement.
Dominant Regions & Segments in Service Integration and Management Industry
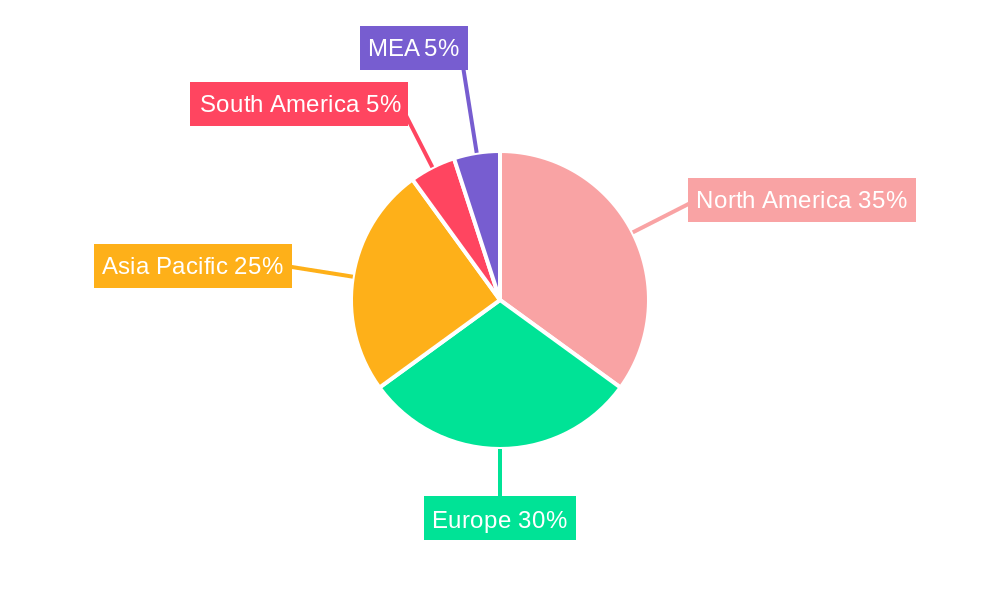
Currently, the North American region commands a leading position within the global SIAM market, closely followed by Europe and the Asia Pacific region. This regional dominance can be attributed to several key factors, including substantial IT spending, the presence of a mature and robust technological infrastructure, and the concentration of major SIAM service providers and large enterprises with sophisticated IT needs.
- By Component: The Solutions segment is currently outpacing the Services segment in terms of growth. This accelerated expansion is largely driven by the increasing demand for advanced, intelligent, and automated SIAM solutions that offer enhanced capabilities for managing complex IT environments.
- By Organization Size: Large enterprises continue to represent the largest share of market revenue. Their extensive and intricate IT landscapes, coupled with significant budgets allocated for IT modernization and optimization, make them primary adopters of comprehensive SIAM strategies. However, Small and Medium-sized Enterprises (SMEs) are demonstrating a notable increase in adoption rates. This trend is primarily fueled by the cost-effectiveness and substantial efficiency gains that outsourced service integration can deliver, making sophisticated IT management accessible to a broader range of businesses.
- By End-user Industry: The BFSI and IT & Telecom sectors remain the leading segments in SIAM adoption. For BFSI, stringent regulatory compliance mandates and the critical importance of safeguarding high-value data assets underscore the necessity of robust and secure service integration. The inherent complexity and rapid evolution of the IT & Telecom sector also necessitate efficient and agile SIAM solutions to manage diverse service portfolios. The Healthcare and Retail industries are witnessing particularly significant growth, propelled by their ongoing and ambitious digital transformation initiatives, which require sophisticated IT service management to support new digital services and customer experiences.
The primary drivers underpinning these dominant segments exhibit regional and sectoral variations. In North America, high IT investment and a well-established technological ecosystem are significant contributors. Globally, the BFSI sector's adoption is heavily influenced by evolving regulatory landscapes and the imperative for data security. For large enterprises, the sheer complexity and scale of their IT systems are the most potent drivers for embracing advanced SIAM practices.
Service Integration and Management Industry Product Innovations
The forefront of recent product innovations in the SIAM market is characterized by advancements in automation, the integration of AI-powered analytics, and the development of cloud-native solutions. These innovations are strategically designed to significantly enhance service delivery efficiency, drive down operational costs, and elevate the overall quality and reliability of IT services. A prevailing trend is the development of integrated platforms that provide a unified, comprehensive view of all IT services. This holistic visibility enables proactive monitoring, predictive issue resolution, and optimized resource allocation, directly addressing the growing market demand for enhanced service assurance and tangible reductions in operational expenditures.
Report Scope & Segmentation Analysis
This report segments the SIAM market across multiple dimensions:
- By Component: Solutions and Services, providing detailed analysis of growth projections, market size, and competitive dynamics within each segment.
- By Organization Size: Small and Medium Enterprises (SMEs) and Large Enterprises, examining the unique characteristics and growth potential of each segment.
- By End-user Industry: BFSI, IT and Telecom, Healthcare, Retail, and Other End-user Industries, offering a sector-specific outlook on SIAM adoption trends. Each segment shows projected growth rates and size estimates in millions of USD.
Key Drivers of Service Integration and Management Industry Growth
The SIAM market is propelled by several key growth factors:
- Technological advancements: Cloud computing, AI, and automation are driving efficiency and cost optimization, attracting wider adoption.
- Increased IT complexity: The increasing complexity of IT infrastructure necessitates sophisticated management solutions, increasing demand for SIAM.
- Regulatory pressures: Compliance requirements, particularly in sectors like BFSI, push organizations toward improved service integration and risk management practices.
Challenges in the Service Integration and Management Industry Sector
The SIAM industry faces significant challenges, including:
- Integration complexities: Integrating diverse IT systems and services can be technically challenging and time-consuming.
- Skill shortages: A lack of skilled professionals with expertise in SIAM solutions limits effective implementation.
- Competitive pressures: The market is highly competitive, with established players and new entrants vying for market share, pressuring profit margins.
Emerging Opportunities in Service Integration and Management Industry
The dynamic SIAM market presents a rich landscape of emerging opportunities:
- Expansion into Untapped Markets: Significant growth potential lies in extending SIAM solutions and services into emerging economies and specific, currently underserved industry sectors that are beginning to recognize the value of integrated IT management.
- Development of Innovative Solutions: There is a substantial opportunity for the creation and refinement of advanced AI-powered solutions, intelligent automation tools, and robust cloud-native platforms specifically designed to address complex service integration challenges and deliver greater value.
- Focus on Digital Transformation Enablement: As organizations worldwide deepen their commitment to digital transformation initiatives, the demand for effective SIAM services to support these complex, technology-driven changes is poised to grow substantially. This includes enabling new digital business models and ensuring the seamless operation of digital customer journeys.
- Specialized Industry Solutions: Developing tailored SIAM solutions that address the unique regulatory, operational, and security needs of specific industries (e.g., IoT in manufacturing, data privacy in healthcare) presents a significant avenue for growth and differentiation.
Leading Players in the Service Integration and Management Industry Market
- Wipro Limited
- Infosys Limited
- Accenture PLC
- HCL Technologies
- IBM Corporation
- Capgemini SE
- Hewlett Packard Enterprise (HPE)
- Fujitsu Limited
- Mindtree Limited
- Atos SE
Key Developments in Service Integration and Management Industry
- August 2021: Perspecta Enterprise Solutions LLC, partnered with Capgemini Government Solutions LLC, secured a USD 2 billion BPA (HT001521A0002) for the Military Health System Enterprise Information Technology Services Integrator (EITSI) contract. This highlights the growing demand for large-scale SIAM solutions in the government sector.
- March 2020: Infosys and IBM partnered to accelerate digital transformation for enterprises using IBM cloud services, particularly within regulated industries like BFSI and healthcare. This collaboration underscores the increasing importance of cloud technologies in SIAM solutions.
Future Outlook for Service Integration and Management Industry Market
The SIAM market is poised for continued growth, driven by increasing digital transformation initiatives, the growing complexity of IT landscapes, and the ongoing demand for cost-effective and efficient service management. The adoption of cloud-based solutions, AI, and automation will remain key drivers of innovation and market expansion. Strategic partnerships and acquisitions will continue to reshape the competitive landscape, creating opportunities for both established players and new entrants to carve out their market positions. The future growth potential is significant, with projections indicating a continued rise in market size and increasing penetration across various industries and geographies.
Service Integration and Management Industry Segmentation
-
1. Component
-
1.1. Solutions
- 1.1.1. Business Solutions
- 1.1.2. Technology Solutions
- 1.2. Services
-
1.1. Solutions
-
2. Organization Size
- 2.1. Small and Medium Enterprises
- 2.2. Large Enterprises
-
3. End user Industry
- 3.1. BFSI
- 3.2. IT and Telecom
- 3.3. Healthcare
- 3.4. Retail
- 3.5. Other End-user Industries
Service Integration and Management Industry Segmentation By Geography
- 1. North America
- 2. Europe
- 3. Asia Pacific
- 4. Rest of the World
Service Integration and Management Industry REPORT HIGHLIGHTS
| Aspects | Details |
|---|---|
| Study Period | 2019-2033 |
| Base Year | 2024 |
| Estimated Year | 2025 |
| Forecast Period | 2025-2033 |
| Historical Period | 2019-2024 |
| Growth Rate | CAGR of 9.20% from 2019-2033 |
| Segmentation |
|
Table of Contents
- 1. Introduction
- 1.1. Research Scope
- 1.2. Market Segmentation
- 1.3. Research Methodology
- 1.4. Definitions and Assumptions
- 2. Executive Summary
- 2.1. Introduction
- 3. Market Dynamics
- 3.1. Introduction
- 3.2. Market Drivers
- 3.2.1. Increasing Complexities of Service Management; Increasing Demand for Multi-Vendor Outsourcing
- 3.3. Market Restrains
- 3.3.1. Lack of Uniform SLAs and Regulatory Compliances
- 3.4. Market Trends
- 3.4.1. Cloud Technology to witness significant growth
- 4. Market Factor Analysis
- 4.1. Porters Five Forces
- 4.2. Supply/Value Chain
- 4.3. PESTEL analysis
- 4.4. Market Entropy
- 4.5. Patent/Trademark Analysis
- 5. Global Service Integration and Management Industry Analysis, Insights and Forecast, 2019-2031
- 5.1. Market Analysis, Insights and Forecast - by Component
- 5.1.1. Solutions
- 5.1.1.1. Business Solutions
- 5.1.1.2. Technology Solutions
- 5.1.2. Services
- 5.1.1. Solutions
- 5.2. Market Analysis, Insights and Forecast - by Organization Size
- 5.2.1. Small and Medium Enterprises
- 5.2.2. Large Enterprises
- 5.3. Market Analysis, Insights and Forecast - by End user Industry
- 5.3.1. BFSI
- 5.3.2. IT and Telecom
- 5.3.3. Healthcare
- 5.3.4. Retail
- 5.3.5. Other End-user Industries
- 5.4. Market Analysis, Insights and Forecast - by Region
- 5.4.1. North America
- 5.4.2. Europe
- 5.4.3. Asia Pacific
- 5.4.4. Rest of the World
- 5.1. Market Analysis, Insights and Forecast - by Component
- 6. North America Service Integration and Management Industry Analysis, Insights and Forecast, 2019-2031
- 6.1. Market Analysis, Insights and Forecast - by Component
- 6.1.1. Solutions
- 6.1.1.1. Business Solutions
- 6.1.1.2. Technology Solutions
- 6.1.2. Services
- 6.1.1. Solutions
- 6.2. Market Analysis, Insights and Forecast - by Organization Size
- 6.2.1. Small and Medium Enterprises
- 6.2.2. Large Enterprises
- 6.3. Market Analysis, Insights and Forecast - by End user Industry
- 6.3.1. BFSI
- 6.3.2. IT and Telecom
- 6.3.3. Healthcare
- 6.3.4. Retail
- 6.3.5. Other End-user Industries
- 6.1. Market Analysis, Insights and Forecast - by Component
- 7. Europe Service Integration and Management Industry Analysis, Insights and Forecast, 2019-2031
- 7.1. Market Analysis, Insights and Forecast - by Component
- 7.1.1. Solutions
- 7.1.1.1. Business Solutions
- 7.1.1.2. Technology Solutions
- 7.1.2. Services
- 7.1.1. Solutions
- 7.2. Market Analysis, Insights and Forecast - by Organization Size
- 7.2.1. Small and Medium Enterprises
- 7.2.2. Large Enterprises
- 7.3. Market Analysis, Insights and Forecast - by End user Industry
- 7.3.1. BFSI
- 7.3.2. IT and Telecom
- 7.3.3. Healthcare
- 7.3.4. Retail
- 7.3.5. Other End-user Industries
- 7.1. Market Analysis, Insights and Forecast - by Component
- 8. Asia Pacific Service Integration and Management Industry Analysis, Insights and Forecast, 2019-2031
- 8.1. Market Analysis, Insights and Forecast - by Component
- 8.1.1. Solutions
- 8.1.1.1. Business Solutions
- 8.1.1.2. Technology Solutions
- 8.1.2. Services
- 8.1.1. Solutions
- 8.2. Market Analysis, Insights and Forecast - by Organization Size
- 8.2.1. Small and Medium Enterprises
- 8.2.2. Large Enterprises
- 8.3. Market Analysis, Insights and Forecast - by End user Industry
- 8.3.1. BFSI
- 8.3.2. IT and Telecom
- 8.3.3. Healthcare
- 8.3.4. Retail
- 8.3.5. Other End-user Industries
- 8.1. Market Analysis, Insights and Forecast - by Component
- 9. Rest of the World Service Integration and Management Industry Analysis, Insights and Forecast, 2019-2031
- 9.1. Market Analysis, Insights and Forecast - by Component
- 9.1.1. Solutions
- 9.1.1.1. Business Solutions
- 9.1.1.2. Technology Solutions
- 9.1.2. Services
- 9.1.1. Solutions
- 9.2. Market Analysis, Insights and Forecast - by Organization Size
- 9.2.1. Small and Medium Enterprises
- 9.2.2. Large Enterprises
- 9.3. Market Analysis, Insights and Forecast - by End user Industry
- 9.3.1. BFSI
- 9.3.2. IT and Telecom
- 9.3.3. Healthcare
- 9.3.4. Retail
- 9.3.5. Other End-user Industries
- 9.1. Market Analysis, Insights and Forecast - by Component
- 10. North America Service Integration and Management Industry Analysis, Insights and Forecast, 2019-2031
- 10.1. Market Analysis, Insights and Forecast - By Country/Sub-region
- 10.1.1 United States
- 10.1.2 Canada
- 10.1.3 Mexico
- 11. Europe Service Integration and Management Industry Analysis, Insights and Forecast, 2019-2031
- 11.1. Market Analysis, Insights and Forecast - By Country/Sub-region
- 11.1.1 Germany
- 11.1.2 United Kingdom
- 11.1.3 France
- 11.1.4 Spain
- 11.1.5 Italy
- 11.1.6 Spain
- 11.1.7 Belgium
- 11.1.8 Netherland
- 11.1.9 Nordics
- 11.1.10 Rest of Europe
- 12. Asia Pacific Service Integration and Management Industry Analysis, Insights and Forecast, 2019-2031
- 12.1. Market Analysis, Insights and Forecast - By Country/Sub-region
- 12.1.1 China
- 12.1.2 Japan
- 12.1.3 India
- 12.1.4 South Korea
- 12.1.5 Southeast Asia
- 12.1.6 Australia
- 12.1.7 Indonesia
- 12.1.8 Phillipes
- 12.1.9 Singapore
- 12.1.10 Thailandc
- 12.1.11 Rest of Asia Pacific
- 13. South America Service Integration and Management Industry Analysis, Insights and Forecast, 2019-2031
- 13.1. Market Analysis, Insights and Forecast - By Country/Sub-region
- 13.1.1 Brazil
- 13.1.2 Argentina
- 13.1.3 Peru
- 13.1.4 Chile
- 13.1.5 Colombia
- 13.1.6 Ecuador
- 13.1.7 Venezuela
- 13.1.8 Rest of South America
- 14. North America Service Integration and Management Industry Analysis, Insights and Forecast, 2019-2031
- 14.1. Market Analysis, Insights and Forecast - By Country/Sub-region
- 14.1.1 United States
- 14.1.2 Canada
- 14.1.3 Mexico
- 15. MEA Service Integration and Management Industry Analysis, Insights and Forecast, 2019-2031
- 15.1. Market Analysis, Insights and Forecast - By Country/Sub-region
- 15.1.1 United Arab Emirates
- 15.1.2 Saudi Arabia
- 15.1.3 South Africa
- 15.1.4 Rest of Middle East and Africa
- 16. Competitive Analysis
- 16.1. Global Market Share Analysis 2024
- 16.2. Company Profiles
- 16.2.1 Wipro Limite
- 16.2.1.1. Overview
- 16.2.1.2. Products
- 16.2.1.3. SWOT Analysis
- 16.2.1.4. Recent Developments
- 16.2.1.5. Financials (Based on Availability)
- 16.2.2 Infosys Limited
- 16.2.2.1. Overview
- 16.2.2.2. Products
- 16.2.2.3. SWOT Analysis
- 16.2.2.4. Recent Developments
- 16.2.2.5. Financials (Based on Availability)
- 16.2.3 Accenture PLC
- 16.2.3.1. Overview
- 16.2.3.2. Products
- 16.2.3.3. SWOT Analysis
- 16.2.3.4. Recent Developments
- 16.2.3.5. Financials (Based on Availability)
- 16.2.4 HCL Technologies
- 16.2.4.1. Overview
- 16.2.4.2. Products
- 16.2.4.3. SWOT Analysis
- 16.2.4.4. Recent Developments
- 16.2.4.5. Financials (Based on Availability)
- 16.2.5 IBM Corporation
- 16.2.5.1. Overview
- 16.2.5.2. Products
- 16.2.5.3. SWOT Analysis
- 16.2.5.4. Recent Developments
- 16.2.5.5. Financials (Based on Availability)
- 16.2.6 Capgemini SE
- 16.2.6.1. Overview
- 16.2.6.2. Products
- 16.2.6.3. SWOT Analysis
- 16.2.6.4. Recent Developments
- 16.2.6.5. Financials (Based on Availability)
- 16.2.7 Hewlett Packard Enterprise (HPE)
- 16.2.7.1. Overview
- 16.2.7.2. Products
- 16.2.7.3. SWOT Analysis
- 16.2.7.4. Recent Developments
- 16.2.7.5. Financials (Based on Availability)
- 16.2.8 Fujitsu Limited
- 16.2.8.1. Overview
- 16.2.8.2. Products
- 16.2.8.3. SWOT Analysis
- 16.2.8.4. Recent Developments
- 16.2.8.5. Financials (Based on Availability)
- 16.2.9 Mindtree Limited
- 16.2.9.1. Overview
- 16.2.9.2. Products
- 16.2.9.3. SWOT Analysis
- 16.2.9.4. Recent Developments
- 16.2.9.5. Financials (Based on Availability)
- 16.2.10 AtoS SE
- 16.2.10.1. Overview
- 16.2.10.2. Products
- 16.2.10.3. SWOT Analysis
- 16.2.10.4. Recent Developments
- 16.2.10.5. Financials (Based on Availability)
- 16.2.1 Wipro Limite
List of Figures
- Figure 1: Global Service Integration and Management Industry Revenue Breakdown (Million, %) by Region 2024 & 2032
- Figure 2: North America Service Integration and Management Industry Revenue (Million), by Country 2024 & 2032
- Figure 3: North America Service Integration and Management Industry Revenue Share (%), by Country 2024 & 2032
- Figure 4: Europe Service Integration and Management Industry Revenue (Million), by Country 2024 & 2032
- Figure 5: Europe Service Integration and Management Industry Revenue Share (%), by Country 2024 & 2032
- Figure 6: Asia Pacific Service Integration and Management Industry Revenue (Million), by Country 2024 & 2032
- Figure 7: Asia Pacific Service Integration and Management Industry Revenue Share (%), by Country 2024 & 2032
- Figure 8: South America Service Integration and Management Industry Revenue (Million), by Country 2024 & 2032
- Figure 9: South America Service Integration and Management Industry Revenue Share (%), by Country 2024 & 2032
- Figure 10: North America Service Integration and Management Industry Revenue (Million), by Country 2024 & 2032
- Figure 11: North America Service Integration and Management Industry Revenue Share (%), by Country 2024 & 2032
- Figure 12: MEA Service Integration and Management Industry Revenue (Million), by Country 2024 & 2032
- Figure 13: MEA Service Integration and Management Industry Revenue Share (%), by Country 2024 & 2032
- Figure 14: North America Service Integration and Management Industry Revenue (Million), by Component 2024 & 2032
- Figure 15: North America Service Integration and Management Industry Revenue Share (%), by Component 2024 & 2032
- Figure 16: North America Service Integration and Management Industry Revenue (Million), by Organization Size 2024 & 2032
- Figure 17: North America Service Integration and Management Industry Revenue Share (%), by Organization Size 2024 & 2032
- Figure 18: North America Service Integration and Management Industry Revenue (Million), by End user Industry 2024 & 2032
- Figure 19: North America Service Integration and Management Industry Revenue Share (%), by End user Industry 2024 & 2032
- Figure 20: North America Service Integration and Management Industry Revenue (Million), by Country 2024 & 2032
- Figure 21: North America Service Integration and Management Industry Revenue Share (%), by Country 2024 & 2032
- Figure 22: Europe Service Integration and Management Industry Revenue (Million), by Component 2024 & 2032
- Figure 23: Europe Service Integration and Management Industry Revenue Share (%), by Component 2024 & 2032
- Figure 24: Europe Service Integration and Management Industry Revenue (Million), by Organization Size 2024 & 2032
- Figure 25: Europe Service Integration and Management Industry Revenue Share (%), by Organization Size 2024 & 2032
- Figure 26: Europe Service Integration and Management Industry Revenue (Million), by End user Industry 2024 & 2032
- Figure 27: Europe Service Integration and Management Industry Revenue Share (%), by End user Industry 2024 & 2032
- Figure 28: Europe Service Integration and Management Industry Revenue (Million), by Country 2024 & 2032
- Figure 29: Europe Service Integration and Management Industry Revenue Share (%), by Country 2024 & 2032
- Figure 30: Asia Pacific Service Integration and Management Industry Revenue (Million), by Component 2024 & 2032
- Figure 31: Asia Pacific Service Integration and Management Industry Revenue Share (%), by Component 2024 & 2032
- Figure 32: Asia Pacific Service Integration and Management Industry Revenue (Million), by Organization Size 2024 & 2032
- Figure 33: Asia Pacific Service Integration and Management Industry Revenue Share (%), by Organization Size 2024 & 2032
- Figure 34: Asia Pacific Service Integration and Management Industry Revenue (Million), by End user Industry 2024 & 2032
- Figure 35: Asia Pacific Service Integration and Management Industry Revenue Share (%), by End user Industry 2024 & 2032
- Figure 36: Asia Pacific Service Integration and Management Industry Revenue (Million), by Country 2024 & 2032
- Figure 37: Asia Pacific Service Integration and Management Industry Revenue Share (%), by Country 2024 & 2032
- Figure 38: Rest of the World Service Integration and Management Industry Revenue (Million), by Component 2024 & 2032
- Figure 39: Rest of the World Service Integration and Management Industry Revenue Share (%), by Component 2024 & 2032
- Figure 40: Rest of the World Service Integration and Management Industry Revenue (Million), by Organization Size 2024 & 2032
- Figure 41: Rest of the World Service Integration and Management Industry Revenue Share (%), by Organization Size 2024 & 2032
- Figure 42: Rest of the World Service Integration and Management Industry Revenue (Million), by End user Industry 2024 & 2032
- Figure 43: Rest of the World Service Integration and Management Industry Revenue Share (%), by End user Industry 2024 & 2032
- Figure 44: Rest of the World Service Integration and Management Industry Revenue (Million), by Country 2024 & 2032
- Figure 45: Rest of the World Service Integration and Management Industry Revenue Share (%), by Country 2024 & 2032
List of Tables
- Table 1: Global Service Integration and Management Industry Revenue Million Forecast, by Region 2019 & 2032
- Table 2: Global Service Integration and Management Industry Revenue Million Forecast, by Component 2019 & 2032
- Table 3: Global Service Integration and Management Industry Revenue Million Forecast, by Organization Size 2019 & 2032
- Table 4: Global Service Integration and Management Industry Revenue Million Forecast, by End user Industry 2019 & 2032
- Table 5: Global Service Integration and Management Industry Revenue Million Forecast, by Region 2019 & 2032
- Table 6: Global Service Integration and Management Industry Revenue Million Forecast, by Country 2019 & 2032
- Table 7: United States Service Integration and Management Industry Revenue (Million) Forecast, by Application 2019 & 2032
- Table 8: Canada Service Integration and Management Industry Revenue (Million) Forecast, by Application 2019 & 2032
- Table 9: Mexico Service Integration and Management Industry Revenue (Million) Forecast, by Application 2019 & 2032
- Table 10: Global Service Integration and Management Industry Revenue Million Forecast, by Country 2019 & 2032
- Table 11: Germany Service Integration and Management Industry Revenue (Million) Forecast, by Application 2019 & 2032
- Table 12: United Kingdom Service Integration and Management Industry Revenue (Million) Forecast, by Application 2019 & 2032
- Table 13: France Service Integration and Management Industry Revenue (Million) Forecast, by Application 2019 & 2032
- Table 14: Spain Service Integration and Management Industry Revenue (Million) Forecast, by Application 2019 & 2032
- Table 15: Italy Service Integration and Management Industry Revenue (Million) Forecast, by Application 2019 & 2032
- Table 16: Spain Service Integration and Management Industry Revenue (Million) Forecast, by Application 2019 & 2032
- Table 17: Belgium Service Integration and Management Industry Revenue (Million) Forecast, by Application 2019 & 2032
- Table 18: Netherland Service Integration and Management Industry Revenue (Million) Forecast, by Application 2019 & 2032
- Table 19: Nordics Service Integration and Management Industry Revenue (Million) Forecast, by Application 2019 & 2032
- Table 20: Rest of Europe Service Integration and Management Industry Revenue (Million) Forecast, by Application 2019 & 2032
- Table 21: Global Service Integration and Management Industry Revenue Million Forecast, by Country 2019 & 2032
- Table 22: China Service Integration and Management Industry Revenue (Million) Forecast, by Application 2019 & 2032
- Table 23: Japan Service Integration and Management Industry Revenue (Million) Forecast, by Application 2019 & 2032
- Table 24: India Service Integration and Management Industry Revenue (Million) Forecast, by Application 2019 & 2032
- Table 25: South Korea Service Integration and Management Industry Revenue (Million) Forecast, by Application 2019 & 2032
- Table 26: Southeast Asia Service Integration and Management Industry Revenue (Million) Forecast, by Application 2019 & 2032
- Table 27: Australia Service Integration and Management Industry Revenue (Million) Forecast, by Application 2019 & 2032
- Table 28: Indonesia Service Integration and Management Industry Revenue (Million) Forecast, by Application 2019 & 2032
- Table 29: Phillipes Service Integration and Management Industry Revenue (Million) Forecast, by Application 2019 & 2032
- Table 30: Singapore Service Integration and Management Industry Revenue (Million) Forecast, by Application 2019 & 2032
- Table 31: Thailandc Service Integration and Management Industry Revenue (Million) Forecast, by Application 2019 & 2032
- Table 32: Rest of Asia Pacific Service Integration and Management Industry Revenue (Million) Forecast, by Application 2019 & 2032
- Table 33: Global Service Integration and Management Industry Revenue Million Forecast, by Country 2019 & 2032
- Table 34: Brazil Service Integration and Management Industry Revenue (Million) Forecast, by Application 2019 & 2032
- Table 35: Argentina Service Integration and Management Industry Revenue (Million) Forecast, by Application 2019 & 2032
- Table 36: Peru Service Integration and Management Industry Revenue (Million) Forecast, by Application 2019 & 2032
- Table 37: Chile Service Integration and Management Industry Revenue (Million) Forecast, by Application 2019 & 2032
- Table 38: Colombia Service Integration and Management Industry Revenue (Million) Forecast, by Application 2019 & 2032
- Table 39: Ecuador Service Integration and Management Industry Revenue (Million) Forecast, by Application 2019 & 2032
- Table 40: Venezuela Service Integration and Management Industry Revenue (Million) Forecast, by Application 2019 & 2032
- Table 41: Rest of South America Service Integration and Management Industry Revenue (Million) Forecast, by Application 2019 & 2032
- Table 42: Global Service Integration and Management Industry Revenue Million Forecast, by Country 2019 & 2032
- Table 43: United States Service Integration and Management Industry Revenue (Million) Forecast, by Application 2019 & 2032
- Table 44: Canada Service Integration and Management Industry Revenue (Million) Forecast, by Application 2019 & 2032
- Table 45: Mexico Service Integration and Management Industry Revenue (Million) Forecast, by Application 2019 & 2032
- Table 46: Global Service Integration and Management Industry Revenue Million Forecast, by Country 2019 & 2032
- Table 47: United Arab Emirates Service Integration and Management Industry Revenue (Million) Forecast, by Application 2019 & 2032
- Table 48: Saudi Arabia Service Integration and Management Industry Revenue (Million) Forecast, by Application 2019 & 2032
- Table 49: South Africa Service Integration and Management Industry Revenue (Million) Forecast, by Application 2019 & 2032
- Table 50: Rest of Middle East and Africa Service Integration and Management Industry Revenue (Million) Forecast, by Application 2019 & 2032
- Table 51: Global Service Integration and Management Industry Revenue Million Forecast, by Component 2019 & 2032
- Table 52: Global Service Integration and Management Industry Revenue Million Forecast, by Organization Size 2019 & 2032
- Table 53: Global Service Integration and Management Industry Revenue Million Forecast, by End user Industry 2019 & 2032
- Table 54: Global Service Integration and Management Industry Revenue Million Forecast, by Country 2019 & 2032
- Table 55: Global Service Integration and Management Industry Revenue Million Forecast, by Component 2019 & 2032
- Table 56: Global Service Integration and Management Industry Revenue Million Forecast, by Organization Size 2019 & 2032
- Table 57: Global Service Integration and Management Industry Revenue Million Forecast, by End user Industry 2019 & 2032
- Table 58: Global Service Integration and Management Industry Revenue Million Forecast, by Country 2019 & 2032
- Table 59: Global Service Integration and Management Industry Revenue Million Forecast, by Component 2019 & 2032
- Table 60: Global Service Integration and Management Industry Revenue Million Forecast, by Organization Size 2019 & 2032
- Table 61: Global Service Integration and Management Industry Revenue Million Forecast, by End user Industry 2019 & 2032
- Table 62: Global Service Integration and Management Industry Revenue Million Forecast, by Country 2019 & 2032
- Table 63: Global Service Integration and Management Industry Revenue Million Forecast, by Component 2019 & 2032
- Table 64: Global Service Integration and Management Industry Revenue Million Forecast, by Organization Size 2019 & 2032
- Table 65: Global Service Integration and Management Industry Revenue Million Forecast, by End user Industry 2019 & 2032
- Table 66: Global Service Integration and Management Industry Revenue Million Forecast, by Country 2019 & 2032
Frequently Asked Questions
1. What is the projected Compound Annual Growth Rate (CAGR) of the Service Integration and Management Industry?
The projected CAGR is approximately 9.20%.
2. Which companies are prominent players in the Service Integration and Management Industry?
Key companies in the market include Wipro Limite, Infosys Limited, Accenture PLC, HCL Technologies, IBM Corporation, Capgemini SE, Hewlett Packard Enterprise (HPE), Fujitsu Limited, Mindtree Limited, AtoS SE.
3. What are the main segments of the Service Integration and Management Industry?
The market segments include Component, Organization Size, End user Industry.
4. Can you provide details about the market size?
The market size is estimated to be USD XX Million as of 2022.
5. What are some drivers contributing to market growth?
Increasing Complexities of Service Management; Increasing Demand for Multi-Vendor Outsourcing.
6. What are the notable trends driving market growth?
Cloud Technology to witness significant growth.
7. Are there any restraints impacting market growth?
Lack of Uniform SLAs and Regulatory Compliances.
8. Can you provide examples of recent developments in the market?
August 2021 - Perspecta Enterprise Solutions LLC, as contractor team arrangement (CTA) lead with Capgemini Government Solutions LLC, as a CTA member, was awarded a single award, firm-fixed-price, blanket purchase agreement (BPA) with an ordering ceiling of USD 2 billion. BPA HT001521A0002 represents the Military Health System Enterprise Information Technology Services Integrator (EITSI). The EITSI would use a multisourcing services integrator approach to coordinate, integrate, and manage the Defense Health Agency's (DHA) IT transformation to consolidate services and reduce costs.
9. What pricing options are available for accessing the report?
Pricing options include single-user, multi-user, and enterprise licenses priced at USD 4750, USD 5250, and USD 8750 respectively.
10. Is the market size provided in terms of value or volume?
The market size is provided in terms of value, measured in Million.
11. Are there any specific market keywords associated with the report?
Yes, the market keyword associated with the report is "Service Integration and Management Industry," which aids in identifying and referencing the specific market segment covered.
12. How do I determine which pricing option suits my needs best?
The pricing options vary based on user requirements and access needs. Individual users may opt for single-user licenses, while businesses requiring broader access may choose multi-user or enterprise licenses for cost-effective access to the report.
13. Are there any additional resources or data provided in the Service Integration and Management Industry report?
While the report offers comprehensive insights, it's advisable to review the specific contents or supplementary materials provided to ascertain if additional resources or data are available.
14. How can I stay updated on further developments or reports in the Service Integration and Management Industry?
To stay informed about further developments, trends, and reports in the Service Integration and Management Industry, consider subscribing to industry newsletters, following relevant companies and organizations, or regularly checking reputable industry news sources and publications.
Methodology
Step 1 - Identification of Relevant Samples Size from Population Database


Step 2 - Approaches for Defining Global Market Size (Value, Volume* & Price*)

Note*: In applicable scenarios
Step 3 - Data Sources
Primary Research
- Web Analytics
- Survey Reports
- Research Institute
- Latest Research Reports
- Opinion Leaders
Secondary Research
- Annual Reports
- White Paper
- Latest Press Release
- Industry Association
- Paid Database
- Investor Presentations

Step 4 - Data Triangulation
Involves using different sources of information in order to increase the validity of a study
These sources are likely to be stakeholders in a program - participants, other researchers, program staff, other community members, and so on.
Then we put all data in single framework & apply various statistical tools to find out the dynamic on the market.
During the analysis stage, feedback from the stakeholder groups would be compared to determine areas of agreement as well as areas of divergence


