

Key Insights
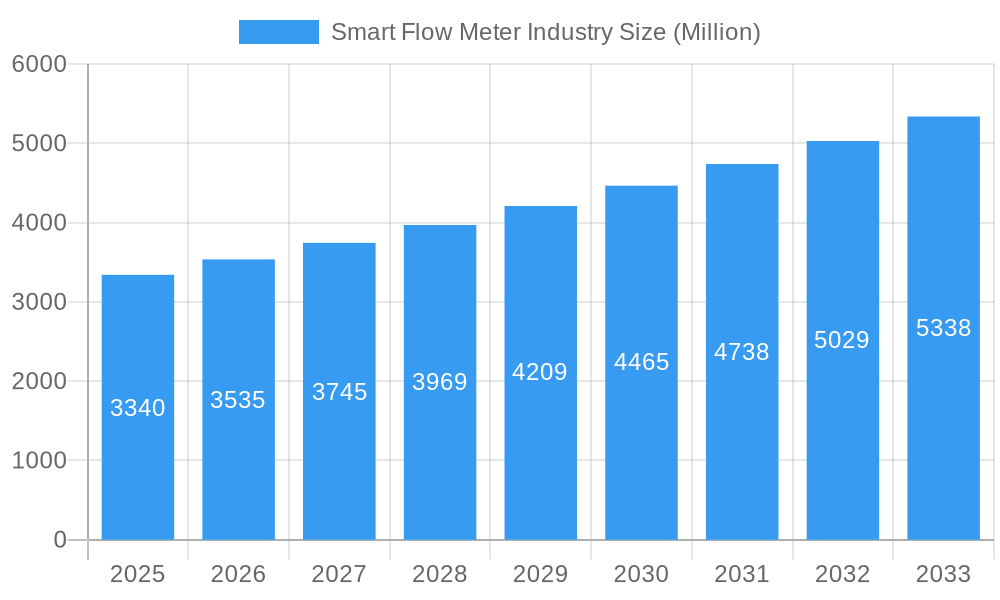
The smart flow meter market, valued at $3.34 billion in 2025, is poised for robust growth, exhibiting a Compound Annual Growth Rate (CAGR) of 5.59% from 2025 to 2033. This expansion is driven by several key factors. The increasing adoption of Industry 4.0 and the Industrial Internet of Things (IIoT) across various sectors necessitates advanced flow measurement solutions for real-time data acquisition and process optimization. Furthermore, stringent environmental regulations and the need for precise fluid management in industries like oil and gas, pharmaceuticals, and water treatment are fueling demand for accurate and reliable smart flow meters. The rising preference for contactless measurement technologies like ultrasonic and magnetic flow meters, offering enhanced durability and reduced maintenance, further contributes to market growth. Competition among established players like Honeywell, Emerson, Siemens, and Endress+Hauser, alongside emerging technology providers, is fostering innovation and driving down costs, making smart flow meters increasingly accessible across diverse applications.

Smart Flow Meter Industry Market Size (In Billion)

Technological advancements are shaping the future of the smart flow meter market. The integration of advanced analytics and machine learning capabilities within these meters enables predictive maintenance, preventing costly downtime and improving operational efficiency. The development of wireless communication protocols like LoRaWAN and NB-IoT is facilitating seamless data integration across distributed networks, enhancing real-time monitoring and control capabilities. However, the high initial investment cost associated with smart flow meter implementation and the need for skilled personnel for installation and maintenance represent potential challenges. Despite these hurdles, the long-term benefits in terms of enhanced efficiency, reduced operational costs, and improved environmental compliance are expected to outweigh the initial investment, fueling continued market growth throughout the forecast period. Regional variations in adoption rates are anticipated, with North America and Europe leading the market due to early adoption of advanced technologies and stringent regulatory frameworks, while Asia-Pacific is expected to experience significant growth due to increasing industrialization and infrastructure development.
Smart Flow Meter Industry Company Market Share
Smart Flow Meter Industry Market Report: 2019-2033
This comprehensive report provides a detailed analysis of the global smart flow meter market, offering invaluable insights for industry professionals, investors, and strategic decision-makers. Covering the period 2019-2033, with a focus on 2025, this report unveils market dynamics, innovation trends, and future growth potential. The report analyzes a market valued at xx Million in 2025, projecting significant expansion to xx Million by 2033.
Smart Flow Meter Industry Market Structure & Innovation Trends
This section analyzes the competitive landscape, innovation drivers, and regulatory influences shaping the smart flow meter market. The market exhibits a moderately concentrated structure, with key players like Honeywell International Inc, Siemens AG, Emerson Electric Co, and ABB Ltd holding significant market share. However, numerous smaller players contribute to a dynamic competitive environment. The market share distribution is constantly shifting due to ongoing product innovation and strategic mergers and acquisitions (M&A). Recent M&A activity, while not publicly disclosed in detail for specific deal values, indicates a consolidation trend amongst mid-sized players.
- Market Concentration: Moderate, with several major players and numerous smaller competitors.
- Innovation Drivers: Advancements in sensor technology, communication protocols (e.g., IoT integration), and data analytics capabilities.
- Regulatory Frameworks: Stringent environmental regulations and industry standards drive the adoption of precise and reliable flow measurement technologies.
- Product Substitutes: Traditional mechanical flow meters still exist but are gradually being replaced by smart flow meters due to their superior accuracy and data-driven capabilities.
- End-User Demographics: The market is diverse, spanning various end-user industries, with each segment exhibiting unique requirements and preferences.
- M&A Activity: Recent years have witnessed a moderate level of M&A activity, primarily focused on enhancing technological capabilities and market reach.
Smart Flow Meter Industry Market Dynamics & Trends
The smart flow meter market is experiencing robust growth, driven by increasing demand across various industries. The compound annual growth rate (CAGR) for the forecast period (2025-2033) is estimated at xx%, fueled by several factors. Market penetration varies significantly across different end-user segments, with the oil and gas sector demonstrating high adoption rates. Technological disruptions, such as the integration of advanced analytics and artificial intelligence (AI), are reshaping the competitive dynamics. Consumer preferences are shifting towards smart meters that offer enhanced precision, remote monitoring capabilities, and reduced maintenance requirements.
- Market Growth Drivers: Increasing industrial automation, stringent environmental regulations, and the growing need for real-time process optimization.
- Technological Disruptions: IoT integration, AI-powered predictive maintenance, and advanced sensor technology.
- Consumer Preferences: Demand for higher accuracy, remote monitoring capabilities, lower maintenance needs, and improved data analytics.
- Competitive Dynamics: Intense competition among major players focusing on product innovation, strategic partnerships, and geographical expansion.
Dominant Regions & Segments in Smart Flow Meter Industry
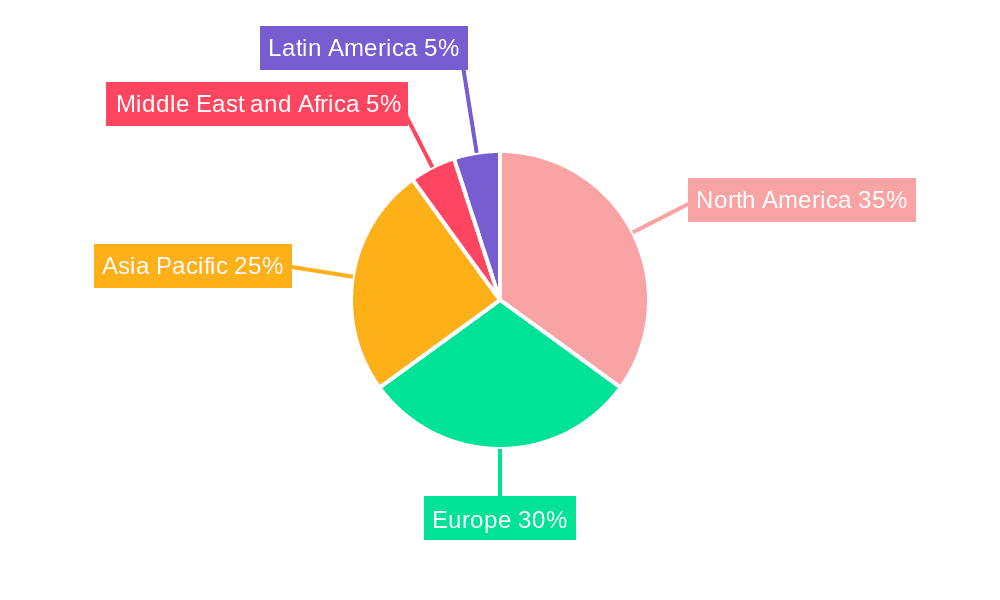
The North American and European regions currently dominate the global smart flow meter market due to advanced industrial infrastructure and stringent environmental regulations. However, the Asia-Pacific region is anticipated to witness the fastest growth rate in the forecast period.
By Type: Magnetic flow meters hold a significant market share due to their cost-effectiveness and versatility, followed by ultrasonic and Coriolis flow meters.
By Communication Protocol: Modbus and Hart protocols are widely adopted, although the adoption of newer protocols like Profibus is increasing.
By End-User Industry: The oil and gas sector is the largest end-user segment, followed by water and wastewater and the pharmaceutical industries.
Key Drivers (Regional):
- North America & Europe: Stringent environmental regulations, well-developed industrial infrastructure, and high adoption of automation technologies.
- Asia-Pacific: Rapid industrialization, increasing investments in infrastructure projects, and growing demand for efficient resource management.
Key Drivers (Segmental):
- Magnetic Flow Meters: Cost-effectiveness, wide applicability, and ease of installation.
- Modbus/Hart Protocols: Established standards, wide industry acceptance, and readily available support.
- Oil & Gas: High demand for precise measurement and process control in extraction, refining, and transportation.
Smart Flow Meter Industry Product Innovations
Recent innovations focus on enhancing measurement accuracy, improving connectivity, and enabling predictive maintenance. New products incorporate advanced sensor technologies, integrated data analytics, and seamless integration with industrial IoT platforms. These features offer significant competitive advantages, enabling real-time monitoring, improved efficiency, and reduced operational costs. The development of pressure-insensitive mass flow controllers highlights advancements in semiconductor manufacturing applications.
Report Scope & Segmentation Analysis
This report segments the smart flow meter market by type (Coriolis, Magnetic, Ultrasonic, Multiphase, Vortex, Variable Area, Differential pressure, Thermal, Turbine), communication protocol (Profibus, Modbus, Hart, Others), and end-user industry (Oil and Gas, Pharmaceuticals, Water and Wastewater, Paper and Pulp, Power Generation, Food and Beverages, Other End-User Industries). Each segment's growth projections, market size, and competitive dynamics are analyzed individually within the main report, providing detailed insights into market trends and opportunities.
Key Drivers of Smart Flow Meter Industry Growth
The smart flow meter market's growth is driven by the increasing demand for precise and reliable flow measurement in various industries, stringent environmental regulations promoting efficient resource management, and the growing adoption of smart technologies for improved process optimization and remote monitoring capabilities. Technological advancements, such as the integration of IoT and AI, further enhance the value proposition of smart flow meters.
Challenges in the Smart Flow Meter Industry Sector
Challenges include high initial investment costs for smart meter implementation, potential cybersecurity risks associated with data connectivity, and the need for skilled personnel to operate and maintain these advanced systems. Supply chain disruptions and price fluctuations of raw materials can also pose challenges. Competition from established players and the emergence of new entrants in the market add another layer of complexity.
Emerging Opportunities in Smart Flow Meter Industry
Emerging opportunities lie in the growing adoption of smart meters in developing economies, the integration of smart flow meters with advanced analytics platforms for predictive maintenance and process optimization, and the expansion into new application areas, such as renewable energy and smart cities. The development of low-power, long-range communication technologies holds the potential to unlock further market growth.
Leading Players in the Smart Flow Meter Industry Market
Key Developments in Smart Flow Meter Industry
- November 2021: Brooks Instrument launched the GP200 Series pressure-based mass flow controller, a fully pressure-insensitive device for semiconductor manufacturing.
- April 2022: Yokogawa Electric Corporation released the OpreXVortex Flowmeter VY Series, featuring remote maintenance capabilities for Southeast Asia, Oceania, India, the Middle East, and South America (excluding Brazil).
Future Outlook for Smart Flow Meter Industry Market
The smart flow meter market is poised for continued growth, driven by technological advancements, increasing demand for efficient resource management, and the expansion into new application areas. Strategic partnerships and investments in research and development will play a pivotal role in shaping the future competitive landscape. The focus on data-driven insights and predictive maintenance will further enhance the value proposition of smart flow meters, driving adoption across various industries.
Smart Flow Meter Industry Segmentation
-
1. Type
- 1.1. Coriolis
- 1.2. Magnetic
- 1.3. Ultrasonic
- 1.4. Multiphase
- 1.5. Vortex
- 1.6. Variable Area
- 1.7. Differential pressure
- 1.8. Thermal
- 1.9. Turbine
-
2. Communication Protocol
- 2.1. Profibus
- 2.2. Modbus
- 2.3. Hart
- 2.4. Others
-
3. End-User Industry
- 3.1. Oil and Gas
- 3.2. Pharmaceuticals
- 3.3. Water and Wastewater
- 3.4. Paper and Pulp
- 3.5. Power Generation
- 3.6. Food and Beverages
- 3.7. Other End-User Industries
Smart Flow Meter Industry Segmentation By Geography
- 1. North America
- 2. Latin America
- 3. Europe
- 4. Asia Pacific
- 5. Middle East and Africa
Smart Flow Meter Industry Regional Market Share
Geographic Coverage of Smart Flow Meter Industry
Smart Flow Meter Industry REPORT HIGHLIGHTS
| Aspects | Details |
|---|---|
| Study Period | 2020-2034 |
| Base Year | 2025 |
| Estimated Year | 2026 |
| Forecast Period | 2026-2034 |
| Historical Period | 2020-2025 |
| Growth Rate | CAGR of 5.59% from 2020-2034 |
| Segmentation |
|
Table of Contents
- 1. Introduction
- 1.1. Research Scope
- 1.2. Market Segmentation
- 1.3. Research Methodology
- 1.4. Definitions and Assumptions
- 2. Executive Summary
- 2.1. Introduction
- 3. Market Dynamics
- 3.1. Introduction
- 3.2. Market Drivers
- 3.2.1. Growing Penetration of Advanced Flow Meters in the Oil and Gas Sector and Water & Wastewater Management; Penetration of IoT in Flow Rate Measurement Solutions
- 3.3. Market Restrains
- 3.3.1. Higher Cost of Intelligent Flow Meters Compared to Traditional Flow Meters; High Initial Cost for Coriolis and Magnetic Flow Meters
- 3.4. Market Trends
- 3.4.1. Food and Beverages Industry to Witness the Highest Growth
- 4. Market Factor Analysis
- 4.1. Porters Five Forces
- 4.2. Supply/Value Chain
- 4.3. PESTEL analysis
- 4.4. Market Entropy
- 4.5. Patent/Trademark Analysis
- 5. Global Smart Flow Meter Industry Analysis, Insights and Forecast, 2020-2032
- 5.1. Market Analysis, Insights and Forecast - by Type
- 5.1.1. Coriolis
- 5.1.2. Magnetic
- 5.1.3. Ultrasonic
- 5.1.4. Multiphase
- 5.1.5. Vortex
- 5.1.6. Variable Area
- 5.1.7. Differential pressure
- 5.1.8. Thermal
- 5.1.9. Turbine
- 5.2. Market Analysis, Insights and Forecast - by Communication Protocol
- 5.2.1. Profibus
- 5.2.2. Modbus
- 5.2.3. Hart
- 5.2.4. Others
- 5.3. Market Analysis, Insights and Forecast - by End-User Industry
- 5.3.1. Oil and Gas
- 5.3.2. Pharmaceuticals
- 5.3.3. Water and Wastewater
- 5.3.4. Paper and Pulp
- 5.3.5. Power Generation
- 5.3.6. Food and Beverages
- 5.3.7. Other End-User Industries
- 5.4. Market Analysis, Insights and Forecast - by Region
- 5.4.1. North America
- 5.4.2. Latin America
- 5.4.3. Europe
- 5.4.4. Asia Pacific
- 5.4.5. Middle East and Africa
- 5.1. Market Analysis, Insights and Forecast - by Type
- 6. North America Smart Flow Meter Industry Analysis, Insights and Forecast, 2020-2032
- 6.1. Market Analysis, Insights and Forecast - by Type
- 6.1.1. Coriolis
- 6.1.2. Magnetic
- 6.1.3. Ultrasonic
- 6.1.4. Multiphase
- 6.1.5. Vortex
- 6.1.6. Variable Area
- 6.1.7. Differential pressure
- 6.1.8. Thermal
- 6.1.9. Turbine
- 6.2. Market Analysis, Insights and Forecast - by Communication Protocol
- 6.2.1. Profibus
- 6.2.2. Modbus
- 6.2.3. Hart
- 6.2.4. Others
- 6.3. Market Analysis, Insights and Forecast - by End-User Industry
- 6.3.1. Oil and Gas
- 6.3.2. Pharmaceuticals
- 6.3.3. Water and Wastewater
- 6.3.4. Paper and Pulp
- 6.3.5. Power Generation
- 6.3.6. Food and Beverages
- 6.3.7. Other End-User Industries
- 6.1. Market Analysis, Insights and Forecast - by Type
- 7. Latin America Smart Flow Meter Industry Analysis, Insights and Forecast, 2020-2032
- 7.1. Market Analysis, Insights and Forecast - by Type
- 7.1.1. Coriolis
- 7.1.2. Magnetic
- 7.1.3. Ultrasonic
- 7.1.4. Multiphase
- 7.1.5. Vortex
- 7.1.6. Variable Area
- 7.1.7. Differential pressure
- 7.1.8. Thermal
- 7.1.9. Turbine
- 7.2. Market Analysis, Insights and Forecast - by Communication Protocol
- 7.2.1. Profibus
- 7.2.2. Modbus
- 7.2.3. Hart
- 7.2.4. Others
- 7.3. Market Analysis, Insights and Forecast - by End-User Industry
- 7.3.1. Oil and Gas
- 7.3.2. Pharmaceuticals
- 7.3.3. Water and Wastewater
- 7.3.4. Paper and Pulp
- 7.3.5. Power Generation
- 7.3.6. Food and Beverages
- 7.3.7. Other End-User Industries
- 7.1. Market Analysis, Insights and Forecast - by Type
- 8. Europe Smart Flow Meter Industry Analysis, Insights and Forecast, 2020-2032
- 8.1. Market Analysis, Insights and Forecast - by Type
- 8.1.1. Coriolis
- 8.1.2. Magnetic
- 8.1.3. Ultrasonic
- 8.1.4. Multiphase
- 8.1.5. Vortex
- 8.1.6. Variable Area
- 8.1.7. Differential pressure
- 8.1.8. Thermal
- 8.1.9. Turbine
- 8.2. Market Analysis, Insights and Forecast - by Communication Protocol
- 8.2.1. Profibus
- 8.2.2. Modbus
- 8.2.3. Hart
- 8.2.4. Others
- 8.3. Market Analysis, Insights and Forecast - by End-User Industry
- 8.3.1. Oil and Gas
- 8.3.2. Pharmaceuticals
- 8.3.3. Water and Wastewater
- 8.3.4. Paper and Pulp
- 8.3.5. Power Generation
- 8.3.6. Food and Beverages
- 8.3.7. Other End-User Industries
- 8.1. Market Analysis, Insights and Forecast - by Type
- 9. Asia Pacific Smart Flow Meter Industry Analysis, Insights and Forecast, 2020-2032
- 9.1. Market Analysis, Insights and Forecast - by Type
- 9.1.1. Coriolis
- 9.1.2. Magnetic
- 9.1.3. Ultrasonic
- 9.1.4. Multiphase
- 9.1.5. Vortex
- 9.1.6. Variable Area
- 9.1.7. Differential pressure
- 9.1.8. Thermal
- 9.1.9. Turbine
- 9.2. Market Analysis, Insights and Forecast - by Communication Protocol
- 9.2.1. Profibus
- 9.2.2. Modbus
- 9.2.3. Hart
- 9.2.4. Others
- 9.3. Market Analysis, Insights and Forecast - by End-User Industry
- 9.3.1. Oil and Gas
- 9.3.2. Pharmaceuticals
- 9.3.3. Water and Wastewater
- 9.3.4. Paper and Pulp
- 9.3.5. Power Generation
- 9.3.6. Food and Beverages
- 9.3.7. Other End-User Industries
- 9.1. Market Analysis, Insights and Forecast - by Type
- 10. Middle East and Africa Smart Flow Meter Industry Analysis, Insights and Forecast, 2020-2032
- 10.1. Market Analysis, Insights and Forecast - by Type
- 10.1.1. Coriolis
- 10.1.2. Magnetic
- 10.1.3. Ultrasonic
- 10.1.4. Multiphase
- 10.1.5. Vortex
- 10.1.6. Variable Area
- 10.1.7. Differential pressure
- 10.1.8. Thermal
- 10.1.9. Turbine
- 10.2. Market Analysis, Insights and Forecast - by Communication Protocol
- 10.2.1. Profibus
- 10.2.2. Modbus
- 10.2.3. Hart
- 10.2.4. Others
- 10.3. Market Analysis, Insights and Forecast - by End-User Industry
- 10.3.1. Oil and Gas
- 10.3.2. Pharmaceuticals
- 10.3.3. Water and Wastewater
- 10.3.4. Paper and Pulp
- 10.3.5. Power Generation
- 10.3.6. Food and Beverages
- 10.3.7. Other End-User Industries
- 10.1. Market Analysis, Insights and Forecast - by Type
- 11. Competitive Analysis
- 11.1. Global Market Share Analysis 2025
- 11.2. Company Profiles
- 11.2.1 Honeywell International Inc
- 11.2.1.1. Overview
- 11.2.1.2. Products
- 11.2.1.3. SWOT Analysis
- 11.2.1.4. Recent Developments
- 11.2.1.5. Financials (Based on Availability)
- 11.2.2 Sierra Instruments Inc
- 11.2.2.1. Overview
- 11.2.2.2. Products
- 11.2.2.3. SWOT Analysis
- 11.2.2.4. Recent Developments
- 11.2.2.5. Financials (Based on Availability)
- 11.2.3 Emerson Electric Co
- 11.2.3.1. Overview
- 11.2.3.2. Products
- 11.2.3.3. SWOT Analysis
- 11.2.3.4. Recent Developments
- 11.2.3.5. Financials (Based on Availability)
- 11.2.4 Siemens AG
- 11.2.4.1. Overview
- 11.2.4.2. Products
- 11.2.4.3. SWOT Analysis
- 11.2.4.4. Recent Developments
- 11.2.4.5. Financials (Based on Availability)
- 11.2.5 Brooks Instrument
- 11.2.5.1. Overview
- 11.2.5.2. Products
- 11.2.5.3. SWOT Analysis
- 11.2.5.4. Recent Developments
- 11.2.5.5. Financials (Based on Availability)
- 11.2.6 KROHNE Messtechnik GmbH
- 11.2.6.1. Overview
- 11.2.6.2. Products
- 11.2.6.3. SWOT Analysis
- 11.2.6.4. Recent Developments
- 11.2.6.5. Financials (Based on Availability)
- 11.2.7 Fuji Electric
- 11.2.7.1. Overview
- 11.2.7.2. Products
- 11.2.7.3. SWOT Analysis
- 11.2.7.4. Recent Developments
- 11.2.7.5. Financials (Based on Availability)
- 11.2.8 ABB Ltd *List Not Exhaustive
- 11.2.8.1. Overview
- 11.2.8.2. Products
- 11.2.8.3. SWOT Analysis
- 11.2.8.4. Recent Developments
- 11.2.8.5. Financials (Based on Availability)
- 11.2.9 Azbil Corporation
- 11.2.9.1. Overview
- 11.2.9.2. Products
- 11.2.9.3. SWOT Analysis
- 11.2.9.4. Recent Developments
- 11.2.9.5. Financials (Based on Availability)
- 11.2.10 Yokogawa Electric Corporation
- 11.2.10.1. Overview
- 11.2.10.2. Products
- 11.2.10.3. SWOT Analysis
- 11.2.10.4. Recent Developments
- 11.2.10.5. Financials (Based on Availability)
- 11.2.11 Endress + Hauser AG
- 11.2.11.1. Overview
- 11.2.11.2. Products
- 11.2.11.3. SWOT Analysis
- 11.2.11.4. Recent Developments
- 11.2.11.5. Financials (Based on Availability)
- 11.2.12 General Electric Company
- 11.2.12.1. Overview
- 11.2.12.2. Products
- 11.2.12.3. SWOT Analysis
- 11.2.12.4. Recent Developments
- 11.2.12.5. Financials (Based on Availability)
- 11.2.13 Teledyne Isco Inc
- 11.2.13.1. Overview
- 11.2.13.2. Products
- 11.2.13.3. SWOT Analysis
- 11.2.13.4. Recent Developments
- 11.2.13.5. Financials (Based on Availability)
- 11.2.1 Honeywell International Inc
List of Figures
- Figure 1: Global Smart Flow Meter Industry Revenue Breakdown (Million, %) by Region 2025 & 2033
- Figure 2: North America Smart Flow Meter Industry Revenue (Million), by Type 2025 & 2033
- Figure 3: North America Smart Flow Meter Industry Revenue Share (%), by Type 2025 & 2033
- Figure 4: North America Smart Flow Meter Industry Revenue (Million), by Communication Protocol 2025 & 2033
- Figure 5: North America Smart Flow Meter Industry Revenue Share (%), by Communication Protocol 2025 & 2033
- Figure 6: North America Smart Flow Meter Industry Revenue (Million), by End-User Industry 2025 & 2033
- Figure 7: North America Smart Flow Meter Industry Revenue Share (%), by End-User Industry 2025 & 2033
- Figure 8: North America Smart Flow Meter Industry Revenue (Million), by Country 2025 & 2033
- Figure 9: North America Smart Flow Meter Industry Revenue Share (%), by Country 2025 & 2033
- Figure 10: Latin America Smart Flow Meter Industry Revenue (Million), by Type 2025 & 2033
- Figure 11: Latin America Smart Flow Meter Industry Revenue Share (%), by Type 2025 & 2033
- Figure 12: Latin America Smart Flow Meter Industry Revenue (Million), by Communication Protocol 2025 & 2033
- Figure 13: Latin America Smart Flow Meter Industry Revenue Share (%), by Communication Protocol 2025 & 2033
- Figure 14: Latin America Smart Flow Meter Industry Revenue (Million), by End-User Industry 2025 & 2033
- Figure 15: Latin America Smart Flow Meter Industry Revenue Share (%), by End-User Industry 2025 & 2033
- Figure 16: Latin America Smart Flow Meter Industry Revenue (Million), by Country 2025 & 2033
- Figure 17: Latin America Smart Flow Meter Industry Revenue Share (%), by Country 2025 & 2033
- Figure 18: Europe Smart Flow Meter Industry Revenue (Million), by Type 2025 & 2033
- Figure 19: Europe Smart Flow Meter Industry Revenue Share (%), by Type 2025 & 2033
- Figure 20: Europe Smart Flow Meter Industry Revenue (Million), by Communication Protocol 2025 & 2033
- Figure 21: Europe Smart Flow Meter Industry Revenue Share (%), by Communication Protocol 2025 & 2033
- Figure 22: Europe Smart Flow Meter Industry Revenue (Million), by End-User Industry 2025 & 2033
- Figure 23: Europe Smart Flow Meter Industry Revenue Share (%), by End-User Industry 2025 & 2033
- Figure 24: Europe Smart Flow Meter Industry Revenue (Million), by Country 2025 & 2033
- Figure 25: Europe Smart Flow Meter Industry Revenue Share (%), by Country 2025 & 2033
- Figure 26: Asia Pacific Smart Flow Meter Industry Revenue (Million), by Type 2025 & 2033
- Figure 27: Asia Pacific Smart Flow Meter Industry Revenue Share (%), by Type 2025 & 2033
- Figure 28: Asia Pacific Smart Flow Meter Industry Revenue (Million), by Communication Protocol 2025 & 2033
- Figure 29: Asia Pacific Smart Flow Meter Industry Revenue Share (%), by Communication Protocol 2025 & 2033
- Figure 30: Asia Pacific Smart Flow Meter Industry Revenue (Million), by End-User Industry 2025 & 2033
- Figure 31: Asia Pacific Smart Flow Meter Industry Revenue Share (%), by End-User Industry 2025 & 2033
- Figure 32: Asia Pacific Smart Flow Meter Industry Revenue (Million), by Country 2025 & 2033
- Figure 33: Asia Pacific Smart Flow Meter Industry Revenue Share (%), by Country 2025 & 2033
- Figure 34: Middle East and Africa Smart Flow Meter Industry Revenue (Million), by Type 2025 & 2033
- Figure 35: Middle East and Africa Smart Flow Meter Industry Revenue Share (%), by Type 2025 & 2033
- Figure 36: Middle East and Africa Smart Flow Meter Industry Revenue (Million), by Communication Protocol 2025 & 2033
- Figure 37: Middle East and Africa Smart Flow Meter Industry Revenue Share (%), by Communication Protocol 2025 & 2033
- Figure 38: Middle East and Africa Smart Flow Meter Industry Revenue (Million), by End-User Industry 2025 & 2033
- Figure 39: Middle East and Africa Smart Flow Meter Industry Revenue Share (%), by End-User Industry 2025 & 2033
- Figure 40: Middle East and Africa Smart Flow Meter Industry Revenue (Million), by Country 2025 & 2033
- Figure 41: Middle East and Africa Smart Flow Meter Industry Revenue Share (%), by Country 2025 & 2033
List of Tables
- Table 1: Global Smart Flow Meter Industry Revenue Million Forecast, by Type 2020 & 2033
- Table 2: Global Smart Flow Meter Industry Revenue Million Forecast, by Communication Protocol 2020 & 2033
- Table 3: Global Smart Flow Meter Industry Revenue Million Forecast, by End-User Industry 2020 & 2033
- Table 4: Global Smart Flow Meter Industry Revenue Million Forecast, by Region 2020 & 2033
- Table 5: Global Smart Flow Meter Industry Revenue Million Forecast, by Type 2020 & 2033
- Table 6: Global Smart Flow Meter Industry Revenue Million Forecast, by Communication Protocol 2020 & 2033
- Table 7: Global Smart Flow Meter Industry Revenue Million Forecast, by End-User Industry 2020 & 2033
- Table 8: Global Smart Flow Meter Industry Revenue Million Forecast, by Country 2020 & 2033
- Table 9: Global Smart Flow Meter Industry Revenue Million Forecast, by Type 2020 & 2033
- Table 10: Global Smart Flow Meter Industry Revenue Million Forecast, by Communication Protocol 2020 & 2033
- Table 11: Global Smart Flow Meter Industry Revenue Million Forecast, by End-User Industry 2020 & 2033
- Table 12: Global Smart Flow Meter Industry Revenue Million Forecast, by Country 2020 & 2033
- Table 13: Global Smart Flow Meter Industry Revenue Million Forecast, by Type 2020 & 2033
- Table 14: Global Smart Flow Meter Industry Revenue Million Forecast, by Communication Protocol 2020 & 2033
- Table 15: Global Smart Flow Meter Industry Revenue Million Forecast, by End-User Industry 2020 & 2033
- Table 16: Global Smart Flow Meter Industry Revenue Million Forecast, by Country 2020 & 2033
- Table 17: Global Smart Flow Meter Industry Revenue Million Forecast, by Type 2020 & 2033
- Table 18: Global Smart Flow Meter Industry Revenue Million Forecast, by Communication Protocol 2020 & 2033
- Table 19: Global Smart Flow Meter Industry Revenue Million Forecast, by End-User Industry 2020 & 2033
- Table 20: Global Smart Flow Meter Industry Revenue Million Forecast, by Country 2020 & 2033
- Table 21: Global Smart Flow Meter Industry Revenue Million Forecast, by Type 2020 & 2033
- Table 22: Global Smart Flow Meter Industry Revenue Million Forecast, by Communication Protocol 2020 & 2033
- Table 23: Global Smart Flow Meter Industry Revenue Million Forecast, by End-User Industry 2020 & 2033
- Table 24: Global Smart Flow Meter Industry Revenue Million Forecast, by Country 2020 & 2033
Frequently Asked Questions
1. What is the projected Compound Annual Growth Rate (CAGR) of the Smart Flow Meter Industry?
The projected CAGR is approximately 5.59%.
2. Which companies are prominent players in the Smart Flow Meter Industry?
Key companies in the market include Honeywell International Inc, Sierra Instruments Inc, Emerson Electric Co, Siemens AG, Brooks Instrument, KROHNE Messtechnik GmbH, Fuji Electric, ABB Ltd *List Not Exhaustive, Azbil Corporation, Yokogawa Electric Corporation, Endress + Hauser AG, General Electric Company, Teledyne Isco Inc.
3. What are the main segments of the Smart Flow Meter Industry?
The market segments include Type, Communication Protocol, End-User Industry.
4. Can you provide details about the market size?
The market size is estimated to be USD 3.34 Million as of 2022.
5. What are some drivers contributing to market growth?
Growing Penetration of Advanced Flow Meters in the Oil and Gas Sector and Water & Wastewater Management; Penetration of IoT in Flow Rate Measurement Solutions.
6. What are the notable trends driving market growth?
Food and Beverages Industry to Witness the Highest Growth.
7. Are there any restraints impacting market growth?
Higher Cost of Intelligent Flow Meters Compared to Traditional Flow Meters; High Initial Cost for Coriolis and Magnetic Flow Meters.
8. Can you provide examples of recent developments in the market?
April 2022 - Yokogawa Electric Corporation released OpreXVortex Flowmeter VY Series. The new series will be released in Southeast Asia, Oceania, India, the Middle East, and South America, excluding Brazil. The product will support remote maintenance functions that allow condition-based maintenance.
9. What pricing options are available for accessing the report?
Pricing options include single-user, multi-user, and enterprise licenses priced at USD 4750, USD 5250, and USD 8750 respectively.
10. Is the market size provided in terms of value or volume?
The market size is provided in terms of value, measured in Million.
11. Are there any specific market keywords associated with the report?
Yes, the market keyword associated with the report is "Smart Flow Meter Industry," which aids in identifying and referencing the specific market segment covered.
12. How do I determine which pricing option suits my needs best?
The pricing options vary based on user requirements and access needs. Individual users may opt for single-user licenses, while businesses requiring broader access may choose multi-user or enterprise licenses for cost-effective access to the report.
13. Are there any additional resources or data provided in the Smart Flow Meter Industry report?
While the report offers comprehensive insights, it's advisable to review the specific contents or supplementary materials provided to ascertain if additional resources or data are available.
14. How can I stay updated on further developments or reports in the Smart Flow Meter Industry?
To stay informed about further developments, trends, and reports in the Smart Flow Meter Industry, consider subscribing to industry newsletters, following relevant companies and organizations, or regularly checking reputable industry news sources and publications.
Methodology
Step 1 - Identification of Relevant Samples Size from Population Database


Step 2 - Approaches for Defining Global Market Size (Value, Volume* & Price*)

Note*: In applicable scenarios
Step 3 - Data Sources
Primary Research
- Web Analytics
- Survey Reports
- Research Institute
- Latest Research Reports
- Opinion Leaders
Secondary Research
- Annual Reports
- White Paper
- Latest Press Release
- Industry Association
- Paid Database
- Investor Presentations

Step 4 - Data Triangulation
Involves using different sources of information in order to increase the validity of a study
These sources are likely to be stakeholders in a program - participants, other researchers, program staff, other community members, and so on.
Then we put all data in single framework & apply various statistical tools to find out the dynamic on the market.
During the analysis stage, feedback from the stakeholder groups would be compared to determine areas of agreement as well as areas of divergence
