
Key Insights
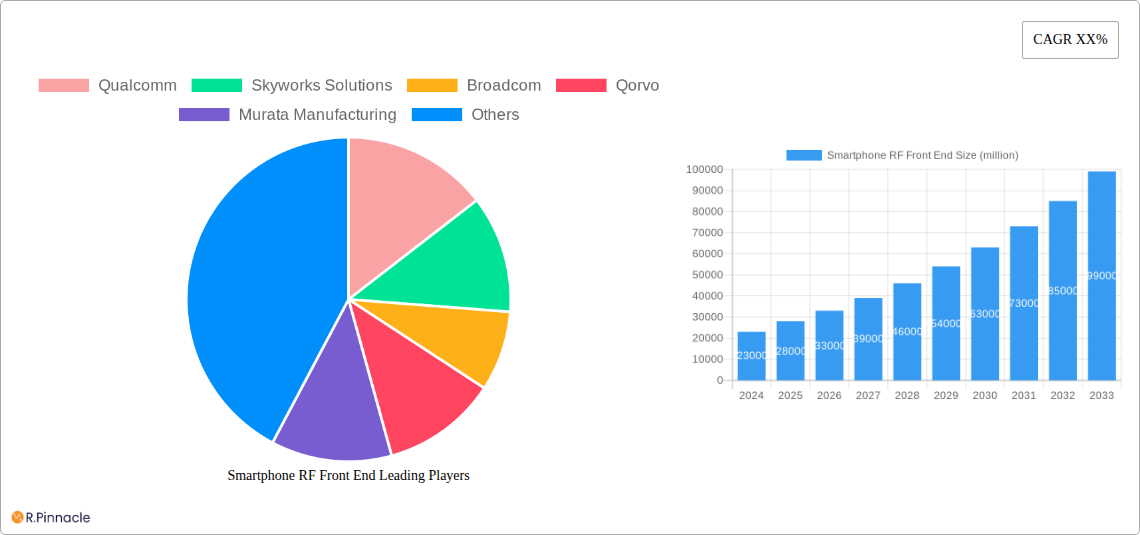
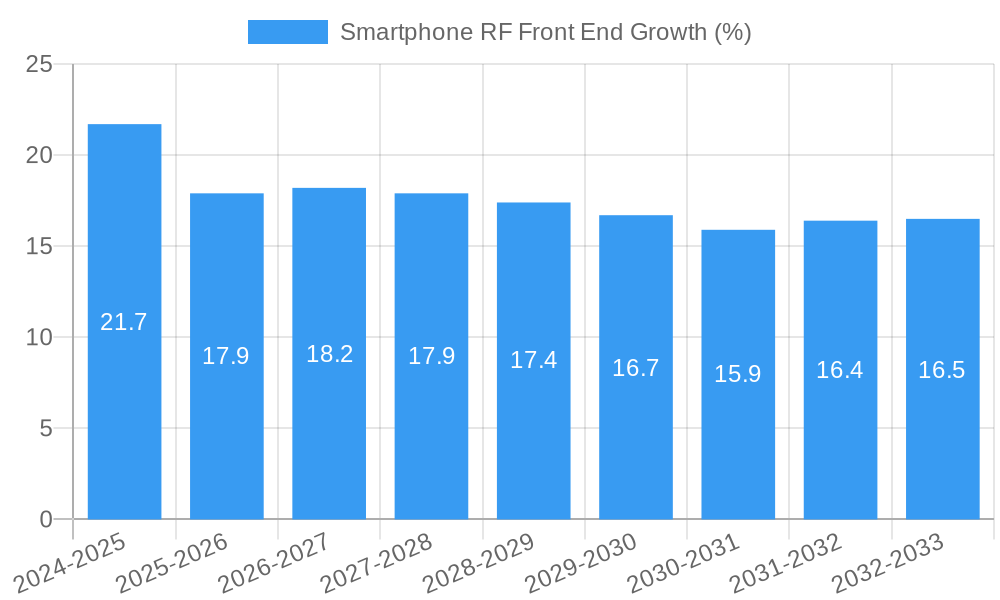
The global Smartphone RF Front End market is poised for substantial growth, projected to reach approximately \$28,000 million by 2025, with an estimated Compound Annual Growth Rate (CAGR) of 18% through 2033. This robust expansion is primarily fueled by the accelerating adoption of 5G technology across the globe. The increasing demand for higher data speeds, lower latency, and enhanced connectivity in mobile devices directly translates to a greater need for sophisticated RF front-end components. Power amplifiers, RF switches, and RF filters are integral to enabling these advanced capabilities, driving their market demand. Furthermore, the continuous innovation in smartphone designs, including foldable devices and the integration of multiple frequency bands for global roaming, necessitates more complex and efficient RF front-end solutions, further bolstering market growth.
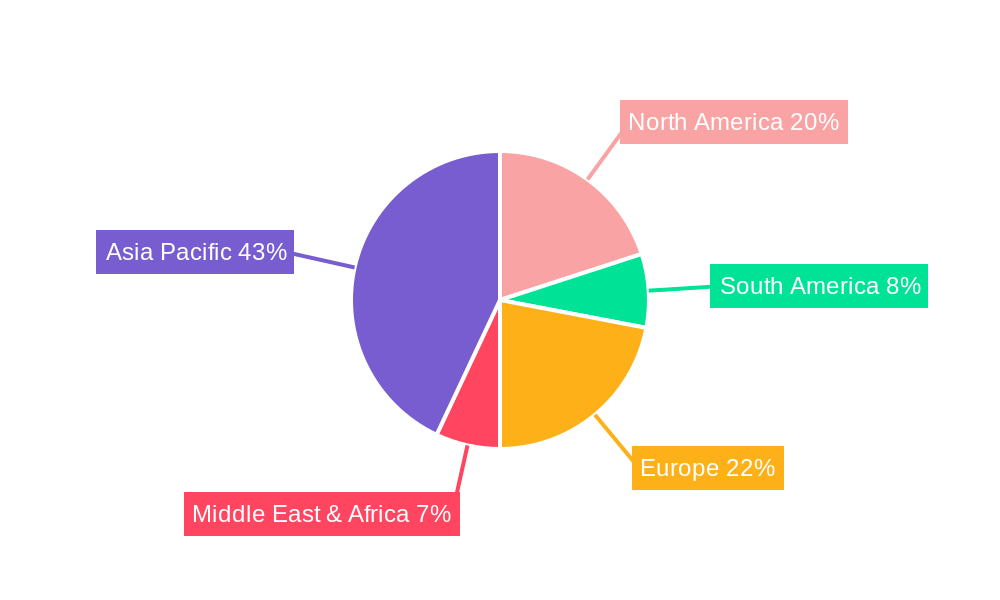
The market is segmented into 5G and Non-5G mobile phones, with the 5G segment experiencing disproportionately higher growth due to the ongoing network rollout and device migration. Key players like Qualcomm, Skyworks Solutions, Broadcom, and Qorvo are at the forefront of this evolving landscape, investing heavily in research and development to deliver cutting-edge solutions that meet the stringent requirements of next-generation mobile communication. Geographically, the Asia Pacific region, particularly China and South Korea, is expected to dominate the market, driven by strong smartphone manufacturing capabilities and a rapidly expanding 5G user base. Emerging trends such as miniaturization of components, improved power efficiency, and the integration of artificial intelligence for optimizing RF performance will continue to shape the competitive dynamics of this vital market.
This in-depth report provides a definitive analysis of the global Smartphone RF Front End market, offering critical insights for industry stakeholders navigating this dynamic sector. With a study period spanning 2019–2033, a base year of 2025, and a forecast period from 2025–2033, this report leverages historical data (2019–2024) to deliver accurate projections. We delve into market structure, dynamics, regional dominance, product innovations, and the strategic imperatives driving growth. Expect actionable intelligence on segments like 5G Mobile Phone and Non-5G Mobile Phone, and types including Power Amplifier, RF Switch, RF Filter, Low Noise Amplifier, and Others.
Smartphone RF Front End Market Structure & Innovation Trends
The Smartphone RF Front End market exhibits a moderate to high concentration, with key players like Qualcomm, Skyworks Solutions, Broadcom, Qorvo, and Murata Manufacturing holding significant market share, estimated to be upwards of 70% collectively. Innovation is the primary driver of market expansion, fueled by the relentless demand for enhanced mobile connectivity, faster data speeds, and improved battery efficiency. Regulatory frameworks, particularly those governing spectrum allocation and device emissions, play a crucial role in shaping product development and market access. While direct product substitutes are limited for core RF front-end components, advancements in antenna integration and software-defined radio technologies represent potential evolutionary pressures. End-user demographics, predominantly smartphone users globally, are increasingly sophisticated, demanding premium performance and seamless connectivity across diverse applications. Mergers and acquisitions (M&A) remain a strategic tool for market consolidation and technology acquisition, with recent deal values in the high hundreds of million to low billions of dollars influencing competitive landscapes. The market is characterized by continuous R&D investment, with an estimated 15-20% of revenue reinvested annually by leading firms.
Smartphone RF Front End Market Dynamics & Trends
The global Smartphone RF Front End market is poised for robust expansion, driven by an accelerating global smartphone adoption rate and the pervasive rollout of 5G infrastructure. The market is projected to experience a Compound Annual Growth Rate (CAGR) of approximately 12% during the forecast period. This growth is underpinned by the insatiable consumer demand for enhanced mobile experiences, including high-definition video streaming, immersive gaming, and seamless augmented and virtual reality applications, all of which necessitate superior RF performance. Technological disruptions are primarily centered around the miniaturization of components, increased integration (System-in-Package - SiP), and the development of advanced materials and architectures to support higher frequency bands and broader bandwidths required for 5G and future 6G technologies. Consumer preferences are increasingly leaning towards devices that offer superior signal strength, faster download and upload speeds, and exceptional battery life, directly influencing the specifications and performance requirements of RF front-end modules. Competitive dynamics are intense, with established players continually innovating to maintain their market leadership while new entrants vie for market share through specialized solutions or cost advantages. The market penetration of 5G-capable smartphones is expected to surpass 85% by 2028, a key metric driving demand for advanced RF front-end solutions. Furthermore, the growing prevalence of feature-rich smartphones in emerging economies, coupled with the increasing average selling price (ASP) of premium devices, contributes significantly to overall market value, estimated to reach over 20 billion dollars by 2025.
Dominant Regions & Segments in Smartphone RF Front End
North America, particularly the United States, stands as a dominant region in the Smartphone RF Front End market, largely due to its early adoption of 5G technology and the presence of major smartphone manufacturers and R&D hubs. Economic policies that foster technological innovation and significant infrastructure investments in 5G networks further solidify this dominance.
- Key Drivers in North America:
- Early 5G Rollout: Extensive deployment of 5G networks has spurred demand for advanced RF front-end components.
- High Smartphone Penetration & Upgrading: Consumers consistently upgrade to the latest smartphone models with superior connectivity features.
- Strong R&D Ecosystem: Presence of leading semiconductor companies and research institutions fuels innovation.
- Favorable Regulatory Environment: Government support for 5G deployment and spectrum availability.
The 5G Mobile Phone segment is the primary growth engine within the application landscape, projected to account for over 75% of the market by 2028. This dominance is a direct consequence of global 5G network expansion and the increasing consumer demand for higher data speeds and lower latency.
- Dominance in 5G Mobile Phone Segment:
- Increased Component Complexity: 5G technology requires more sophisticated RF front-end modules to support multiple frequency bands and advanced modulation schemes.
- Higher Average Selling Price (ASP): 5G-enabled smartphones, and their associated RF front-end components, generally command higher prices.
- Continuous Innovation: Manufacturers are actively developing new solutions for mmWave, sub-6 GHz, and carrier aggregation.
Among the Types of RF front-end components, Power Amplifiers (PAs) represent the largest segment, estimated to hold over 40% of the market share. This is attributed to their critical role in amplifying radio signals for transmission, a necessity for every mobile communication.
- Dominance in Power Amplifiers Segment:
- Essential Functionality: PAs are indispensable for signal transmission across all mobile communication standards.
- Technological Advancements: Ongoing improvements in efficiency, linearity, and power handling capabilities are crucial for battery life and performance.
- High Volume Demand: The sheer volume of smartphones produced globally translates into substantial demand for PAs.
Smartphone RF Front End Product Innovations
Product innovation in the Smartphone RF Front End market is characterized by the relentless pursuit of miniaturization, higher integration, and improved performance across all frequency bands. Companies are developing advanced Power Amplifiers with enhanced efficiency and linearity, crucial for 5G and beyond. RF Filters are becoming more sophisticated, offering sharper selectivity to manage congested spectrum. RF Switches are evolving towards lower insertion loss and higher isolation for seamless band switching. Low Noise Amplifiers (LNAs) are being optimized for increased sensitivity and reduced noise figures, critical for weak signal reception. Competitive advantages are being forged through innovative packaging solutions, GaN and GaAs technologies, and integrated module designs that reduce bill of materials and board space for smartphone manufacturers.
Report Scope & Segmentation Analysis
This report meticulously analyzes the Smartphone RF Front End market across key segmentation parameters. The 5G Mobile Phone segment is experiencing exponential growth, projected to reach a market size of over 15 billion dollars by 2027, driven by global 5G network infrastructure expansion and the increasing adoption of 5G-enabled devices. Conversely, the Non-5G Mobile Phone segment, while still significant, is projected for moderate decline as 5G becomes mainstream. In terms of component Types, the Power Amplifier segment continues to dominate, expected to maintain a market share exceeding 40% through the forecast period due to its fundamental role in mobile communication. The RF Switch segment, crucial for managing diverse frequency bands, is also experiencing steady growth. RF Filters are seeing increased demand for advanced solutions that can handle wider bandwidths and improve spectral efficiency. The Low Noise Amplifier segment, vital for signal reception, is also a key contributor. The Others category encompasses a range of specialized components, contributing to the overall ecosystem.
Key Drivers of Smartphone RF Front End Growth
The growth of the Smartphone RF Front End market is propelled by a confluence of factors. The accelerating global deployment of 5G networks is a primary catalyst, demanding more sophisticated and higher-performing RF front-end solutions to support expanded bandwidths and new frequency bands. The insatiable consumer appetite for faster data speeds, enhanced mobile gaming, and richer multimedia experiences directly translates into a need for advanced connectivity, which RF front-end components facilitate. Furthermore, the continuous evolution of smartphone designs, pushing for thinner and lighter devices, necessitates highly integrated and miniaturized RF front-end modules. Regulatory mandates and government initiatives promoting 5G adoption and digital transformation in various economies also contribute significantly. The increasing average selling price of smartphones, especially premium 5G models, further bolsters market value.
Challenges in the Smartphone RF Front End Sector
Despite its strong growth trajectory, the Smartphone RF Front End sector faces several hurdles. Intense price competition among manufacturers, particularly for commoditized components, can compress profit margins. Supply chain disruptions, as witnessed by global shortages of key raw materials and manufacturing capacity constraints, pose significant risks to production and delivery timelines. The complexity of integrating multiple RF components into compact smartphone designs presents engineering challenges and requires substantial R&D investment. Evolving regulatory standards for spectrum usage and device emissions necessitate constant adaptation and compliance, adding to development costs. The rapid pace of technological advancement also means that components can become obsolete quickly, requiring continuous innovation to stay competitive.
Emerging Opportunities in Smartphone RF Front End
Emerging opportunities in the Smartphone RF Front End market lie in the continued expansion of 5G into new regions and the development of specialized solutions for emerging use cases. The evolution towards 6G technology presents a significant long-term opportunity for innovation in new frequency bands and advanced signal processing. The growing demand for connected devices beyond smartphones, such as IoT devices, wearables, and automotive applications, opens up new markets for RF front-end components. Advancements in material science, leading to more efficient and smaller components, are also creating new avenues for product development. Furthermore, the increasing focus on power efficiency in mobile devices presents an opportunity for developers of ultra-low-power RF solutions.
Leading Players in the Smartphone RF Front End Market
Qualcomm Skyworks Solutions Broadcom Qorvo Murata Manufacturing NXP Semiconductors TDK Infineon Technologies STMicroelectronics Maxscend Technologies Unisoc Vanchip(tianjin)technology TAIYO YUDEN
Key Developments in Smartphone RF Front End Industry
- 2023/Q4: Skyworks Solutions announces advancements in its FEMs for 5G mmWave applications, enhancing performance and efficiency.
- 2023/Q3: Qualcomm unveils new Snapdragon mobile platforms with integrated RF front-end solutions, emphasizing seamless 5G connectivity.
- 2023/Q2: Broadcom launches a new series of high-performance RF filters for 5G smartphones, addressing spectral efficiency challenges.
- 2023/Q1: Qorvo introduces innovative GaN-based power amplifiers for improved power efficiency in next-generation mobile devices.
- 2022/Q4: Murata Manufacturing expands its portfolio of integrated RF modules, offering enhanced miniaturization and functionality.
Future Outlook for Smartphone RF Front End Market
The future outlook for the Smartphone RF Front End market is exceptionally promising, driven by the continued expansion and evolution of wireless communication technologies. The ongoing global transition to 5G, coupled with the nascent development of 6G, will necessitate a sustained demand for advanced RF front-end components. Innovations in areas like spectrum sharing, higher frequency bands, and increased antenna integration will drive further market growth. The expanding ecosystem of connected devices, from IoT to advanced automotive systems, will also contribute to market expansion beyond traditional smartphones. Strategic partnerships and acquisitions are likely to continue shaping the competitive landscape, as companies seek to secure intellectual property and expand their technological capabilities to meet the ever-increasing demands for speed, efficiency, and connectivity. The market is set for significant value creation as it enables the next generation of mobile experiences and digital innovation.
Smartphone RF Front End Segmentation
-
1. Application
- 1.1. 5G Mobile Phone
- 1.2. Non-5G Mobile Phone
-
2. Types
- 2.1. Power Amplifier
- 2.2. RF Switch
- 2.3. RF Filter
- 2.4. Low Noise Amplifier
- 2.5. Others
Smartphone RF Front End Segmentation By Geography
-
1. North America
- 1.1. United States
- 1.2. Canada
- 1.3. Mexico
-
2. South America
- 2.1. Brazil
- 2.2. Argentina
- 2.3. Rest of South America
-
3. Europe
- 3.1. United Kingdom
- 3.2. Germany
- 3.3. France
- 3.4. Italy
- 3.5. Spain
- 3.6. Russia
- 3.7. Benelux
- 3.8. Nordics
- 3.9. Rest of Europe
-
4. Middle East & Africa
- 4.1. Turkey
- 4.2. Israel
- 4.3. GCC
- 4.4. North Africa
- 4.5. South Africa
- 4.6. Rest of Middle East & Africa
-
5. Asia Pacific
- 5.1. China
- 5.2. India
- 5.3. Japan
- 5.4. South Korea
- 5.5. ASEAN
- 5.6. Oceania
- 5.7. Rest of Asia Pacific
Smartphone RF Front End REPORT HIGHLIGHTS
| Aspects | Details |
|---|---|
| Study Period | 2019-2033 |
| Base Year | 2024 |
| Estimated Year | 2025 |
| Forecast Period | 2025-2033 |
| Historical Period | 2019-2024 |
| Growth Rate | CAGR of XX% from 2019-2033 |
| Segmentation |
|
Table of Contents
- 1. Introduction
- 1.1. Research Scope
- 1.2. Market Segmentation
- 1.3. Research Methodology
- 1.4. Definitions and Assumptions
- 2. Executive Summary
- 2.1. Introduction
- 3. Market Dynamics
- 3.1. Introduction
- 3.2. Market Drivers
- 3.3. Market Restrains
- 3.4. Market Trends
- 4. Market Factor Analysis
- 4.1. Porters Five Forces
- 4.2. Supply/Value Chain
- 4.3. PESTEL analysis
- 4.4. Market Entropy
- 4.5. Patent/Trademark Analysis
- 5. Global Smartphone RF Front End Analysis, Insights and Forecast, 2019-2031
- 5.1. Market Analysis, Insights and Forecast - by Application
- 5.1.1. 5G Mobile Phone
- 5.1.2. Non-5G Mobile Phone
- 5.2. Market Analysis, Insights and Forecast - by Types
- 5.2.1. Power Amplifier
- 5.2.2. RF Switch
- 5.2.3. RF Filter
- 5.2.4. Low Noise Amplifier
- 5.2.5. Others
- 5.3. Market Analysis, Insights and Forecast - by Region
- 5.3.1. North America
- 5.3.2. South America
- 5.3.3. Europe
- 5.3.4. Middle East & Africa
- 5.3.5. Asia Pacific
- 5.1. Market Analysis, Insights and Forecast - by Application
- 6. North America Smartphone RF Front End Analysis, Insights and Forecast, 2019-2031
- 6.1. Market Analysis, Insights and Forecast - by Application
- 6.1.1. 5G Mobile Phone
- 6.1.2. Non-5G Mobile Phone
- 6.2. Market Analysis, Insights and Forecast - by Types
- 6.2.1. Power Amplifier
- 6.2.2. RF Switch
- 6.2.3. RF Filter
- 6.2.4. Low Noise Amplifier
- 6.2.5. Others
- 6.1. Market Analysis, Insights and Forecast - by Application
- 7. South America Smartphone RF Front End Analysis, Insights and Forecast, 2019-2031
- 7.1. Market Analysis, Insights and Forecast - by Application
- 7.1.1. 5G Mobile Phone
- 7.1.2. Non-5G Mobile Phone
- 7.2. Market Analysis, Insights and Forecast - by Types
- 7.2.1. Power Amplifier
- 7.2.2. RF Switch
- 7.2.3. RF Filter
- 7.2.4. Low Noise Amplifier
- 7.2.5. Others
- 7.1. Market Analysis, Insights and Forecast - by Application
- 8. Europe Smartphone RF Front End Analysis, Insights and Forecast, 2019-2031
- 8.1. Market Analysis, Insights and Forecast - by Application
- 8.1.1. 5G Mobile Phone
- 8.1.2. Non-5G Mobile Phone
- 8.2. Market Analysis, Insights and Forecast - by Types
- 8.2.1. Power Amplifier
- 8.2.2. RF Switch
- 8.2.3. RF Filter
- 8.2.4. Low Noise Amplifier
- 8.2.5. Others
- 8.1. Market Analysis, Insights and Forecast - by Application
- 9. Middle East & Africa Smartphone RF Front End Analysis, Insights and Forecast, 2019-2031
- 9.1. Market Analysis, Insights and Forecast - by Application
- 9.1.1. 5G Mobile Phone
- 9.1.2. Non-5G Mobile Phone
- 9.2. Market Analysis, Insights and Forecast - by Types
- 9.2.1. Power Amplifier
- 9.2.2. RF Switch
- 9.2.3. RF Filter
- 9.2.4. Low Noise Amplifier
- 9.2.5. Others
- 9.1. Market Analysis, Insights and Forecast - by Application
- 10. Asia Pacific Smartphone RF Front End Analysis, Insights and Forecast, 2019-2031
- 10.1. Market Analysis, Insights and Forecast - by Application
- 10.1.1. 5G Mobile Phone
- 10.1.2. Non-5G Mobile Phone
- 10.2. Market Analysis, Insights and Forecast - by Types
- 10.2.1. Power Amplifier
- 10.2.2. RF Switch
- 10.2.3. RF Filter
- 10.2.4. Low Noise Amplifier
- 10.2.5. Others
- 10.1. Market Analysis, Insights and Forecast - by Application
- 11. Competitive Analysis
- 11.1. Global Market Share Analysis 2024
- 11.2. Company Profiles
- 11.2.1 Qualcomm
- 11.2.1.1. Overview
- 11.2.1.2. Products
- 11.2.1.3. SWOT Analysis
- 11.2.1.4. Recent Developments
- 11.2.1.5. Financials (Based on Availability)
- 11.2.2 Skyworks Solutions
- 11.2.2.1. Overview
- 11.2.2.2. Products
- 11.2.2.3. SWOT Analysis
- 11.2.2.4. Recent Developments
- 11.2.2.5. Financials (Based on Availability)
- 11.2.3 Broadcom
- 11.2.3.1. Overview
- 11.2.3.2. Products
- 11.2.3.3. SWOT Analysis
- 11.2.3.4. Recent Developments
- 11.2.3.5. Financials (Based on Availability)
- 11.2.4 Qorvo
- 11.2.4.1. Overview
- 11.2.4.2. Products
- 11.2.4.3. SWOT Analysis
- 11.2.4.4. Recent Developments
- 11.2.4.5. Financials (Based on Availability)
- 11.2.5 Murata Manufacturing
- 11.2.5.1. Overview
- 11.2.5.2. Products
- 11.2.5.3. SWOT Analysis
- 11.2.5.4. Recent Developments
- 11.2.5.5. Financials (Based on Availability)
- 11.2.6 NXP Semiconductors
- 11.2.6.1. Overview
- 11.2.6.2. Products
- 11.2.6.3. SWOT Analysis
- 11.2.6.4. Recent Developments
- 11.2.6.5. Financials (Based on Availability)
- 11.2.7 TDK
- 11.2.7.1. Overview
- 11.2.7.2. Products
- 11.2.7.3. SWOT Analysis
- 11.2.7.4. Recent Developments
- 11.2.7.5. Financials (Based on Availability)
- 11.2.8 Infineon Technologies
- 11.2.8.1. Overview
- 11.2.8.2. Products
- 11.2.8.3. SWOT Analysis
- 11.2.8.4. Recent Developments
- 11.2.8.5. Financials (Based on Availability)
- 11.2.9 STMicroelectronics
- 11.2.9.1. Overview
- 11.2.9.2. Products
- 11.2.9.3. SWOT Analysis
- 11.2.9.4. Recent Developments
- 11.2.9.5. Financials (Based on Availability)
- 11.2.10 Maxscend Technologies
- 11.2.10.1. Overview
- 11.2.10.2. Products
- 11.2.10.3. SWOT Analysis
- 11.2.10.4. Recent Developments
- 11.2.10.5. Financials (Based on Availability)
- 11.2.11 Unisoc
- 11.2.11.1. Overview
- 11.2.11.2. Products
- 11.2.11.3. SWOT Analysis
- 11.2.11.4. Recent Developments
- 11.2.11.5. Financials (Based on Availability)
- 11.2.12 Vanchip(tianjin)technology
- 11.2.12.1. Overview
- 11.2.12.2. Products
- 11.2.12.3. SWOT Analysis
- 11.2.12.4. Recent Developments
- 11.2.12.5. Financials (Based on Availability)
- 11.2.13 TAIYO YUDEN
- 11.2.13.1. Overview
- 11.2.13.2. Products
- 11.2.13.3. SWOT Analysis
- 11.2.13.4. Recent Developments
- 11.2.13.5. Financials (Based on Availability)
- 11.2.1 Qualcomm
List of Figures
- Figure 1: Global Smartphone RF Front End Revenue Breakdown (million, %) by Region 2024 & 2032
- Figure 2: Global Smartphone RF Front End Volume Breakdown (K, %) by Region 2024 & 2032
- Figure 3: North America Smartphone RF Front End Revenue (million), by Application 2024 & 2032
- Figure 4: North America Smartphone RF Front End Volume (K), by Application 2024 & 2032
- Figure 5: North America Smartphone RF Front End Revenue Share (%), by Application 2024 & 2032
- Figure 6: North America Smartphone RF Front End Volume Share (%), by Application 2024 & 2032
- Figure 7: North America Smartphone RF Front End Revenue (million), by Types 2024 & 2032
- Figure 8: North America Smartphone RF Front End Volume (K), by Types 2024 & 2032
- Figure 9: North America Smartphone RF Front End Revenue Share (%), by Types 2024 & 2032
- Figure 10: North America Smartphone RF Front End Volume Share (%), by Types 2024 & 2032
- Figure 11: North America Smartphone RF Front End Revenue (million), by Country 2024 & 2032
- Figure 12: North America Smartphone RF Front End Volume (K), by Country 2024 & 2032
- Figure 13: North America Smartphone RF Front End Revenue Share (%), by Country 2024 & 2032
- Figure 14: North America Smartphone RF Front End Volume Share (%), by Country 2024 & 2032
- Figure 15: South America Smartphone RF Front End Revenue (million), by Application 2024 & 2032
- Figure 16: South America Smartphone RF Front End Volume (K), by Application 2024 & 2032
- Figure 17: South America Smartphone RF Front End Revenue Share (%), by Application 2024 & 2032
- Figure 18: South America Smartphone RF Front End Volume Share (%), by Application 2024 & 2032
- Figure 19: South America Smartphone RF Front End Revenue (million), by Types 2024 & 2032
- Figure 20: South America Smartphone RF Front End Volume (K), by Types 2024 & 2032
- Figure 21: South America Smartphone RF Front End Revenue Share (%), by Types 2024 & 2032
- Figure 22: South America Smartphone RF Front End Volume Share (%), by Types 2024 & 2032
- Figure 23: South America Smartphone RF Front End Revenue (million), by Country 2024 & 2032
- Figure 24: South America Smartphone RF Front End Volume (K), by Country 2024 & 2032
- Figure 25: South America Smartphone RF Front End Revenue Share (%), by Country 2024 & 2032
- Figure 26: South America Smartphone RF Front End Volume Share (%), by Country 2024 & 2032
- Figure 27: Europe Smartphone RF Front End Revenue (million), by Application 2024 & 2032
- Figure 28: Europe Smartphone RF Front End Volume (K), by Application 2024 & 2032
- Figure 29: Europe Smartphone RF Front End Revenue Share (%), by Application 2024 & 2032
- Figure 30: Europe Smartphone RF Front End Volume Share (%), by Application 2024 & 2032
- Figure 31: Europe Smartphone RF Front End Revenue (million), by Types 2024 & 2032
- Figure 32: Europe Smartphone RF Front End Volume (K), by Types 2024 & 2032
- Figure 33: Europe Smartphone RF Front End Revenue Share (%), by Types 2024 & 2032
- Figure 34: Europe Smartphone RF Front End Volume Share (%), by Types 2024 & 2032
- Figure 35: Europe Smartphone RF Front End Revenue (million), by Country 2024 & 2032
- Figure 36: Europe Smartphone RF Front End Volume (K), by Country 2024 & 2032
- Figure 37: Europe Smartphone RF Front End Revenue Share (%), by Country 2024 & 2032
- Figure 38: Europe Smartphone RF Front End Volume Share (%), by Country 2024 & 2032
- Figure 39: Middle East & Africa Smartphone RF Front End Revenue (million), by Application 2024 & 2032
- Figure 40: Middle East & Africa Smartphone RF Front End Volume (K), by Application 2024 & 2032
- Figure 41: Middle East & Africa Smartphone RF Front End Revenue Share (%), by Application 2024 & 2032
- Figure 42: Middle East & Africa Smartphone RF Front End Volume Share (%), by Application 2024 & 2032
- Figure 43: Middle East & Africa Smartphone RF Front End Revenue (million), by Types 2024 & 2032
- Figure 44: Middle East & Africa Smartphone RF Front End Volume (K), by Types 2024 & 2032
- Figure 45: Middle East & Africa Smartphone RF Front End Revenue Share (%), by Types 2024 & 2032
- Figure 46: Middle East & Africa Smartphone RF Front End Volume Share (%), by Types 2024 & 2032
- Figure 47: Middle East & Africa Smartphone RF Front End Revenue (million), by Country 2024 & 2032
- Figure 48: Middle East & Africa Smartphone RF Front End Volume (K), by Country 2024 & 2032
- Figure 49: Middle East & Africa Smartphone RF Front End Revenue Share (%), by Country 2024 & 2032
- Figure 50: Middle East & Africa Smartphone RF Front End Volume Share (%), by Country 2024 & 2032
- Figure 51: Asia Pacific Smartphone RF Front End Revenue (million), by Application 2024 & 2032
- Figure 52: Asia Pacific Smartphone RF Front End Volume (K), by Application 2024 & 2032
- Figure 53: Asia Pacific Smartphone RF Front End Revenue Share (%), by Application 2024 & 2032
- Figure 54: Asia Pacific Smartphone RF Front End Volume Share (%), by Application 2024 & 2032
- Figure 55: Asia Pacific Smartphone RF Front End Revenue (million), by Types 2024 & 2032
- Figure 56: Asia Pacific Smartphone RF Front End Volume (K), by Types 2024 & 2032
- Figure 57: Asia Pacific Smartphone RF Front End Revenue Share (%), by Types 2024 & 2032
- Figure 58: Asia Pacific Smartphone RF Front End Volume Share (%), by Types 2024 & 2032
- Figure 59: Asia Pacific Smartphone RF Front End Revenue (million), by Country 2024 & 2032
- Figure 60: Asia Pacific Smartphone RF Front End Volume (K), by Country 2024 & 2032
- Figure 61: Asia Pacific Smartphone RF Front End Revenue Share (%), by Country 2024 & 2032
- Figure 62: Asia Pacific Smartphone RF Front End Volume Share (%), by Country 2024 & 2032
List of Tables
- Table 1: Global Smartphone RF Front End Revenue million Forecast, by Region 2019 & 2032
- Table 2: Global Smartphone RF Front End Volume K Forecast, by Region 2019 & 2032
- Table 3: Global Smartphone RF Front End Revenue million Forecast, by Application 2019 & 2032
- Table 4: Global Smartphone RF Front End Volume K Forecast, by Application 2019 & 2032
- Table 5: Global Smartphone RF Front End Revenue million Forecast, by Types 2019 & 2032
- Table 6: Global Smartphone RF Front End Volume K Forecast, by Types 2019 & 2032
- Table 7: Global Smartphone RF Front End Revenue million Forecast, by Region 2019 & 2032
- Table 8: Global Smartphone RF Front End Volume K Forecast, by Region 2019 & 2032
- Table 9: Global Smartphone RF Front End Revenue million Forecast, by Application 2019 & 2032
- Table 10: Global Smartphone RF Front End Volume K Forecast, by Application 2019 & 2032
- Table 11: Global Smartphone RF Front End Revenue million Forecast, by Types 2019 & 2032
- Table 12: Global Smartphone RF Front End Volume K Forecast, by Types 2019 & 2032
- Table 13: Global Smartphone RF Front End Revenue million Forecast, by Country 2019 & 2032
- Table 14: Global Smartphone RF Front End Volume K Forecast, by Country 2019 & 2032
- Table 15: United States Smartphone RF Front End Revenue (million) Forecast, by Application 2019 & 2032
- Table 16: United States Smartphone RF Front End Volume (K) Forecast, by Application 2019 & 2032
- Table 17: Canada Smartphone RF Front End Revenue (million) Forecast, by Application 2019 & 2032
- Table 18: Canada Smartphone RF Front End Volume (K) Forecast, by Application 2019 & 2032
- Table 19: Mexico Smartphone RF Front End Revenue (million) Forecast, by Application 2019 & 2032
- Table 20: Mexico Smartphone RF Front End Volume (K) Forecast, by Application 2019 & 2032
- Table 21: Global Smartphone RF Front End Revenue million Forecast, by Application 2019 & 2032
- Table 22: Global Smartphone RF Front End Volume K Forecast, by Application 2019 & 2032
- Table 23: Global Smartphone RF Front End Revenue million Forecast, by Types 2019 & 2032
- Table 24: Global Smartphone RF Front End Volume K Forecast, by Types 2019 & 2032
- Table 25: Global Smartphone RF Front End Revenue million Forecast, by Country 2019 & 2032
- Table 26: Global Smartphone RF Front End Volume K Forecast, by Country 2019 & 2032
- Table 27: Brazil Smartphone RF Front End Revenue (million) Forecast, by Application 2019 & 2032
- Table 28: Brazil Smartphone RF Front End Volume (K) Forecast, by Application 2019 & 2032
- Table 29: Argentina Smartphone RF Front End Revenue (million) Forecast, by Application 2019 & 2032
- Table 30: Argentina Smartphone RF Front End Volume (K) Forecast, by Application 2019 & 2032
- Table 31: Rest of South America Smartphone RF Front End Revenue (million) Forecast, by Application 2019 & 2032
- Table 32: Rest of South America Smartphone RF Front End Volume (K) Forecast, by Application 2019 & 2032
- Table 33: Global Smartphone RF Front End Revenue million Forecast, by Application 2019 & 2032
- Table 34: Global Smartphone RF Front End Volume K Forecast, by Application 2019 & 2032
- Table 35: Global Smartphone RF Front End Revenue million Forecast, by Types 2019 & 2032
- Table 36: Global Smartphone RF Front End Volume K Forecast, by Types 2019 & 2032
- Table 37: Global Smartphone RF Front End Revenue million Forecast, by Country 2019 & 2032
- Table 38: Global Smartphone RF Front End Volume K Forecast, by Country 2019 & 2032
- Table 39: United Kingdom Smartphone RF Front End Revenue (million) Forecast, by Application 2019 & 2032
- Table 40: United Kingdom Smartphone RF Front End Volume (K) Forecast, by Application 2019 & 2032
- Table 41: Germany Smartphone RF Front End Revenue (million) Forecast, by Application 2019 & 2032
- Table 42: Germany Smartphone RF Front End Volume (K) Forecast, by Application 2019 & 2032
- Table 43: France Smartphone RF Front End Revenue (million) Forecast, by Application 2019 & 2032
- Table 44: France Smartphone RF Front End Volume (K) Forecast, by Application 2019 & 2032
- Table 45: Italy Smartphone RF Front End Revenue (million) Forecast, by Application 2019 & 2032
- Table 46: Italy Smartphone RF Front End Volume (K) Forecast, by Application 2019 & 2032
- Table 47: Spain Smartphone RF Front End Revenue (million) Forecast, by Application 2019 & 2032
- Table 48: Spain Smartphone RF Front End Volume (K) Forecast, by Application 2019 & 2032
- Table 49: Russia Smartphone RF Front End Revenue (million) Forecast, by Application 2019 & 2032
- Table 50: Russia Smartphone RF Front End Volume (K) Forecast, by Application 2019 & 2032
- Table 51: Benelux Smartphone RF Front End Revenue (million) Forecast, by Application 2019 & 2032
- Table 52: Benelux Smartphone RF Front End Volume (K) Forecast, by Application 2019 & 2032
- Table 53: Nordics Smartphone RF Front End Revenue (million) Forecast, by Application 2019 & 2032
- Table 54: Nordics Smartphone RF Front End Volume (K) Forecast, by Application 2019 & 2032
- Table 55: Rest of Europe Smartphone RF Front End Revenue (million) Forecast, by Application 2019 & 2032
- Table 56: Rest of Europe Smartphone RF Front End Volume (K) Forecast, by Application 2019 & 2032
- Table 57: Global Smartphone RF Front End Revenue million Forecast, by Application 2019 & 2032
- Table 58: Global Smartphone RF Front End Volume K Forecast, by Application 2019 & 2032
- Table 59: Global Smartphone RF Front End Revenue million Forecast, by Types 2019 & 2032
- Table 60: Global Smartphone RF Front End Volume K Forecast, by Types 2019 & 2032
- Table 61: Global Smartphone RF Front End Revenue million Forecast, by Country 2019 & 2032
- Table 62: Global Smartphone RF Front End Volume K Forecast, by Country 2019 & 2032
- Table 63: Turkey Smartphone RF Front End Revenue (million) Forecast, by Application 2019 & 2032
- Table 64: Turkey Smartphone RF Front End Volume (K) Forecast, by Application 2019 & 2032
- Table 65: Israel Smartphone RF Front End Revenue (million) Forecast, by Application 2019 & 2032
- Table 66: Israel Smartphone RF Front End Volume (K) Forecast, by Application 2019 & 2032
- Table 67: GCC Smartphone RF Front End Revenue (million) Forecast, by Application 2019 & 2032
- Table 68: GCC Smartphone RF Front End Volume (K) Forecast, by Application 2019 & 2032
- Table 69: North Africa Smartphone RF Front End Revenue (million) Forecast, by Application 2019 & 2032
- Table 70: North Africa Smartphone RF Front End Volume (K) Forecast, by Application 2019 & 2032
- Table 71: South Africa Smartphone RF Front End Revenue (million) Forecast, by Application 2019 & 2032
- Table 72: South Africa Smartphone RF Front End Volume (K) Forecast, by Application 2019 & 2032
- Table 73: Rest of Middle East & Africa Smartphone RF Front End Revenue (million) Forecast, by Application 2019 & 2032
- Table 74: Rest of Middle East & Africa Smartphone RF Front End Volume (K) Forecast, by Application 2019 & 2032
- Table 75: Global Smartphone RF Front End Revenue million Forecast, by Application 2019 & 2032
- Table 76: Global Smartphone RF Front End Volume K Forecast, by Application 2019 & 2032
- Table 77: Global Smartphone RF Front End Revenue million Forecast, by Types 2019 & 2032
- Table 78: Global Smartphone RF Front End Volume K Forecast, by Types 2019 & 2032
- Table 79: Global Smartphone RF Front End Revenue million Forecast, by Country 2019 & 2032
- Table 80: Global Smartphone RF Front End Volume K Forecast, by Country 2019 & 2032
- Table 81: China Smartphone RF Front End Revenue (million) Forecast, by Application 2019 & 2032
- Table 82: China Smartphone RF Front End Volume (K) Forecast, by Application 2019 & 2032
- Table 83: India Smartphone RF Front End Revenue (million) Forecast, by Application 2019 & 2032
- Table 84: India Smartphone RF Front End Volume (K) Forecast, by Application 2019 & 2032
- Table 85: Japan Smartphone RF Front End Revenue (million) Forecast, by Application 2019 & 2032
- Table 86: Japan Smartphone RF Front End Volume (K) Forecast, by Application 2019 & 2032
- Table 87: South Korea Smartphone RF Front End Revenue (million) Forecast, by Application 2019 & 2032
- Table 88: South Korea Smartphone RF Front End Volume (K) Forecast, by Application 2019 & 2032
- Table 89: ASEAN Smartphone RF Front End Revenue (million) Forecast, by Application 2019 & 2032
- Table 90: ASEAN Smartphone RF Front End Volume (K) Forecast, by Application 2019 & 2032
- Table 91: Oceania Smartphone RF Front End Revenue (million) Forecast, by Application 2019 & 2032
- Table 92: Oceania Smartphone RF Front End Volume (K) Forecast, by Application 2019 & 2032
- Table 93: Rest of Asia Pacific Smartphone RF Front End Revenue (million) Forecast, by Application 2019 & 2032
- Table 94: Rest of Asia Pacific Smartphone RF Front End Volume (K) Forecast, by Application 2019 & 2032
Frequently Asked Questions
1. What is the projected Compound Annual Growth Rate (CAGR) of the Smartphone RF Front End?
The projected CAGR is approximately XX%.
2. Which companies are prominent players in the Smartphone RF Front End?
Key companies in the market include Qualcomm, Skyworks Solutions, Broadcom, Qorvo, Murata Manufacturing, NXP Semiconductors, TDK, Infineon Technologies, STMicroelectronics, Maxscend Technologies, Unisoc, Vanchip(tianjin)technology, TAIYO YUDEN.
3. What are the main segments of the Smartphone RF Front End?
The market segments include Application, Types.
4. Can you provide details about the market size?
The market size is estimated to be USD XXX million as of 2022.
5. What are some drivers contributing to market growth?
N/A
6. What are the notable trends driving market growth?
N/A
7. Are there any restraints impacting market growth?
N/A
8. Can you provide examples of recent developments in the market?
N/A
9. What pricing options are available for accessing the report?
Pricing options include single-user, multi-user, and enterprise licenses priced at USD 3350.00, USD 5025.00, and USD 6700.00 respectively.
10. Is the market size provided in terms of value or volume?
The market size is provided in terms of value, measured in million and volume, measured in K.
11. Are there any specific market keywords associated with the report?
Yes, the market keyword associated with the report is "Smartphone RF Front End," which aids in identifying and referencing the specific market segment covered.
12. How do I determine which pricing option suits my needs best?
The pricing options vary based on user requirements and access needs. Individual users may opt for single-user licenses, while businesses requiring broader access may choose multi-user or enterprise licenses for cost-effective access to the report.
13. Are there any additional resources or data provided in the Smartphone RF Front End report?
While the report offers comprehensive insights, it's advisable to review the specific contents or supplementary materials provided to ascertain if additional resources or data are available.
14. How can I stay updated on further developments or reports in the Smartphone RF Front End?
To stay informed about further developments, trends, and reports in the Smartphone RF Front End, consider subscribing to industry newsletters, following relevant companies and organizations, or regularly checking reputable industry news sources and publications.
Methodology
Step 1 - Identification of Relevant Samples Size from Population Database


Step 2 - Approaches for Defining Global Market Size (Value, Volume* & Price*)

Note*: In applicable scenarios
Step 3 - Data Sources
Primary Research
- Web Analytics
- Survey Reports
- Research Institute
- Latest Research Reports
- Opinion Leaders
Secondary Research
- Annual Reports
- White Paper
- Latest Press Release
- Industry Association
- Paid Database
- Investor Presentations

Step 4 - Data Triangulation
Involves using different sources of information in order to increase the validity of a study
These sources are likely to be stakeholders in a program - participants, other researchers, program staff, other community members, and so on.
Then we put all data in single framework & apply various statistical tools to find out the dynamic on the market.
During the analysis stage, feedback from the stakeholder groups would be compared to determine areas of agreement as well as areas of divergence


