
Key Insights
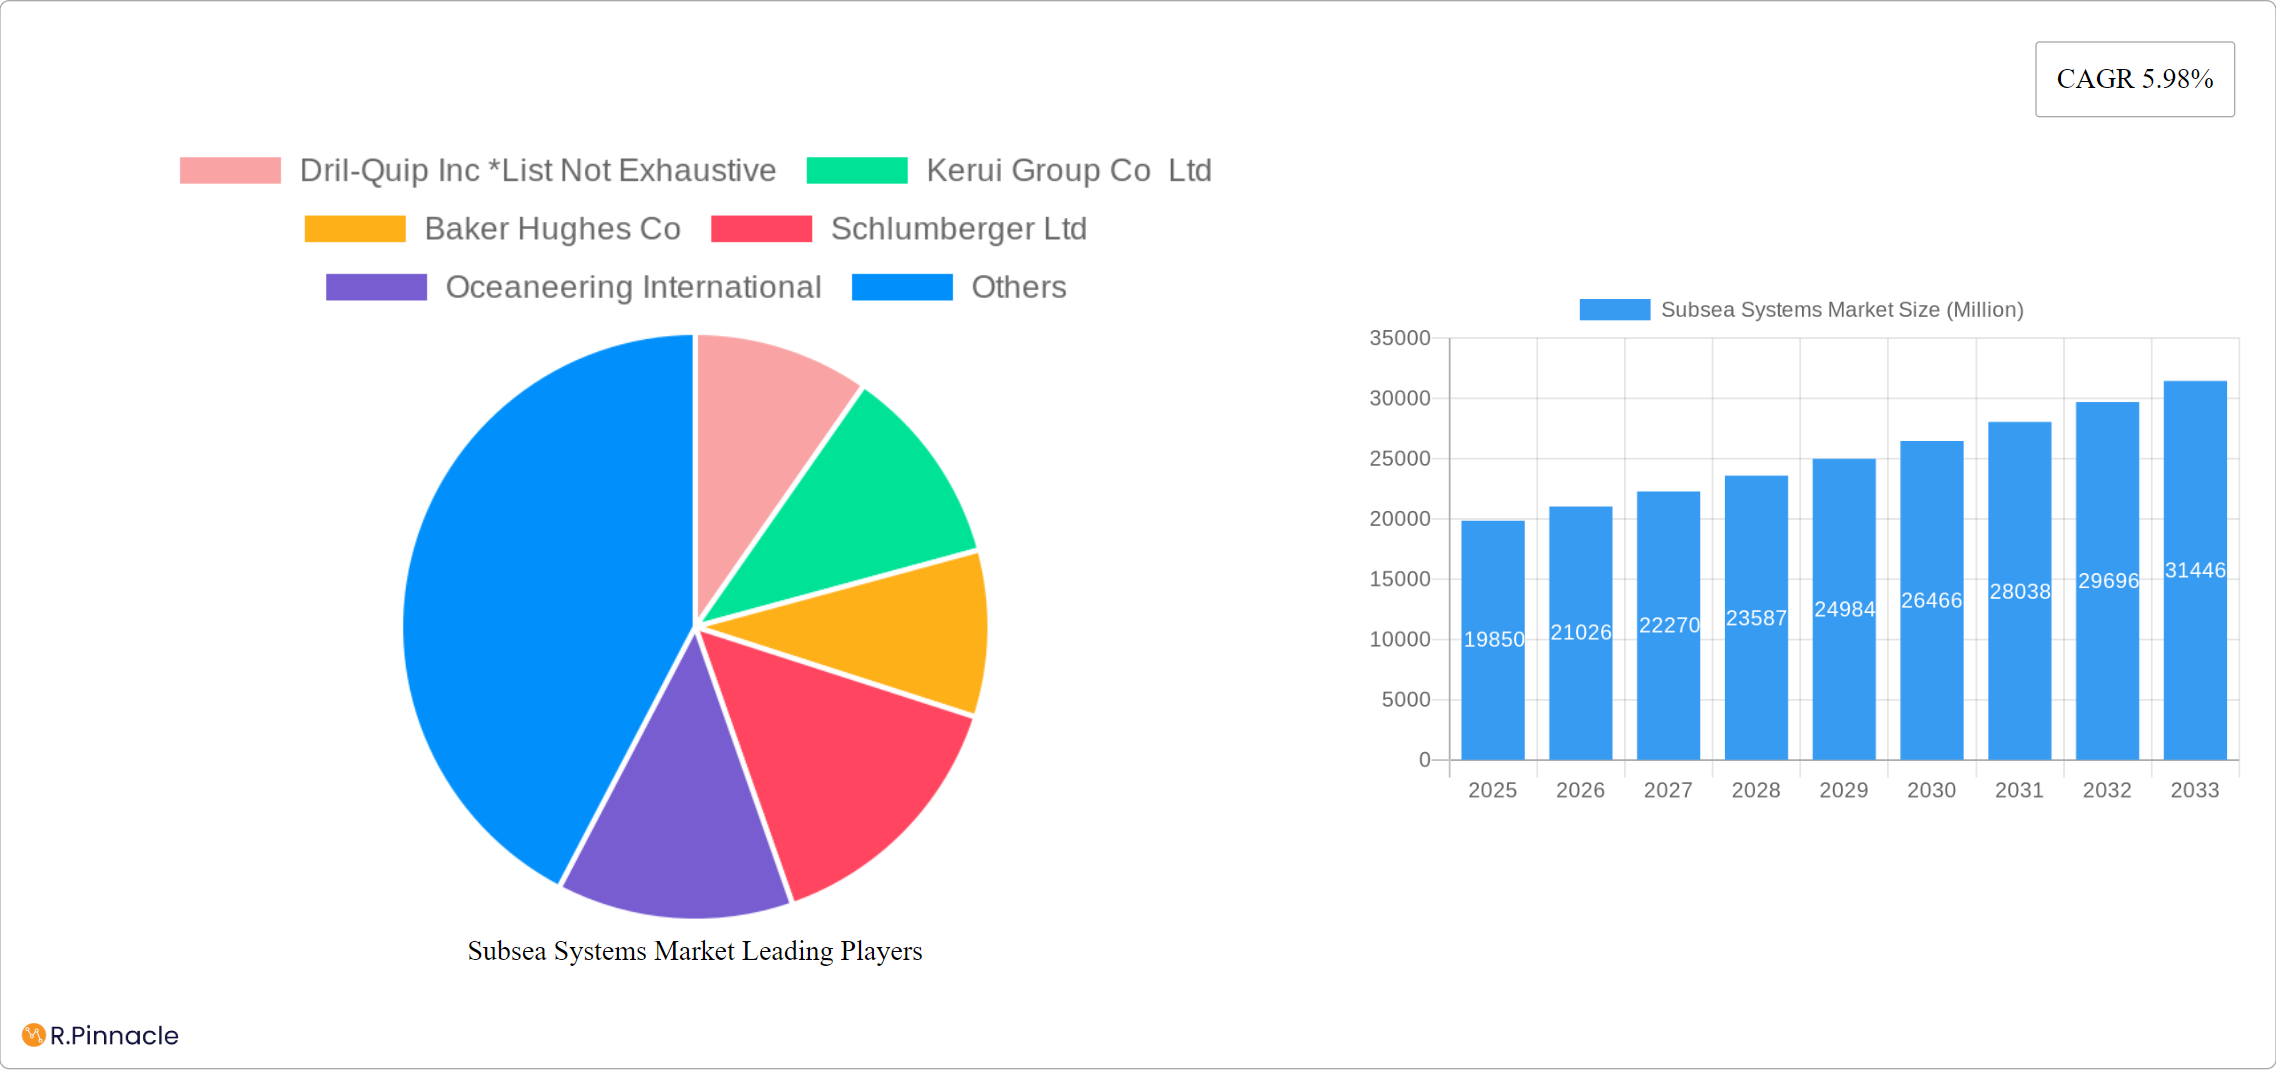
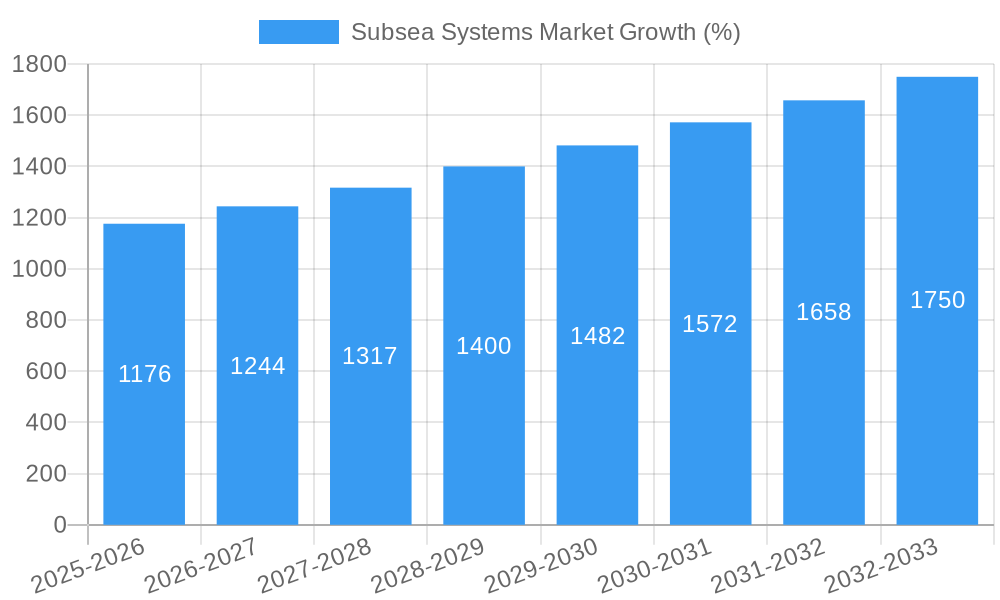
The global subsea systems market, valued at $19.85 billion in 2025, is projected to experience robust growth, driven by increasing offshore oil and gas exploration and production activities, particularly in deepwater environments. The market's Compound Annual Growth Rate (CAGR) of 5.98% from 2025 to 2033 indicates a significant expansion over the forecast period. Key drivers include the rising demand for energy, technological advancements in subsea processing and production systems (leading to enhanced efficiency and cost reduction), and the exploration of new, deeper reserves. The subsea umbilicals, risers, and flowlines (SURF) segment is expected to dominate due to its crucial role in connecting subsea installations to surface facilities. Growing adoption of advanced materials and improved designs contributes to increased efficiency and longevity of these systems. However, the market faces restraints such as high initial investment costs, stringent regulatory requirements, and the inherent risks associated with deepwater operations.
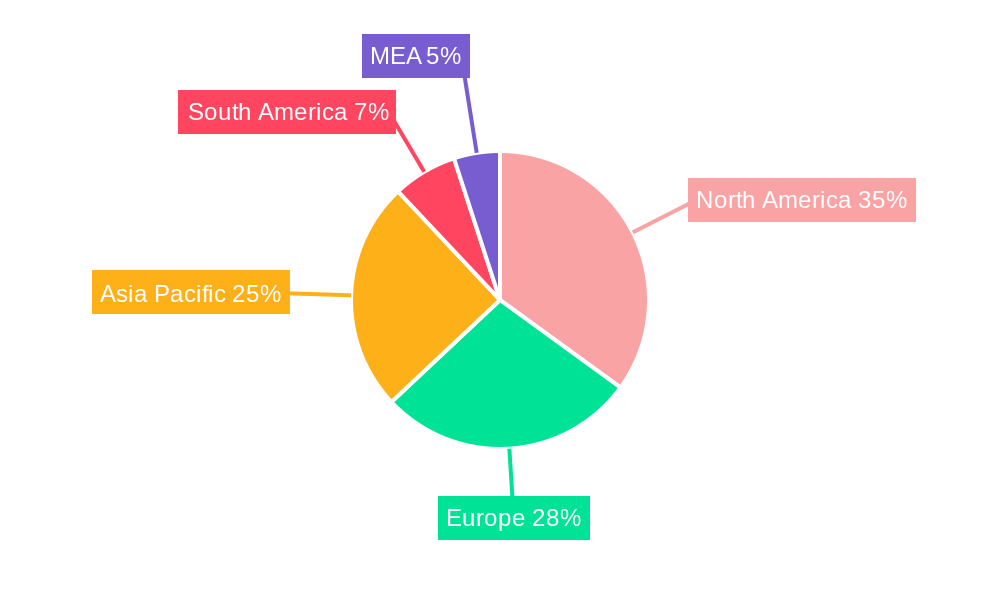
Market segmentation reveals significant opportunities across various components, including subsea trees, wellheads, manifolds, and other crucial elements. Geographically, North America and Europe currently hold substantial market share, but the Asia-Pacific region is expected to witness significant growth driven by investments in offshore energy infrastructure development in countries like China, India, and Australia. This growth will be fueled by increasing energy demand and government initiatives promoting domestic energy production. The competitive landscape includes major players like Baker Hughes, Schlumberger, and Subsea 7, who are constantly innovating and investing in research and development to maintain a competitive edge. Strategic mergers and acquisitions will likely shape market dynamics in the coming years, furthering market consolidation.
Subsea Systems Market Report: 2019-2033 Forecast
This comprehensive report provides an in-depth analysis of the Subsea Systems market, offering invaluable insights for industry professionals, investors, and strategic decision-makers. Covering the period from 2019 to 2033, with a base year of 2025, this report unveils the market's dynamics, growth drivers, challenges, and future outlook. The study incorporates detailed segmentation by type (Subsea Production Systems, Subsea Processing Systems) and component (Subsea Umbilical Riser and Flowlines (SURF), Trees, Wellhead, Manifolds, Other Components), offering granular market sizing and projections. Leading players like Dril-Quip Inc, Kerui Group Co Ltd, Baker Hughes Co, Schlumberger Ltd, Oceaneering International, Akastor ASA, Halliburton Co, Subsea 7 SA, National-Oilwell Varco Inc, and TechnipFMC PLC are profiled, highlighting their market share and strategic initiatives.
Subsea Systems Market Structure & Innovation Trends
The Subsea Systems market exhibits a moderately concentrated structure, with a few major players holding significant market share. The market share of the top five players is estimated at xx% in 2025. Innovation is driven by the need for enhanced efficiency, cost reduction, and improved safety in offshore oil and gas operations. Stringent regulatory frameworks focusing on environmental protection and operational safety significantly influence market dynamics. Product substitutes, such as onshore drilling and alternative energy sources, exert competitive pressure. The end-user demographics largely comprise major oil and gas companies and exploration and production (E&P) firms. Mergers and acquisitions (M&A) activities have been observed, with deal values fluctuating depending on market conditions. For instance, a significant M&A deal in 2022 resulted in a xx Million valuation, impacting the market consolidation.
- Market Concentration: Moderately concentrated, with top 5 players holding xx% market share (2025).
- Innovation Drivers: Enhanced efficiency, cost reduction, improved safety.
- Regulatory Frameworks: Stringent environmental and safety regulations.
- Product Substitutes: Onshore drilling, alternative energy sources.
- End-User Demographics: Major oil & gas companies, E&P firms.
- M&A Activities: Significant activity observed, with deal values varying.
Subsea Systems Market Dynamics & Trends
The Subsea Systems market is projected to witness a Compound Annual Growth Rate (CAGR) of xx% during the forecast period (2025-2033). This growth is fueled by increasing demand for offshore oil and gas exploration and production, driven by rising global energy consumption. Technological advancements, such as the adoption of automation and digitalization, are significantly impacting the market. Consumer preference is shifting toward efficient, reliable, and environmentally friendly systems. The competitive landscape is characterized by intense rivalry among established players and the emergence of new entrants. Market penetration of advanced technologies, like hydrogen-powered subsea systems, is gradually increasing. The market is expected to reach xx Million by 2033, showcasing substantial growth potential.
Dominant Regions & Segments in Subsea Systems Market
The Subsea Systems market is geographically diverse, with key regions including North America, Europe, Asia-Pacific, and the Middle East & Africa. Currently, North America holds the largest market share owing to robust offshore oil and gas activities. Within segments, Subsea Production Systems dominate the market, driven by increasing demand for enhanced oil recovery and deepwater projects. The SURF (Subsea Umbilical Riser and Flowlines) segment shows significant growth owing to its crucial role in subsea infrastructure.
Key Drivers for North America:
- Robust offshore oil and gas exploration and production activities.
- Strong technological advancements and innovations.
- Favorable regulatory environment.
Key Drivers for Subsea Production Systems:
- Rising demand for enhanced oil recovery (EOR) techniques.
- Growing investments in deepwater projects.
Key Drivers for SURF (Subsea Umbilical Riser and Flowlines):
- Increasing need for reliable and efficient subsea infrastructure.
- Expansion of deepwater projects.
Subsea Systems Market Product Innovations
Recent product innovations focus on enhancing efficiency, reliability, and safety of subsea systems. Companies are developing advanced sensors, automated control systems, and remotely operated vehicles (ROVs) for improved monitoring and maintenance. These innovations aim to improve operational efficiency, reduce downtime, and minimize environmental impact. The market fit of these technologies is driven by the industry's increasing focus on operational efficiency and cost reduction in deepwater environments.
Report Scope & Segmentation Analysis
This report provides a comprehensive analysis of the Subsea Systems market, segmented by type and component. The market is categorized into Subsea Production Systems and Subsea Processing Systems. Subsea Production Systems are projected to experience significant growth, with a CAGR of xx% from 2025 to 2033, driven by the increasing demand for deepwater oil and gas extraction projects. This growth is fueled by the ongoing need to access increasingly challenging offshore reserves to meet global energy demands. Subsea Processing Systems are also expected to exhibit robust growth, with a projected CAGR of xx% during the same period. This expansion is attributed to the rising need for efficient and cost-effective processing of hydrocarbons at the seabed, minimizing the need for extensive topside infrastructure. The report further dissects the market by key components, including Subsea Umbilicals, Risers, and Flowlines (SURF), Subsea Trees, Wellheads, Manifolds, and other crucial subsea equipment. Each component segment is analyzed in detail, providing insights into individual market dynamics, growth projections, and competitive landscapes.
Key Drivers of Subsea Systems Market Growth
The Subsea Systems market is experiencing robust growth driven by several key factors. The ever-increasing global demand for energy necessitates exploration and production from increasingly challenging deepwater and harsh environments, making sophisticated subsea systems indispensable. Technological advancements play a pivotal role, with innovations in automation, remote operations, and advanced data analytics leading to enhanced efficiency, reduced operational costs, and improved safety. Furthermore, supportive government policies and regulatory frameworks, coupled with significant investments in offshore infrastructure development, are creating a favorable environment for market expansion. The ongoing transition towards cleaner energy sources is also impacting the market, driving the development of subsea systems capable of supporting renewable energy projects.
Challenges in the Subsea Systems Market Sector
Significant challenges include the high capital expenditure required for subsea installations, operational complexities in deepwater environments, and the inherent risks associated with offshore operations. Supply chain disruptions can also impact project timelines and costs. Moreover, stringent environmental regulations and safety standards present additional challenges for companies operating in this sector.
Emerging Opportunities in Subsea Systems Market
The Subsea Systems market presents numerous emerging opportunities driven by technological innovation and evolving energy demands. The integration of renewable energy sources, such as the exploration of hydrogen technology for subsea power generation, offers substantial growth potential. The development and deployment of autonomous underwater vehicles (AUVs) and remotely operated vehicles (ROVs) for subsea inspection, maintenance, and repair (IMR) are opening up new revenue streams and improving operational efficiency. Advanced subsea monitoring and sensor technologies are enhancing predictive maintenance capabilities and reducing downtime. Furthermore, the exploration and development of new geographical areas with significant undiscovered offshore reserves, particularly in regions with less developed subsea infrastructure, provide considerable growth potential. This expansion into frontier markets presents significant opportunities for both established and emerging players in the industry.
Leading Players in the Subsea Systems Market Market
- Dril-Quip Inc
- Kerui Group Co Ltd
- Baker Hughes Co
- Schlumberger Ltd
- Oceaneering International
- Akastor ASA
- Halliburton Co
- Subsea 7 SA
- National-Oilwell Varco Inc
- TechnipFMC PLC
Key Developments in Subsea Systems Market Industry
- February 2023: Equinor's new oil and gas discovery in the North Sea highlights the ongoing demand for subsea systems in exploration activities.
- February 2022: The partnership between Norwegian Innova and Teledyne Energy System showcasing hydrogen power for subsea control systems points towards technological advancements.
- March 2022: BP PLC's win of offshore exploration blocks in Indonesia indicates expanding opportunities in the Asia-Pacific region.
Future Outlook for Subsea Systems Market Market
The Subsea Systems market is poised for continued growth, driven by the increasing demand for offshore energy resources and technological advancements. Strategic opportunities lie in developing innovative, cost-effective, and environmentally sustainable solutions. The integration of digital technologies, automation, and renewable energy sources will shape the future of the subsea systems market, paving the way for efficient and safer operations.
Subsea Systems Market Segmentation
-
1. Type
- 1.1. Subsea Production Systems
- 1.2. Subsea Processing Systems
-
2. Component
- 2.1. Subsea Umbical Riser and Flowlines (SURF)
- 2.2. Trees
- 2.3. Wellhead
- 2.4. Manifolds
- 2.5. Other Components
Subsea Systems Market Segmentation By Geography
-
1. North America
- 1.1. Canada
- 1.2. Mexico
- 1.3. United States of America
- 1.4. Rest of the North America
-
2. Europe
- 2.1. Norway
- 2.2. United Kingdom
- 2.3. France
- 2.4. Italy
-
3. Asia Pacific
- 3.1. China
- 3.2. India
- 3.3. Japan
- 3.4. Rest of the Asia Pacific
-
4. South America
- 4.1. Brazil
- 4.2. Argentina
- 4.3. Rest of the South America
-
5. Middle East and Africa
- 5.1. United Arab Emirates
- 5.2. Saudi Arabia
- 5.3. Iran
- 5.4. Iraq
- 5.5. Rest of the Middle East and Africa
Subsea Systems Market REPORT HIGHLIGHTS
| Aspects | Details |
|---|---|
| Study Period | 2019-2033 |
| Base Year | 2024 |
| Estimated Year | 2025 |
| Forecast Period | 2025-2033 |
| Historical Period | 2019-2024 |
| Growth Rate | CAGR of 5.98% from 2019-2033 |
| Segmentation |
|
Table of Contents
- 1. Introduction
- 1.1. Research Scope
- 1.2. Market Segmentation
- 1.3. Research Methodology
- 1.4. Definitions and Assumptions
- 2. Executive Summary
- 2.1. Introduction
- 3. Market Dynamics
- 3.1. Introduction
- 3.2. Market Drivers
- 3.2.1 4.; Improved Viability Of Offshore Oil And Gas Projects4.; Rising Deep Water Oil & Gas Exploration And Production Activities In The Americas
- 3.2.2 Asia-pacific
- 3.2.3 And Middle-east & Africa Region
- 3.3. Market Restrains
- 3.3.1. 4.; Ban On Offshore Exploration And Production Activities In Multiple Regions
- 3.4. Market Trends
- 3.4.1. Subsea Production Segment to Dominate the Market
- 4. Market Factor Analysis
- 4.1. Porters Five Forces
- 4.2. Supply/Value Chain
- 4.3. PESTEL analysis
- 4.4. Market Entropy
- 4.5. Patent/Trademark Analysis
- 5. Global Subsea Systems Market Analysis, Insights and Forecast, 2019-2031
- 5.1. Market Analysis, Insights and Forecast - by Type
- 5.1.1. Subsea Production Systems
- 5.1.2. Subsea Processing Systems
- 5.2. Market Analysis, Insights and Forecast - by Component
- 5.2.1. Subsea Umbical Riser and Flowlines (SURF)
- 5.2.2. Trees
- 5.2.3. Wellhead
- 5.2.4. Manifolds
- 5.2.5. Other Components
- 5.3. Market Analysis, Insights and Forecast - by Region
- 5.3.1. North America
- 5.3.2. Europe
- 5.3.3. Asia Pacific
- 5.3.4. South America
- 5.3.5. Middle East and Africa
- 5.1. Market Analysis, Insights and Forecast - by Type
- 6. North America Subsea Systems Market Analysis, Insights and Forecast, 2019-2031
- 6.1. Market Analysis, Insights and Forecast - by Type
- 6.1.1. Subsea Production Systems
- 6.1.2. Subsea Processing Systems
- 6.2. Market Analysis, Insights and Forecast - by Component
- 6.2.1. Subsea Umbical Riser and Flowlines (SURF)
- 6.2.2. Trees
- 6.2.3. Wellhead
- 6.2.4. Manifolds
- 6.2.5. Other Components
- 6.1. Market Analysis, Insights and Forecast - by Type
- 7. Europe Subsea Systems Market Analysis, Insights and Forecast, 2019-2031
- 7.1. Market Analysis, Insights and Forecast - by Type
- 7.1.1. Subsea Production Systems
- 7.1.2. Subsea Processing Systems
- 7.2. Market Analysis, Insights and Forecast - by Component
- 7.2.1. Subsea Umbical Riser and Flowlines (SURF)
- 7.2.2. Trees
- 7.2.3. Wellhead
- 7.2.4. Manifolds
- 7.2.5. Other Components
- 7.1. Market Analysis, Insights and Forecast - by Type
- 8. Asia Pacific Subsea Systems Market Analysis, Insights and Forecast, 2019-2031
- 8.1. Market Analysis, Insights and Forecast - by Type
- 8.1.1. Subsea Production Systems
- 8.1.2. Subsea Processing Systems
- 8.2. Market Analysis, Insights and Forecast - by Component
- 8.2.1. Subsea Umbical Riser and Flowlines (SURF)
- 8.2.2. Trees
- 8.2.3. Wellhead
- 8.2.4. Manifolds
- 8.2.5. Other Components
- 8.1. Market Analysis, Insights and Forecast - by Type
- 9. South America Subsea Systems Market Analysis, Insights and Forecast, 2019-2031
- 9.1. Market Analysis, Insights and Forecast - by Type
- 9.1.1. Subsea Production Systems
- 9.1.2. Subsea Processing Systems
- 9.2. Market Analysis, Insights and Forecast - by Component
- 9.2.1. Subsea Umbical Riser and Flowlines (SURF)
- 9.2.2. Trees
- 9.2.3. Wellhead
- 9.2.4. Manifolds
- 9.2.5. Other Components
- 9.1. Market Analysis, Insights and Forecast - by Type
- 10. Middle East and Africa Subsea Systems Market Analysis, Insights and Forecast, 2019-2031
- 10.1. Market Analysis, Insights and Forecast - by Type
- 10.1.1. Subsea Production Systems
- 10.1.2. Subsea Processing Systems
- 10.2. Market Analysis, Insights and Forecast - by Component
- 10.2.1. Subsea Umbical Riser and Flowlines (SURF)
- 10.2.2. Trees
- 10.2.3. Wellhead
- 10.2.4. Manifolds
- 10.2.5. Other Components
- 10.1. Market Analysis, Insights and Forecast - by Type
- 11. North America Subsea Systems Market Analysis, Insights and Forecast, 2019-2031
- 11.1. Market Analysis, Insights and Forecast - By Country/Sub-region
- 11.1.1 United States
- 11.1.2 Canada
- 11.1.3 Mexico
- 12. Europe Subsea Systems Market Analysis, Insights and Forecast, 2019-2031
- 12.1. Market Analysis, Insights and Forecast - By Country/Sub-region
- 12.1.1 Germany
- 12.1.2 United Kingdom
- 12.1.3 France
- 12.1.4 Spain
- 12.1.5 Italy
- 12.1.6 Spain
- 12.1.7 Belgium
- 12.1.8 Netherland
- 12.1.9 Nordics
- 12.1.10 Rest of Europe
- 13. Asia Pacific Subsea Systems Market Analysis, Insights and Forecast, 2019-2031
- 13.1. Market Analysis, Insights and Forecast - By Country/Sub-region
- 13.1.1 China
- 13.1.2 Japan
- 13.1.3 India
- 13.1.4 South Korea
- 13.1.5 Southeast Asia
- 13.1.6 Australia
- 13.1.7 Indonesia
- 13.1.8 Phillipes
- 13.1.9 Singapore
- 13.1.10 Thailandc
- 13.1.11 Rest of Asia Pacific
- 14. South America Subsea Systems Market Analysis, Insights and Forecast, 2019-2031
- 14.1. Market Analysis, Insights and Forecast - By Country/Sub-region
- 14.1.1 Brazil
- 14.1.2 Argentina
- 14.1.3 Peru
- 14.1.4 Chile
- 14.1.5 Colombia
- 14.1.6 Ecuador
- 14.1.7 Venezuela
- 14.1.8 Rest of South America
- 15. North America Subsea Systems Market Analysis, Insights and Forecast, 2019-2031
- 15.1. Market Analysis, Insights and Forecast - By Country/Sub-region
- 15.1.1 United States
- 15.1.2 Canada
- 15.1.3 Mexico
- 16. MEA Subsea Systems Market Analysis, Insights and Forecast, 2019-2031
- 16.1. Market Analysis, Insights and Forecast - By Country/Sub-region
- 16.1.1 United Arab Emirates
- 16.1.2 Saudi Arabia
- 16.1.3 South Africa
- 16.1.4 Rest of Middle East and Africa
- 17. Competitive Analysis
- 17.1. Global Market Share Analysis 2024
- 17.2. Company Profiles
- 17.2.1 Dril-Quip Inc *List Not Exhaustive
- 17.2.1.1. Overview
- 17.2.1.2. Products
- 17.2.1.3. SWOT Analysis
- 17.2.1.4. Recent Developments
- 17.2.1.5. Financials (Based on Availability)
- 17.2.2 Kerui Group Co Ltd
- 17.2.2.1. Overview
- 17.2.2.2. Products
- 17.2.2.3. SWOT Analysis
- 17.2.2.4. Recent Developments
- 17.2.2.5. Financials (Based on Availability)
- 17.2.3 Baker Hughes Co
- 17.2.3.1. Overview
- 17.2.3.2. Products
- 17.2.3.3. SWOT Analysis
- 17.2.3.4. Recent Developments
- 17.2.3.5. Financials (Based on Availability)
- 17.2.4 Schlumberger Ltd
- 17.2.4.1. Overview
- 17.2.4.2. Products
- 17.2.4.3. SWOT Analysis
- 17.2.4.4. Recent Developments
- 17.2.4.5. Financials (Based on Availability)
- 17.2.5 Oceaneering International
- 17.2.5.1. Overview
- 17.2.5.2. Products
- 17.2.5.3. SWOT Analysis
- 17.2.5.4. Recent Developments
- 17.2.5.5. Financials (Based on Availability)
- 17.2.6 Akastor ASA
- 17.2.6.1. Overview
- 17.2.6.2. Products
- 17.2.6.3. SWOT Analysis
- 17.2.6.4. Recent Developments
- 17.2.6.5. Financials (Based on Availability)
- 17.2.7 Halliburton Co
- 17.2.7.1. Overview
- 17.2.7.2. Products
- 17.2.7.3. SWOT Analysis
- 17.2.7.4. Recent Developments
- 17.2.7.5. Financials (Based on Availability)
- 17.2.8 Subsea 7 SA
- 17.2.8.1. Overview
- 17.2.8.2. Products
- 17.2.8.3. SWOT Analysis
- 17.2.8.4. Recent Developments
- 17.2.8.5. Financials (Based on Availability)
- 17.2.9 National-Oilwell Varco Inc
- 17.2.9.1. Overview
- 17.2.9.2. Products
- 17.2.9.3. SWOT Analysis
- 17.2.9.4. Recent Developments
- 17.2.9.5. Financials (Based on Availability)
- 17.2.10 TechnipFMC PLC
- 17.2.10.1. Overview
- 17.2.10.2. Products
- 17.2.10.3. SWOT Analysis
- 17.2.10.4. Recent Developments
- 17.2.10.5. Financials (Based on Availability)
- 17.2.1 Dril-Quip Inc *List Not Exhaustive
List of Figures
- Figure 1: Global Subsea Systems Market Revenue Breakdown (Million, %) by Region 2024 & 2032
- Figure 2: North America Subsea Systems Market Revenue (Million), by Country 2024 & 2032
- Figure 3: North America Subsea Systems Market Revenue Share (%), by Country 2024 & 2032
- Figure 4: Europe Subsea Systems Market Revenue (Million), by Country 2024 & 2032
- Figure 5: Europe Subsea Systems Market Revenue Share (%), by Country 2024 & 2032
- Figure 6: Asia Pacific Subsea Systems Market Revenue (Million), by Country 2024 & 2032
- Figure 7: Asia Pacific Subsea Systems Market Revenue Share (%), by Country 2024 & 2032
- Figure 8: South America Subsea Systems Market Revenue (Million), by Country 2024 & 2032
- Figure 9: South America Subsea Systems Market Revenue Share (%), by Country 2024 & 2032
- Figure 10: North America Subsea Systems Market Revenue (Million), by Country 2024 & 2032
- Figure 11: North America Subsea Systems Market Revenue Share (%), by Country 2024 & 2032
- Figure 12: MEA Subsea Systems Market Revenue (Million), by Country 2024 & 2032
- Figure 13: MEA Subsea Systems Market Revenue Share (%), by Country 2024 & 2032
- Figure 14: North America Subsea Systems Market Revenue (Million), by Type 2024 & 2032
- Figure 15: North America Subsea Systems Market Revenue Share (%), by Type 2024 & 2032
- Figure 16: North America Subsea Systems Market Revenue (Million), by Component 2024 & 2032
- Figure 17: North America Subsea Systems Market Revenue Share (%), by Component 2024 & 2032
- Figure 18: North America Subsea Systems Market Revenue (Million), by Country 2024 & 2032
- Figure 19: North America Subsea Systems Market Revenue Share (%), by Country 2024 & 2032
- Figure 20: Europe Subsea Systems Market Revenue (Million), by Type 2024 & 2032
- Figure 21: Europe Subsea Systems Market Revenue Share (%), by Type 2024 & 2032
- Figure 22: Europe Subsea Systems Market Revenue (Million), by Component 2024 & 2032
- Figure 23: Europe Subsea Systems Market Revenue Share (%), by Component 2024 & 2032
- Figure 24: Europe Subsea Systems Market Revenue (Million), by Country 2024 & 2032
- Figure 25: Europe Subsea Systems Market Revenue Share (%), by Country 2024 & 2032
- Figure 26: Asia Pacific Subsea Systems Market Revenue (Million), by Type 2024 & 2032
- Figure 27: Asia Pacific Subsea Systems Market Revenue Share (%), by Type 2024 & 2032
- Figure 28: Asia Pacific Subsea Systems Market Revenue (Million), by Component 2024 & 2032
- Figure 29: Asia Pacific Subsea Systems Market Revenue Share (%), by Component 2024 & 2032
- Figure 30: Asia Pacific Subsea Systems Market Revenue (Million), by Country 2024 & 2032
- Figure 31: Asia Pacific Subsea Systems Market Revenue Share (%), by Country 2024 & 2032
- Figure 32: South America Subsea Systems Market Revenue (Million), by Type 2024 & 2032
- Figure 33: South America Subsea Systems Market Revenue Share (%), by Type 2024 & 2032
- Figure 34: South America Subsea Systems Market Revenue (Million), by Component 2024 & 2032
- Figure 35: South America Subsea Systems Market Revenue Share (%), by Component 2024 & 2032
- Figure 36: South America Subsea Systems Market Revenue (Million), by Country 2024 & 2032
- Figure 37: South America Subsea Systems Market Revenue Share (%), by Country 2024 & 2032
- Figure 38: Middle East and Africa Subsea Systems Market Revenue (Million), by Type 2024 & 2032
- Figure 39: Middle East and Africa Subsea Systems Market Revenue Share (%), by Type 2024 & 2032
- Figure 40: Middle East and Africa Subsea Systems Market Revenue (Million), by Component 2024 & 2032
- Figure 41: Middle East and Africa Subsea Systems Market Revenue Share (%), by Component 2024 & 2032
- Figure 42: Middle East and Africa Subsea Systems Market Revenue (Million), by Country 2024 & 2032
- Figure 43: Middle East and Africa Subsea Systems Market Revenue Share (%), by Country 2024 & 2032
List of Tables
- Table 1: Global Subsea Systems Market Revenue Million Forecast, by Region 2019 & 2032
- Table 2: Global Subsea Systems Market Revenue Million Forecast, by Type 2019 & 2032
- Table 3: Global Subsea Systems Market Revenue Million Forecast, by Component 2019 & 2032
- Table 4: Global Subsea Systems Market Revenue Million Forecast, by Region 2019 & 2032
- Table 5: Global Subsea Systems Market Revenue Million Forecast, by Country 2019 & 2032
- Table 6: United States Subsea Systems Market Revenue (Million) Forecast, by Application 2019 & 2032
- Table 7: Canada Subsea Systems Market Revenue (Million) Forecast, by Application 2019 & 2032
- Table 8: Mexico Subsea Systems Market Revenue (Million) Forecast, by Application 2019 & 2032
- Table 9: Global Subsea Systems Market Revenue Million Forecast, by Country 2019 & 2032
- Table 10: Germany Subsea Systems Market Revenue (Million) Forecast, by Application 2019 & 2032
- Table 11: United Kingdom Subsea Systems Market Revenue (Million) Forecast, by Application 2019 & 2032
- Table 12: France Subsea Systems Market Revenue (Million) Forecast, by Application 2019 & 2032
- Table 13: Spain Subsea Systems Market Revenue (Million) Forecast, by Application 2019 & 2032
- Table 14: Italy Subsea Systems Market Revenue (Million) Forecast, by Application 2019 & 2032
- Table 15: Spain Subsea Systems Market Revenue (Million) Forecast, by Application 2019 & 2032
- Table 16: Belgium Subsea Systems Market Revenue (Million) Forecast, by Application 2019 & 2032
- Table 17: Netherland Subsea Systems Market Revenue (Million) Forecast, by Application 2019 & 2032
- Table 18: Nordics Subsea Systems Market Revenue (Million) Forecast, by Application 2019 & 2032
- Table 19: Rest of Europe Subsea Systems Market Revenue (Million) Forecast, by Application 2019 & 2032
- Table 20: Global Subsea Systems Market Revenue Million Forecast, by Country 2019 & 2032
- Table 21: China Subsea Systems Market Revenue (Million) Forecast, by Application 2019 & 2032
- Table 22: Japan Subsea Systems Market Revenue (Million) Forecast, by Application 2019 & 2032
- Table 23: India Subsea Systems Market Revenue (Million) Forecast, by Application 2019 & 2032
- Table 24: South Korea Subsea Systems Market Revenue (Million) Forecast, by Application 2019 & 2032
- Table 25: Southeast Asia Subsea Systems Market Revenue (Million) Forecast, by Application 2019 & 2032
- Table 26: Australia Subsea Systems Market Revenue (Million) Forecast, by Application 2019 & 2032
- Table 27: Indonesia Subsea Systems Market Revenue (Million) Forecast, by Application 2019 & 2032
- Table 28: Phillipes Subsea Systems Market Revenue (Million) Forecast, by Application 2019 & 2032
- Table 29: Singapore Subsea Systems Market Revenue (Million) Forecast, by Application 2019 & 2032
- Table 30: Thailandc Subsea Systems Market Revenue (Million) Forecast, by Application 2019 & 2032
- Table 31: Rest of Asia Pacific Subsea Systems Market Revenue (Million) Forecast, by Application 2019 & 2032
- Table 32: Global Subsea Systems Market Revenue Million Forecast, by Country 2019 & 2032
- Table 33: Brazil Subsea Systems Market Revenue (Million) Forecast, by Application 2019 & 2032
- Table 34: Argentina Subsea Systems Market Revenue (Million) Forecast, by Application 2019 & 2032
- Table 35: Peru Subsea Systems Market Revenue (Million) Forecast, by Application 2019 & 2032
- Table 36: Chile Subsea Systems Market Revenue (Million) Forecast, by Application 2019 & 2032
- Table 37: Colombia Subsea Systems Market Revenue (Million) Forecast, by Application 2019 & 2032
- Table 38: Ecuador Subsea Systems Market Revenue (Million) Forecast, by Application 2019 & 2032
- Table 39: Venezuela Subsea Systems Market Revenue (Million) Forecast, by Application 2019 & 2032
- Table 40: Rest of South America Subsea Systems Market Revenue (Million) Forecast, by Application 2019 & 2032
- Table 41: Global Subsea Systems Market Revenue Million Forecast, by Country 2019 & 2032
- Table 42: United States Subsea Systems Market Revenue (Million) Forecast, by Application 2019 & 2032
- Table 43: Canada Subsea Systems Market Revenue (Million) Forecast, by Application 2019 & 2032
- Table 44: Mexico Subsea Systems Market Revenue (Million) Forecast, by Application 2019 & 2032
- Table 45: Global Subsea Systems Market Revenue Million Forecast, by Country 2019 & 2032
- Table 46: United Arab Emirates Subsea Systems Market Revenue (Million) Forecast, by Application 2019 & 2032
- Table 47: Saudi Arabia Subsea Systems Market Revenue (Million) Forecast, by Application 2019 & 2032
- Table 48: South Africa Subsea Systems Market Revenue (Million) Forecast, by Application 2019 & 2032
- Table 49: Rest of Middle East and Africa Subsea Systems Market Revenue (Million) Forecast, by Application 2019 & 2032
- Table 50: Global Subsea Systems Market Revenue Million Forecast, by Type 2019 & 2032
- Table 51: Global Subsea Systems Market Revenue Million Forecast, by Component 2019 & 2032
- Table 52: Global Subsea Systems Market Revenue Million Forecast, by Country 2019 & 2032
- Table 53: Canada Subsea Systems Market Revenue (Million) Forecast, by Application 2019 & 2032
- Table 54: Mexico Subsea Systems Market Revenue (Million) Forecast, by Application 2019 & 2032
- Table 55: United States of America Subsea Systems Market Revenue (Million) Forecast, by Application 2019 & 2032
- Table 56: Rest of the North America Subsea Systems Market Revenue (Million) Forecast, by Application 2019 & 2032
- Table 57: Global Subsea Systems Market Revenue Million Forecast, by Type 2019 & 2032
- Table 58: Global Subsea Systems Market Revenue Million Forecast, by Component 2019 & 2032
- Table 59: Global Subsea Systems Market Revenue Million Forecast, by Country 2019 & 2032
- Table 60: Norway Subsea Systems Market Revenue (Million) Forecast, by Application 2019 & 2032
- Table 61: United Kingdom Subsea Systems Market Revenue (Million) Forecast, by Application 2019 & 2032
- Table 62: France Subsea Systems Market Revenue (Million) Forecast, by Application 2019 & 2032
- Table 63: Italy Subsea Systems Market Revenue (Million) Forecast, by Application 2019 & 2032
- Table 64: Global Subsea Systems Market Revenue Million Forecast, by Type 2019 & 2032
- Table 65: Global Subsea Systems Market Revenue Million Forecast, by Component 2019 & 2032
- Table 66: Global Subsea Systems Market Revenue Million Forecast, by Country 2019 & 2032
- Table 67: China Subsea Systems Market Revenue (Million) Forecast, by Application 2019 & 2032
- Table 68: India Subsea Systems Market Revenue (Million) Forecast, by Application 2019 & 2032
- Table 69: Japan Subsea Systems Market Revenue (Million) Forecast, by Application 2019 & 2032
- Table 70: Rest of the Asia Pacific Subsea Systems Market Revenue (Million) Forecast, by Application 2019 & 2032
- Table 71: Global Subsea Systems Market Revenue Million Forecast, by Type 2019 & 2032
- Table 72: Global Subsea Systems Market Revenue Million Forecast, by Component 2019 & 2032
- Table 73: Global Subsea Systems Market Revenue Million Forecast, by Country 2019 & 2032
- Table 74: Brazil Subsea Systems Market Revenue (Million) Forecast, by Application 2019 & 2032
- Table 75: Argentina Subsea Systems Market Revenue (Million) Forecast, by Application 2019 & 2032
- Table 76: Rest of the South America Subsea Systems Market Revenue (Million) Forecast, by Application 2019 & 2032
- Table 77: Global Subsea Systems Market Revenue Million Forecast, by Type 2019 & 2032
- Table 78: Global Subsea Systems Market Revenue Million Forecast, by Component 2019 & 2032
- Table 79: Global Subsea Systems Market Revenue Million Forecast, by Country 2019 & 2032
- Table 80: United Arab Emirates Subsea Systems Market Revenue (Million) Forecast, by Application 2019 & 2032
- Table 81: Saudi Arabia Subsea Systems Market Revenue (Million) Forecast, by Application 2019 & 2032
- Table 82: Iran Subsea Systems Market Revenue (Million) Forecast, by Application 2019 & 2032
- Table 83: Iraq Subsea Systems Market Revenue (Million) Forecast, by Application 2019 & 2032
- Table 84: Rest of the Middle East and Africa Subsea Systems Market Revenue (Million) Forecast, by Application 2019 & 2032
Frequently Asked Questions
1. What is the projected Compound Annual Growth Rate (CAGR) of the Subsea Systems Market?
The projected CAGR is approximately 5.98%.
2. Which companies are prominent players in the Subsea Systems Market?
Key companies in the market include Dril-Quip Inc *List Not Exhaustive, Kerui Group Co Ltd, Baker Hughes Co, Schlumberger Ltd, Oceaneering International, Akastor ASA, Halliburton Co, Subsea 7 SA, National-Oilwell Varco Inc, TechnipFMC PLC.
3. What are the main segments of the Subsea Systems Market?
The market segments include Type, Component.
4. Can you provide details about the market size?
The market size is estimated to be USD 19.85 Million as of 2022.
5. What are some drivers contributing to market growth?
4.; Improved Viability Of Offshore Oil And Gas Projects4.; Rising Deep Water Oil & Gas Exploration And Production Activities In The Americas. Asia-pacific. And Middle-east & Africa Region.
6. What are the notable trends driving market growth?
Subsea Production Segment to Dominate the Market.
7. Are there any restraints impacting market growth?
4.; Ban On Offshore Exploration And Production Activities In Multiple Regions.
8. Can you provide examples of recent developments in the market?
February 2023: Equinor made a new commercial oil and gas discovery in the North Sea off Norway using a Transocean-owned rig. The discovery was made after the conclusion of drilling a wildcat well (31/1-3 S) and an appraisal well (31/1-3 A) in production license 923.
9. What pricing options are available for accessing the report?
Pricing options include single-user, multi-user, and enterprise licenses priced at USD 4750, USD 5250, and USD 8750 respectively.
10. Is the market size provided in terms of value or volume?
The market size is provided in terms of value, measured in Million.
11. Are there any specific market keywords associated with the report?
Yes, the market keyword associated with the report is "Subsea Systems Market," which aids in identifying and referencing the specific market segment covered.
12. How do I determine which pricing option suits my needs best?
The pricing options vary based on user requirements and access needs. Individual users may opt for single-user licenses, while businesses requiring broader access may choose multi-user or enterprise licenses for cost-effective access to the report.
13. Are there any additional resources or data provided in the Subsea Systems Market report?
While the report offers comprehensive insights, it's advisable to review the specific contents or supplementary materials provided to ascertain if additional resources or data are available.
14. How can I stay updated on further developments or reports in the Subsea Systems Market?
To stay informed about further developments, trends, and reports in the Subsea Systems Market, consider subscribing to industry newsletters, following relevant companies and organizations, or regularly checking reputable industry news sources and publications.
Methodology
Step 1 - Identification of Relevant Samples Size from Population Database


Step 2 - Approaches for Defining Global Market Size (Value, Volume* & Price*)

Note*: In applicable scenarios
Step 3 - Data Sources
Primary Research
- Web Analytics
- Survey Reports
- Research Institute
- Latest Research Reports
- Opinion Leaders
Secondary Research
- Annual Reports
- White Paper
- Latest Press Release
- Industry Association
- Paid Database
- Investor Presentations

Step 4 - Data Triangulation
Involves using different sources of information in order to increase the validity of a study
These sources are likely to be stakeholders in a program - participants, other researchers, program staff, other community members, and so on.
Then we put all data in single framework & apply various statistical tools to find out the dynamic on the market.
During the analysis stage, feedback from the stakeholder groups would be compared to determine areas of agreement as well as areas of divergence


