
Key Insights
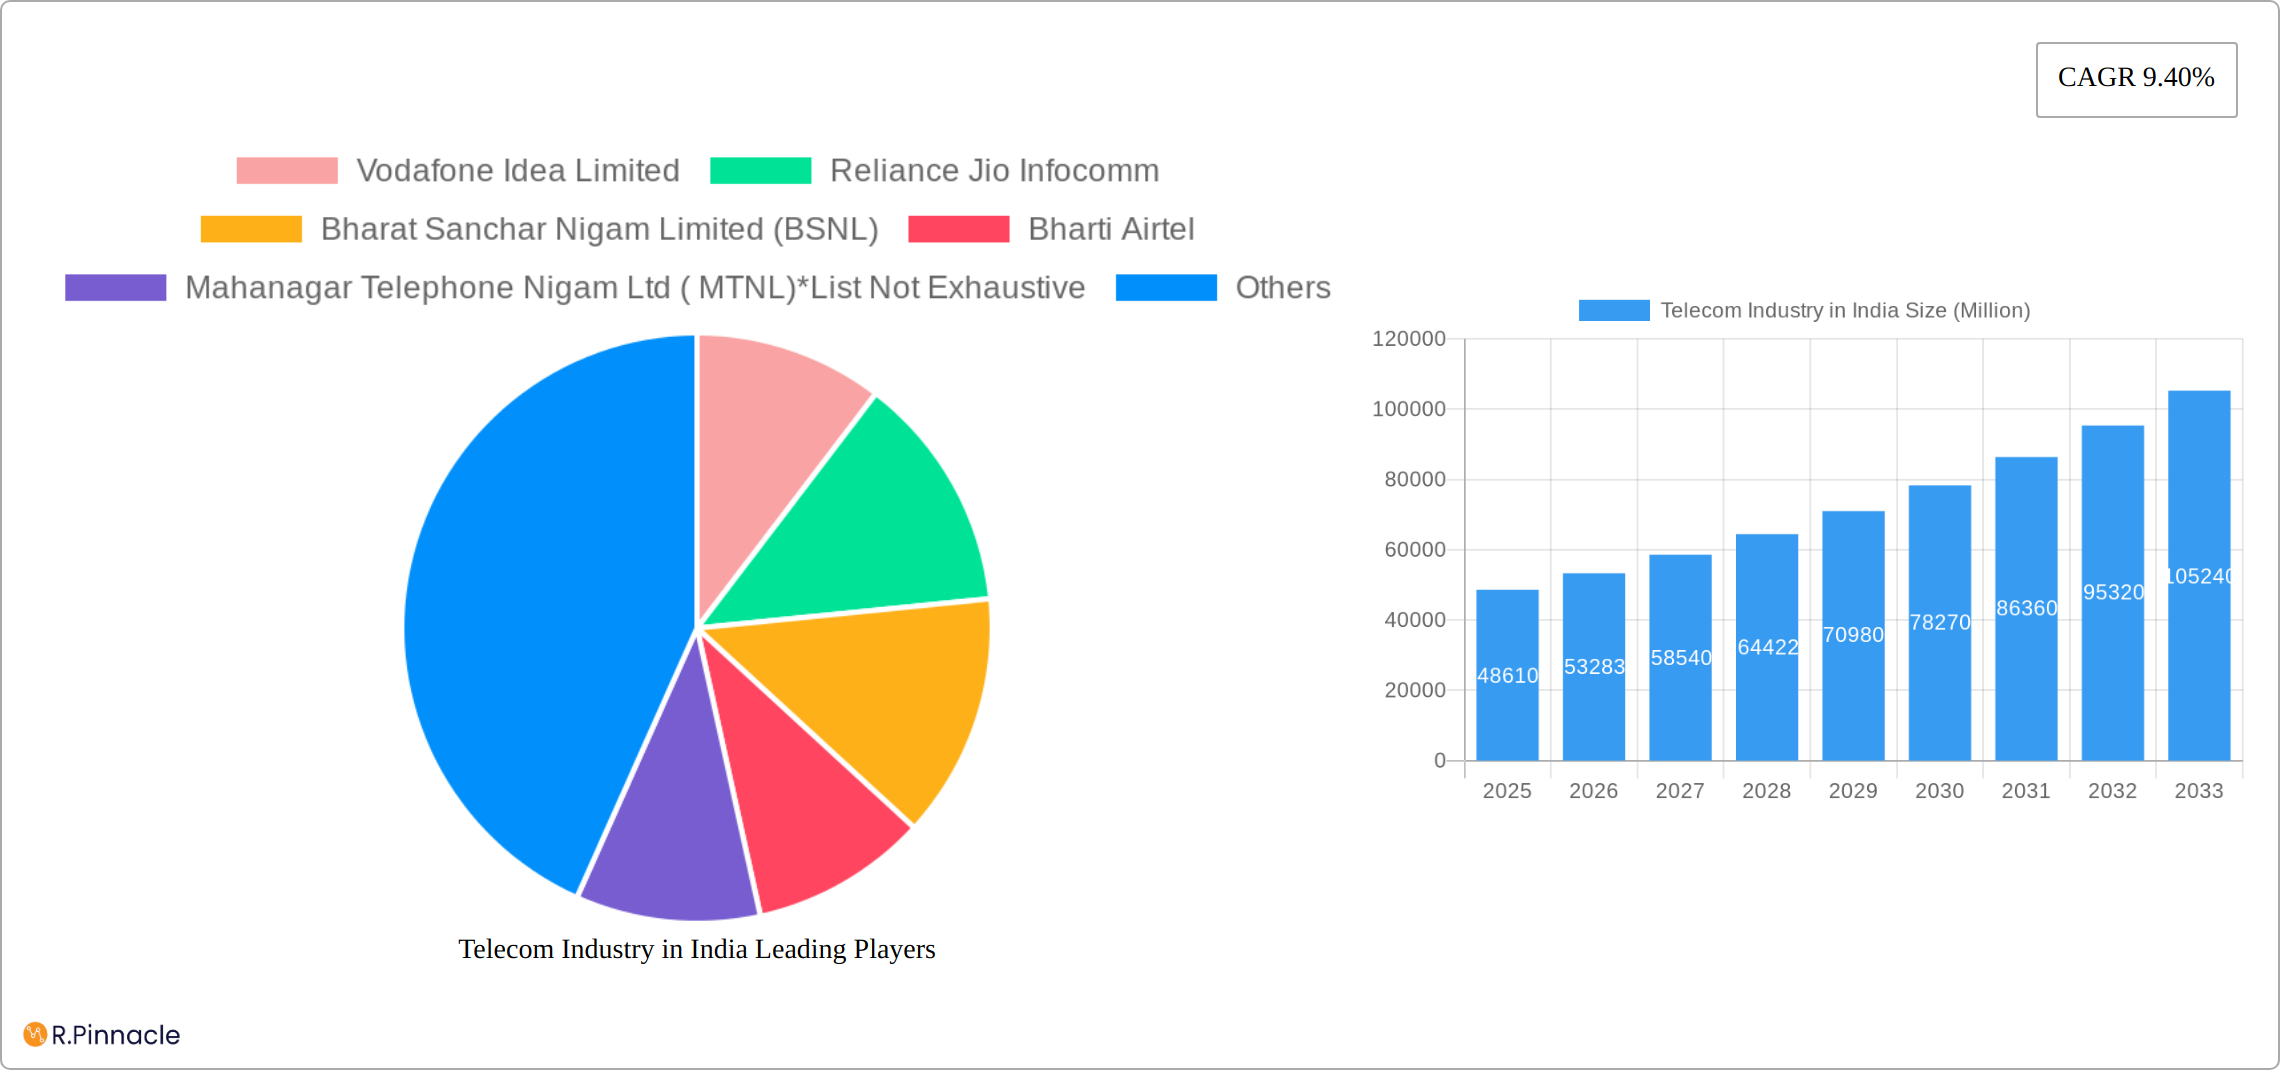
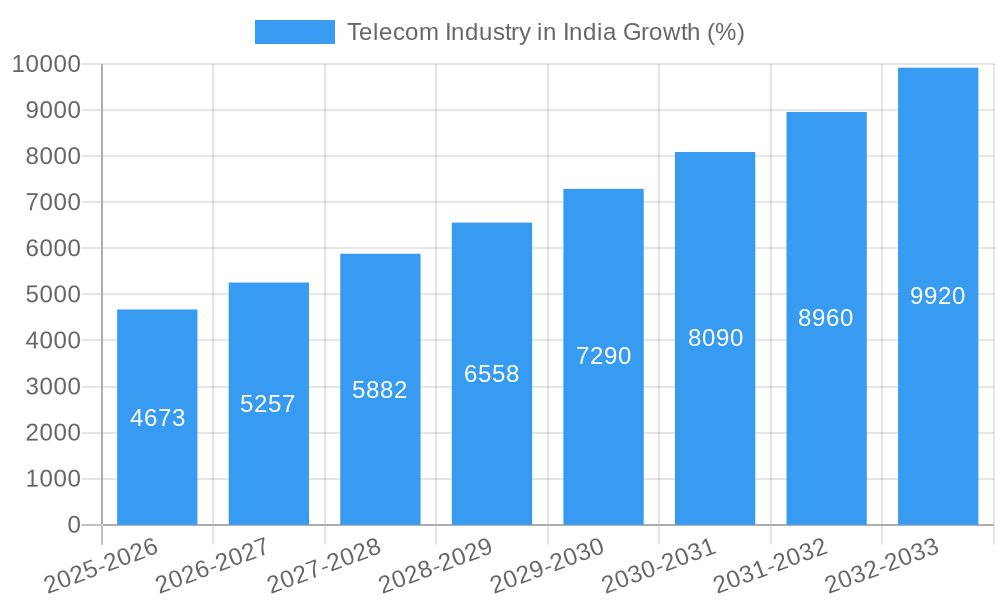
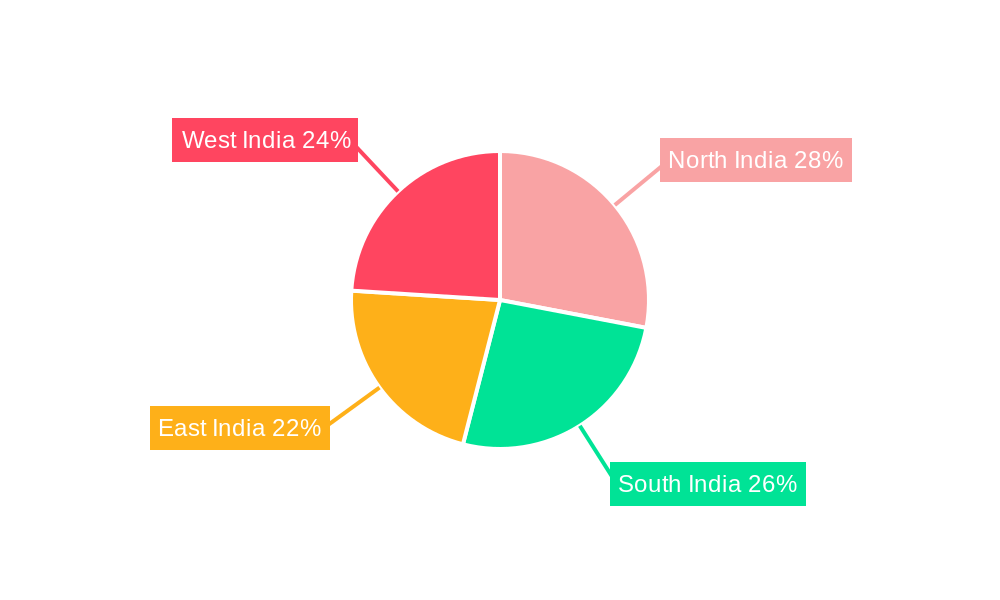
The Indian telecom industry, valued at $48.61 billion in 2025, exhibits robust growth potential, projected to expand at a compound annual growth rate (CAGR) of 9.40% from 2025 to 2033. This expansion is fueled by increasing smartphone penetration, rising data consumption driven by the proliferation of OTT platforms and video streaming services, and the government's initiatives to enhance digital infrastructure. The market is segmented by service type, including voice, wireless data and messaging (including internet and handset data packages), and OTT/pay-TV services. Competitive pressures are high, with major players like Reliance Jio Infocomm, Bharti Airtel, Vodafone Idea Limited, BSNL, and MTNL vying for market share through aggressive pricing strategies and innovative service offerings. The regional distribution shows varying levels of penetration across North, South, East, and West India, influenced by factors such as infrastructure development, digital literacy, and economic conditions. Growth in the data segment is particularly noteworthy, with ARPU (Average Revenue Per User) likely to see a gradual increase despite competitive pressures. This segment is expected to remain a key driver of overall market growth throughout the forecast period.
The industry faces challenges including regulatory hurdles, the need for consistent infrastructure investments across all regions, and managing the increasing demands for high-speed data. While consolidation among players is a possibility, the market is expected to remain highly competitive. The burgeoning digital economy within India, supported by government initiatives like Digital India, will significantly contribute to the continued expansion of the telecom sector. The demand for affordable and high-quality internet access, especially in rural areas, presents a significant opportunity for growth. Future developments will likely see an increased focus on 5G technology deployment, enhanced network security, and the integration of IoT devices within the ecosystem.
Telecom Industry in India: A Comprehensive Market Report (2019-2033)
This in-depth report provides a comprehensive analysis of the Indian telecom industry, covering market structure, dynamics, key players, and future outlook. With a study period spanning 2019-2033, a base year of 2025, and a forecast period of 2025-2033, this report is an invaluable resource for industry professionals, investors, and strategists. We analyze key segments, including Voice Services, Wireless Data & Messaging, OTT, and Pay-TV, providing detailed market size estimates (in Millions) and trend analysis from 2020-2027.
Telecom Industry in India Market Structure & Innovation Trends
The Indian telecom market is a dynamic landscape characterized by intense competition among major service providers, including Bharti Airtel, Reliance Jio Infocomm, Vodafone Idea Limited, Bharat Sanchar Nigam Limited (BSNL), and Mahanagar Telephone Nigam Ltd (MTNL), among others. The market exhibits high concentration, with the leading three players collectively commanding a substantial market share, estimated at approximately xx% in 2024. Innovation is a critical differentiator, spurred by the ever-increasing demand for data, ambitious government initiatives like Digital India aimed at fostering widespread digitalization, and the rapid adoption of cutting-edge 5G technology. The regulatory environment, though continuously evolving, plays a pivotal role in shaping market dynamics and competitive strategies. Product substitution is largely influenced by the proliferation of Over-The-Top (OTT) services and Voice over Internet Protocol (VoIP) applications, offering consumers a wider array of communication and content consumption options. Mergers and Acquisitions (M&A) have been a significant trend, with aggregate deal values exceeding xx Million in recent years, primarily driven by strategic spectrum acquisitions and aggressive network expansion efforts. The end-user demographic is exceptionally diverse, with a considerable segment of the population, particularly in rural and semi-urban areas, still seeking enhanced connectivity and digital services.
- Market Share (2024): Top 3 players – xx%
- M&A Deal Value (2019-2024): > xx Million
- Key Innovation Drivers: Accelerated 5G rollout, the transformative Digital India initiative, and sustained growth in data consumption.
Telecom Industry in India Market Dynamics & Trends
The Indian telecom market exhibits robust growth, driven by increasing smartphone penetration, rising internet usage, and government initiatives promoting digital inclusion. The Compound Annual Growth Rate (CAGR) for the overall telecom services market during 2019-2024 was approximately xx%, and is projected to be xx% for the forecast period. Technological disruptions, such as the introduction of 5G and the expansion of fiber optic networks, are transforming the industry landscape. Consumer preferences are shifting towards higher data packages, OTT services, and affordable handset options. Competitive dynamics are shaped by pricing wars, network expansion strategies, and the constant pursuit of enhancing customer experience. Market penetration of mobile services is high, exceeding xx%, while broadband penetration continues to grow steadily.
Dominant Regions & Segments in Telecom Industry in India
Urban areas and major metropolitan centers dominate the Indian telecom market, exhibiting higher ARPU and data consumption. However, rural areas are showing substantial growth potential driven by government initiatives aimed at bridging the digital divide.
- Voice Services: Market size is expected to reach xx Million by 2027, though showing a decline in ARPU due to competition.
- Wireless Data & Messaging: This segment is the fastest growing, fueled by affordable data packages and increasing smartphone adoption, expected to reach a market size of xx Million by 2027. ARPU is moderate.
- OTT & Pay-TV Services: This segment is experiencing exponential growth, driven by increasing internet penetration and consumer preference for streaming content, expected to reach xx Million by 2027. ARPU is relatively high.
Key drivers include government policies promoting infrastructure development, increasing disposable income, and favourable demographics.
Telecom Industry in India Product Innovations
The Indian telecom market is witnessing rapid product innovation. Key trends include the rollout of 5G networks, the introduction of innovative data packages (e.g., unlimited data plans with speed caps), bundled services combining mobile, broadband, and OTT offerings, and the emergence of new applications leveraging IoT and AI. These innovations are aimed at catering to the diverse needs of consumers, enhancing customer experience, and creating new revenue streams. Competition drives the development of value-added services and customized packages.
Report Scope & Segmentation Analysis
This report segments the Indian telecom market by service type:
- Voice Services: Growth is slowing due to competition from OTT communication platforms.
- Wireless Data & Messaging: This segment demonstrates the fastest growth, driven by increasing data consumption and affordable packages.
- OTT & Pay-tv Services: This segment shows strong growth potential, fueled by rising internet penetration and changing consumer preferences.
Each segment’s market size, growth projections, and competitive dynamics are detailed within the full report.
Key Drivers of Telecom Industry in India Growth
The robust growth of the Indian telecom industry is propelled by a synergistic combination of factors. Proactive government initiatives, most notably the Digital India campaign, are instrumental in driving digital inclusion across the nation. Escalating smartphone penetration continues to expand the addressable user base, while India's favorable demographics, characterized by a large, young, and increasingly tech-savvy population, provide a fertile ground for adoption. The burgeoning demand for data-intensive services, coupled with the strategic rollout and widespread availability of advanced technologies like 5G, are powerful catalysts further accelerating this growth trajectory.
Challenges in the Telecom Industry in India Sector
Challenges faced by the Indian telecom industry include intense price competition, regulatory hurdles (e.g., spectrum allocation), infrastructure limitations, particularly in rural areas, and debt burdens for some operators. These factors impact profitability and constrain investments in network expansion and technological upgrades.
Emerging Opportunities in Telecom Industry in India
The Indian telecom sector is ripe with emerging opportunities. These include the expansive rollout and subsequent densification of 5G networks, unlocking new possibilities for data-intensive applications. The Internet of Things (IoT) ecosystem is poised for significant growth, creating demand for robust connectivity solutions. There remains substantial potential for deeper rural market penetration, bridging the digital divide. Furthermore, the development of innovative, tailored services catering to specific consumer and enterprise segments, such as bespoke enterprise solutions and specialized data packages, presents lucrative avenues for expansion and differentiation.
Leading Players in the Telecom Industry in India Market
- Bharti Airtel
- Reliance Jio Infocomm
- Vodafone Idea Limited
- Bharat Sanchar Nigam Limited (BSNL)
- Mahanagar Telephone Nigam Ltd (MTNL)
- List Not Exhaustive
Key Developments in Telecom Industry in India Industry
- October 2022: Vi (Vodafone Idea Limited) strategically enhanced its 4G network capacity in key regions like Andhra Pradesh and Telangana, leading to improved network speeds and the launch of impactful promotional campaigns to attract and retain subscribers.
- February 2022: Jio Platforms Limited, in a landmark move, partnered with SES to establish Jio Space Technology Limited. This joint venture aims to revolutionize broadband accessibility by delivering satellite-based internet services, particularly targeting underserved areas.
Future Outlook for Telecom Industry in India Market
The future trajectory of the Indian telecom industry appears exceptionally promising. Sustained and significant growth is anticipated, driven by the continued expansion of 5G coverage, the deepening of digital adoption across all strata of society, and the continuous emergence of novel technologies and service offerings. Success in this highly competitive and dynamic market will undoubtedly hinge on strategic partnerships, relentless technological advancements, and an unwavering focus on delivering superior customer experiences and value.
Telecom Industry in India Segmentation
-
1. Segmenta
-
1.1. Voice Services
- 1.1.1. Wired
- 1.1.2. Wireless
- 1.2. Data and
- 1.3. OTT and Pay-tv Services
-
1.1. Voice Services
Telecom Industry in India Segmentation By Geography
-
1. North America
- 1.1. United States
- 1.2. Canada
- 1.3. Mexico
-
2. South America
- 2.1. Brazil
- 2.2. Argentina
- 2.3. Rest of South America
-
3. Europe
- 3.1. United Kingdom
- 3.2. Germany
- 3.3. France
- 3.4. Italy
- 3.5. Spain
- 3.6. Russia
- 3.7. Benelux
- 3.8. Nordics
- 3.9. Rest of Europe
-
4. Middle East & Africa
- 4.1. Turkey
- 4.2. Israel
- 4.3. GCC
- 4.4. North Africa
- 4.5. South Africa
- 4.6. Rest of Middle East & Africa
-
5. Asia Pacific
- 5.1. China
- 5.2. India
- 5.3. Japan
- 5.4. South Korea
- 5.5. ASEAN
- 5.6. Oceania
- 5.7. Rest of Asia Pacific
Telecom Industry in India REPORT HIGHLIGHTS
| Aspects | Details |
|---|---|
| Study Period | 2019-2033 |
| Base Year | 2024 |
| Estimated Year | 2025 |
| Forecast Period | 2025-2033 |
| Historical Period | 2019-2024 |
| Growth Rate | CAGR of 9.40% from 2019-2033 |
| Segmentation |
|
Table of Contents
- 1. Introduction
- 1.1. Research Scope
- 1.2. Market Segmentation
- 1.3. Research Methodology
- 1.4. Definitions and Assumptions
- 2. Executive Summary
- 2.1. Introduction
- 3. Market Dynamics
- 3.1. Introduction
- 3.2. Market Drivers
- 3.2.1. Increasing Penetration of 4G and Upgradation of 5G; Foreign Direct Investment (FDI)
- 3.3. Market Restrains
- 3.3.1. High Initial Cost and Lower Awareness
- 3.4. Market Trends
- 3.4.1. Increasing Penetration of 4G and Upgradation of 5G
- 4. Market Factor Analysis
- 4.1. Porters Five Forces
- 4.2. Supply/Value Chain
- 4.3. PESTEL analysis
- 4.4. Market Entropy
- 4.5. Patent/Trademark Analysis
- 5. Global Telecom Industry in India Analysis, Insights and Forecast, 2019-2031
- 5.1. Market Analysis, Insights and Forecast - by Segmenta
- 5.1.1. Voice Services
- 5.1.1.1. Wired
- 5.1.1.2. Wireless
- 5.1.2. Data and
- 5.1.3. OTT and Pay-tv Services
- 5.1.1. Voice Services
- 5.2. Market Analysis, Insights and Forecast - by Region
- 5.2.1. North America
- 5.2.2. South America
- 5.2.3. Europe
- 5.2.4. Middle East & Africa
- 5.2.5. Asia Pacific
- 5.1. Market Analysis, Insights and Forecast - by Segmenta
- 6. North America Telecom Industry in India Analysis, Insights and Forecast, 2019-2031
- 6.1. Market Analysis, Insights and Forecast - by Segmenta
- 6.1.1. Voice Services
- 6.1.1.1. Wired
- 6.1.1.2. Wireless
- 6.1.2. Data and
- 6.1.3. OTT and Pay-tv Services
- 6.1.1. Voice Services
- 6.1. Market Analysis, Insights and Forecast - by Segmenta
- 7. South America Telecom Industry in India Analysis, Insights and Forecast, 2019-2031
- 7.1. Market Analysis, Insights and Forecast - by Segmenta
- 7.1.1. Voice Services
- 7.1.1.1. Wired
- 7.1.1.2. Wireless
- 7.1.2. Data and
- 7.1.3. OTT and Pay-tv Services
- 7.1.1. Voice Services
- 7.1. Market Analysis, Insights and Forecast - by Segmenta
- 8. Europe Telecom Industry in India Analysis, Insights and Forecast, 2019-2031
- 8.1. Market Analysis, Insights and Forecast - by Segmenta
- 8.1.1. Voice Services
- 8.1.1.1. Wired
- 8.1.1.2. Wireless
- 8.1.2. Data and
- 8.1.3. OTT and Pay-tv Services
- 8.1.1. Voice Services
- 8.1. Market Analysis, Insights and Forecast - by Segmenta
- 9. Middle East & Africa Telecom Industry in India Analysis, Insights and Forecast, 2019-2031
- 9.1. Market Analysis, Insights and Forecast - by Segmenta
- 9.1.1. Voice Services
- 9.1.1.1. Wired
- 9.1.1.2. Wireless
- 9.1.2. Data and
- 9.1.3. OTT and Pay-tv Services
- 9.1.1. Voice Services
- 9.1. Market Analysis, Insights and Forecast - by Segmenta
- 10. Asia Pacific Telecom Industry in India Analysis, Insights and Forecast, 2019-2031
- 10.1. Market Analysis, Insights and Forecast - by Segmenta
- 10.1.1. Voice Services
- 10.1.1.1. Wired
- 10.1.1.2. Wireless
- 10.1.2. Data and
- 10.1.3. OTT and Pay-tv Services
- 10.1.1. Voice Services
- 10.1. Market Analysis, Insights and Forecast - by Segmenta
- 11. North India Telecom Industry in India Analysis, Insights and Forecast, 2019-2031
- 12. South India Telecom Industry in India Analysis, Insights and Forecast, 2019-2031
- 13. East India Telecom Industry in India Analysis, Insights and Forecast, 2019-2031
- 14. West India Telecom Industry in India Analysis, Insights and Forecast, 2019-2031
- 15. Competitive Analysis
- 15.1. Global Market Share Analysis 2024
- 15.2. Company Profiles
- 15.2.1 Vodafone Idea Limited
- 15.2.1.1. Overview
- 15.2.1.2. Products
- 15.2.1.3. SWOT Analysis
- 15.2.1.4. Recent Developments
- 15.2.1.5. Financials (Based on Availability)
- 15.2.2 Reliance Jio Infocomm
- 15.2.2.1. Overview
- 15.2.2.2. Products
- 15.2.2.3. SWOT Analysis
- 15.2.2.4. Recent Developments
- 15.2.2.5. Financials (Based on Availability)
- 15.2.3 Bharat Sanchar Nigam Limited (BSNL)
- 15.2.3.1. Overview
- 15.2.3.2. Products
- 15.2.3.3. SWOT Analysis
- 15.2.3.4. Recent Developments
- 15.2.3.5. Financials (Based on Availability)
- 15.2.4 Bharti Airtel
- 15.2.4.1. Overview
- 15.2.4.2. Products
- 15.2.4.3. SWOT Analysis
- 15.2.4.4. Recent Developments
- 15.2.4.5. Financials (Based on Availability)
- 15.2.5 Mahanagar Telephone Nigam Ltd ( MTNL)*List Not Exhaustive
- 15.2.5.1. Overview
- 15.2.5.2. Products
- 15.2.5.3. SWOT Analysis
- 15.2.5.4. Recent Developments
- 15.2.5.5. Financials (Based on Availability)
- 15.2.1 Vodafone Idea Limited
List of Figures
- Figure 1: Global Telecom Industry in India Revenue Breakdown (Million, %) by Region 2024 & 2032
- Figure 2: India Telecom Industry in India Revenue (Million), by Country 2024 & 2032
- Figure 3: India Telecom Industry in India Revenue Share (%), by Country 2024 & 2032
- Figure 4: North America Telecom Industry in India Revenue (Million), by Segmenta 2024 & 2032
- Figure 5: North America Telecom Industry in India Revenue Share (%), by Segmenta 2024 & 2032
- Figure 6: North America Telecom Industry in India Revenue (Million), by Country 2024 & 2032
- Figure 7: North America Telecom Industry in India Revenue Share (%), by Country 2024 & 2032
- Figure 8: South America Telecom Industry in India Revenue (Million), by Segmenta 2024 & 2032
- Figure 9: South America Telecom Industry in India Revenue Share (%), by Segmenta 2024 & 2032
- Figure 10: South America Telecom Industry in India Revenue (Million), by Country 2024 & 2032
- Figure 11: South America Telecom Industry in India Revenue Share (%), by Country 2024 & 2032
- Figure 12: Europe Telecom Industry in India Revenue (Million), by Segmenta 2024 & 2032
- Figure 13: Europe Telecom Industry in India Revenue Share (%), by Segmenta 2024 & 2032
- Figure 14: Europe Telecom Industry in India Revenue (Million), by Country 2024 & 2032
- Figure 15: Europe Telecom Industry in India Revenue Share (%), by Country 2024 & 2032
- Figure 16: Middle East & Africa Telecom Industry in India Revenue (Million), by Segmenta 2024 & 2032
- Figure 17: Middle East & Africa Telecom Industry in India Revenue Share (%), by Segmenta 2024 & 2032
- Figure 18: Middle East & Africa Telecom Industry in India Revenue (Million), by Country 2024 & 2032
- Figure 19: Middle East & Africa Telecom Industry in India Revenue Share (%), by Country 2024 & 2032
- Figure 20: Asia Pacific Telecom Industry in India Revenue (Million), by Segmenta 2024 & 2032
- Figure 21: Asia Pacific Telecom Industry in India Revenue Share (%), by Segmenta 2024 & 2032
- Figure 22: Asia Pacific Telecom Industry in India Revenue (Million), by Country 2024 & 2032
- Figure 23: Asia Pacific Telecom Industry in India Revenue Share (%), by Country 2024 & 2032
List of Tables
- Table 1: Global Telecom Industry in India Revenue Million Forecast, by Region 2019 & 2032
- Table 2: Global Telecom Industry in India Revenue Million Forecast, by Segmenta 2019 & 2032
- Table 3: Global Telecom Industry in India Revenue Million Forecast, by Region 2019 & 2032
- Table 4: Global Telecom Industry in India Revenue Million Forecast, by Country 2019 & 2032
- Table 5: North India Telecom Industry in India Revenue (Million) Forecast, by Application 2019 & 2032
- Table 6: South India Telecom Industry in India Revenue (Million) Forecast, by Application 2019 & 2032
- Table 7: East India Telecom Industry in India Revenue (Million) Forecast, by Application 2019 & 2032
- Table 8: West India Telecom Industry in India Revenue (Million) Forecast, by Application 2019 & 2032
- Table 9: Global Telecom Industry in India Revenue Million Forecast, by Segmenta 2019 & 2032
- Table 10: Global Telecom Industry in India Revenue Million Forecast, by Country 2019 & 2032
- Table 11: United States Telecom Industry in India Revenue (Million) Forecast, by Application 2019 & 2032
- Table 12: Canada Telecom Industry in India Revenue (Million) Forecast, by Application 2019 & 2032
- Table 13: Mexico Telecom Industry in India Revenue (Million) Forecast, by Application 2019 & 2032
- Table 14: Global Telecom Industry in India Revenue Million Forecast, by Segmenta 2019 & 2032
- Table 15: Global Telecom Industry in India Revenue Million Forecast, by Country 2019 & 2032
- Table 16: Brazil Telecom Industry in India Revenue (Million) Forecast, by Application 2019 & 2032
- Table 17: Argentina Telecom Industry in India Revenue (Million) Forecast, by Application 2019 & 2032
- Table 18: Rest of South America Telecom Industry in India Revenue (Million) Forecast, by Application 2019 & 2032
- Table 19: Global Telecom Industry in India Revenue Million Forecast, by Segmenta 2019 & 2032
- Table 20: Global Telecom Industry in India Revenue Million Forecast, by Country 2019 & 2032
- Table 21: United Kingdom Telecom Industry in India Revenue (Million) Forecast, by Application 2019 & 2032
- Table 22: Germany Telecom Industry in India Revenue (Million) Forecast, by Application 2019 & 2032
- Table 23: France Telecom Industry in India Revenue (Million) Forecast, by Application 2019 & 2032
- Table 24: Italy Telecom Industry in India Revenue (Million) Forecast, by Application 2019 & 2032
- Table 25: Spain Telecom Industry in India Revenue (Million) Forecast, by Application 2019 & 2032
- Table 26: Russia Telecom Industry in India Revenue (Million) Forecast, by Application 2019 & 2032
- Table 27: Benelux Telecom Industry in India Revenue (Million) Forecast, by Application 2019 & 2032
- Table 28: Nordics Telecom Industry in India Revenue (Million) Forecast, by Application 2019 & 2032
- Table 29: Rest of Europe Telecom Industry in India Revenue (Million) Forecast, by Application 2019 & 2032
- Table 30: Global Telecom Industry in India Revenue Million Forecast, by Segmenta 2019 & 2032
- Table 31: Global Telecom Industry in India Revenue Million Forecast, by Country 2019 & 2032
- Table 32: Turkey Telecom Industry in India Revenue (Million) Forecast, by Application 2019 & 2032
- Table 33: Israel Telecom Industry in India Revenue (Million) Forecast, by Application 2019 & 2032
- Table 34: GCC Telecom Industry in India Revenue (Million) Forecast, by Application 2019 & 2032
- Table 35: North Africa Telecom Industry in India Revenue (Million) Forecast, by Application 2019 & 2032
- Table 36: South Africa Telecom Industry in India Revenue (Million) Forecast, by Application 2019 & 2032
- Table 37: Rest of Middle East & Africa Telecom Industry in India Revenue (Million) Forecast, by Application 2019 & 2032
- Table 38: Global Telecom Industry in India Revenue Million Forecast, by Segmenta 2019 & 2032
- Table 39: Global Telecom Industry in India Revenue Million Forecast, by Country 2019 & 2032
- Table 40: China Telecom Industry in India Revenue (Million) Forecast, by Application 2019 & 2032
- Table 41: India Telecom Industry in India Revenue (Million) Forecast, by Application 2019 & 2032
- Table 42: Japan Telecom Industry in India Revenue (Million) Forecast, by Application 2019 & 2032
- Table 43: South Korea Telecom Industry in India Revenue (Million) Forecast, by Application 2019 & 2032
- Table 44: ASEAN Telecom Industry in India Revenue (Million) Forecast, by Application 2019 & 2032
- Table 45: Oceania Telecom Industry in India Revenue (Million) Forecast, by Application 2019 & 2032
- Table 46: Rest of Asia Pacific Telecom Industry in India Revenue (Million) Forecast, by Application 2019 & 2032
Frequently Asked Questions
1. What is the projected Compound Annual Growth Rate (CAGR) of the Telecom Industry in India?
The projected CAGR is approximately 9.40%.
2. Which companies are prominent players in the Telecom Industry in India?
Key companies in the market include Vodafone Idea Limited, Reliance Jio Infocomm, Bharat Sanchar Nigam Limited (BSNL), Bharti Airtel, Mahanagar Telephone Nigam Ltd ( MTNL)*List Not Exhaustive.
3. What are the main segments of the Telecom Industry in India?
The market segments include Segmenta.
4. Can you provide details about the market size?
The market size is estimated to be USD 48.61 Million as of 2022.
5. What are some drivers contributing to market growth?
Increasing Penetration of 4G and Upgradation of 5G; Foreign Direct Investment (FDI).
6. What are the notable trends driving market growth?
Increasing Penetration of 4G and Upgradation of 5G.
7. Are there any restraints impacting market growth?
High Initial Cost and Lower Awareness.
8. Can you provide examples of recent developments in the market?
October 2022 - Vi (Vodafone Idea Limited) expanded network capacity in Andhra Pradesh and Telangana to ensure superior giganet 4G speed. It increased the deployment of the 1,800 MHz spectrum band to provide higher download and upload speeds. It also launched a campaign to emphasize Andhra Pradesh and Telangana's stronger and superior network.
9. What pricing options are available for accessing the report?
Pricing options include single-user, multi-user, and enterprise licenses priced at USD 3800, USD 4500, and USD 5800 respectively.
10. Is the market size provided in terms of value or volume?
The market size is provided in terms of value, measured in Million.
11. Are there any specific market keywords associated with the report?
Yes, the market keyword associated with the report is "Telecom Industry in India," which aids in identifying and referencing the specific market segment covered.
12. How do I determine which pricing option suits my needs best?
The pricing options vary based on user requirements and access needs. Individual users may opt for single-user licenses, while businesses requiring broader access may choose multi-user or enterprise licenses for cost-effective access to the report.
13. Are there any additional resources or data provided in the Telecom Industry in India report?
While the report offers comprehensive insights, it's advisable to review the specific contents or supplementary materials provided to ascertain if additional resources or data are available.
14. How can I stay updated on further developments or reports in the Telecom Industry in India?
To stay informed about further developments, trends, and reports in the Telecom Industry in India, consider subscribing to industry newsletters, following relevant companies and organizations, or regularly checking reputable industry news sources and publications.
Methodology
Step 1 - Identification of Relevant Samples Size from Population Database


Step 2 - Approaches for Defining Global Market Size (Value, Volume* & Price*)

Note*: In applicable scenarios
Step 3 - Data Sources
Primary Research
- Web Analytics
- Survey Reports
- Research Institute
- Latest Research Reports
- Opinion Leaders
Secondary Research
- Annual Reports
- White Paper
- Latest Press Release
- Industry Association
- Paid Database
- Investor Presentations

Step 4 - Data Triangulation
Involves using different sources of information in order to increase the validity of a study
These sources are likely to be stakeholders in a program - participants, other researchers, program staff, other community members, and so on.
Then we put all data in single framework & apply various statistical tools to find out the dynamic on the market.
During the analysis stage, feedback from the stakeholder groups would be compared to determine areas of agreement as well as areas of divergence


