
Key Insights
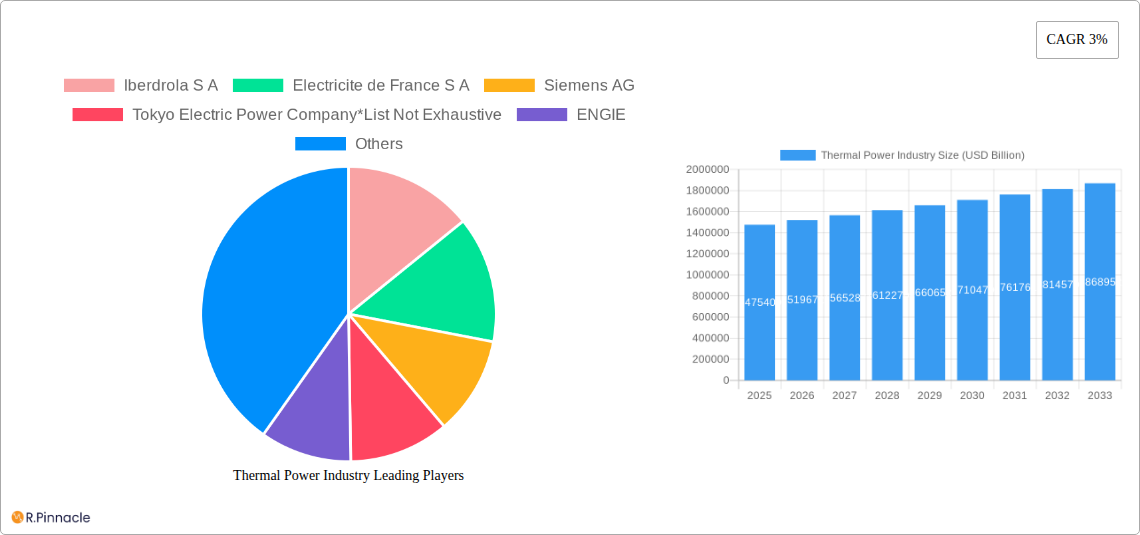
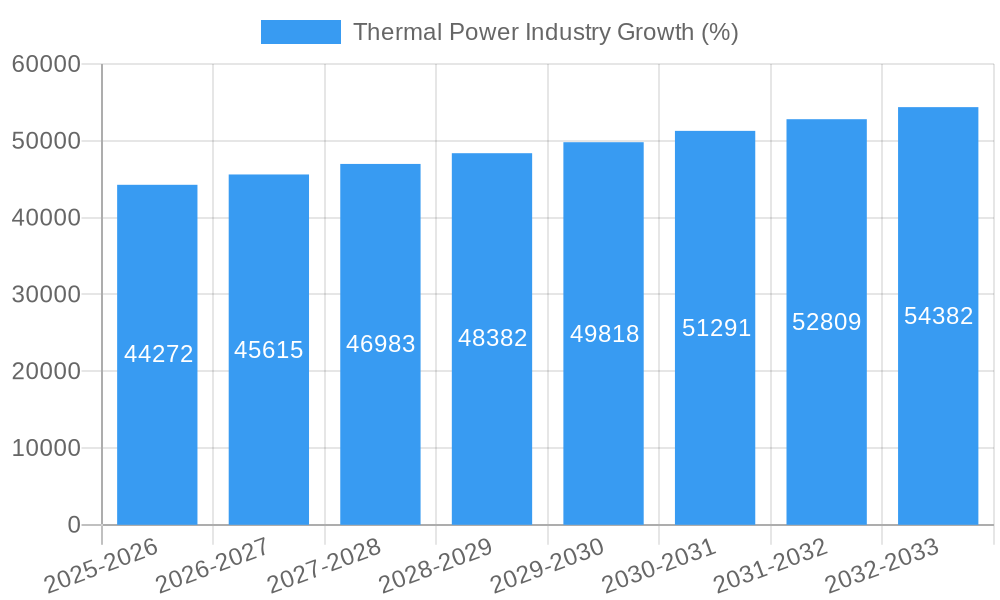
The global thermal power industry, valued at $1,475.40 billion in 2025, is projected to experience a steady Compound Annual Growth Rate (CAGR) of 3% from 2025 to 2033. This growth is driven by several factors. Firstly, consistent demand for reliable and baseload electricity generation in developing economies fuels expansion. Secondly, ongoing advancements in thermal power plant technology, particularly focusing on efficiency improvements and emission reduction strategies, are extending the lifespan and relevance of thermal power generation. While renewable energy sources are gaining traction, thermal power plants remain crucial for grid stability and energy security, particularly during periods of low renewable energy output. However, the industry faces significant headwinds, primarily stringent environmental regulations aimed at curbing greenhouse gas emissions. This necessitates substantial investments in carbon capture, utilization, and storage (CCUS) technologies, increasing the overall cost of power generation and potentially slowing down growth in certain regions. Furthermore, increasing competition from renewable energy sources like solar and wind, particularly in regions with favorable renewable energy resources, poses a significant challenge. The industry's segmentation by fuel type reveals a diversified landscape, with coal, gas, and nuclear power plants holding significant market share. Coal's share is expected to gradually decline due to environmental concerns, while gas and nuclear power are likely to maintain their positions, albeit with varying growth trajectories across regions based on local regulatory frameworks and energy policies. Key players like Iberdrola, EDF, Siemens, and others are strategically adapting their business models to navigate these challenges, emphasizing diversification, technological innovation, and sustainable practices.
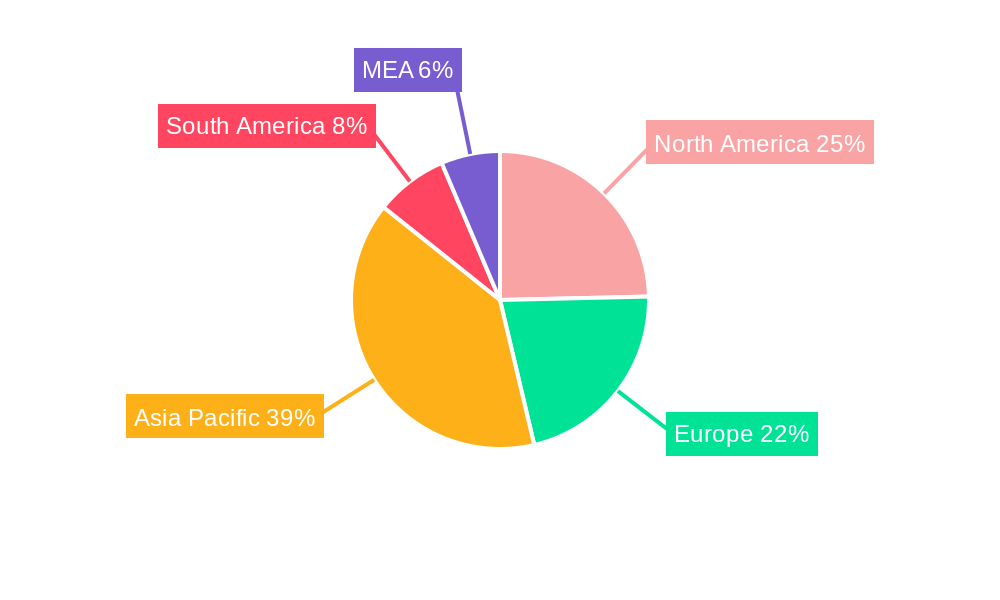
The geographical distribution of the thermal power market reflects varying levels of economic development and energy needs across regions. North America and Asia Pacific are anticipated to remain dominant markets, driven by strong energy demands in rapidly industrializing economies. However, stricter environmental regulations in North America could curb the growth of coal-fired power plants, favoring cleaner fuel sources. Europe's market is expected to witness moderate growth, influenced by its transition towards renewable energy sources and rigorous emission control measures. Emerging economies in Asia Pacific, particularly in Southeast Asia, are anticipated to see significant investments in thermal power plants, though efforts to mitigate environmental impacts will be a critical consideration for sustainable growth in these regions. The Middle East and Africa region presents a mixed picture, with some countries experiencing substantial growth while others face challenges related to infrastructure development and energy access. The overall market trajectory suggests a continued, albeit moderated, role for thermal power in the global energy mix, with a clear emphasis on technological advancement, environmental responsibility, and strategic regional variations in growth potential.
Thermal Power Industry Report: 2019-2033 Forecast
This comprehensive report provides an in-depth analysis of the global thermal power industry, offering valuable insights for industry professionals, investors, and strategic decision-makers. Covering the period 2019-2033, with a focus on 2025, this report examines market dynamics, key players, and future trends, providing actionable intelligence for navigating this evolving sector.
Thermal Power Industry Market Structure & Innovation Trends
The thermal power industry exhibits a moderately concentrated market structure, with key players like Iberdrola S.A., Electricite de France S.A., Siemens AG, and Tokyo Electric Power Company holding significant market shares. Other major players include ENGIE, National Thermal Power Corporation Limited, General Electric Company, Chubu Electric Power Co. Inc, ABB, and Bharat Heavy Electricals Limited (BHEL). The industry is characterized by continuous innovation driven by the need for increased efficiency and reduced environmental impact. Market share fluctuations are influenced by M&A activities, with recent deals totaling an estimated USD xx billion. Regulatory frameworks, particularly concerning emissions standards, significantly impact market dynamics. The industry faces competition from renewable energy sources, leading to increased pressure on pricing and profitability. End-user demographics are largely industrial and commercial entities, with power grids being the primary consumers.
- Market Concentration: Moderate, with top players controlling a significant share.
- Innovation Drivers: Efficiency improvements, emission reduction technologies, and regulatory compliance.
- M&A Activity: USD xx billion in recent years, influencing market consolidation.
- Product Substitutes: Renewable energy sources (solar, wind, hydro).
- End-User Demographics: Primarily industrial and commercial sectors.
Thermal Power Industry Market Dynamics & Trends
The thermal power market is projected to experience a Compound Annual Growth Rate (CAGR) of xx% during the forecast period (2025-2033). Market growth is primarily driven by increasing energy demand in developing economies, particularly in Asia and Africa. Technological disruptions, such as advancements in supercritical and ultra-supercritical power generation, are improving efficiency and reducing emissions. However, consumer preferences are shifting towards cleaner energy sources, leading to decreased market penetration for traditional thermal power plants in some regions. Competitive dynamics are intense, with established players facing challenges from both renewable energy providers and newer, more efficient thermal technologies. Market penetration of advanced thermal technologies is expected to increase significantly in the coming years.
Dominant Regions & Segments in Thermal Power Industry
Asia is currently the dominant region in the thermal power industry, driven primarily by strong economic growth and rising energy consumption. Within fuel types, coal remains the dominant segment globally, although its market share is expected to decrease due to stricter environmental regulations. Natural gas is projected to experience significant growth, fueled by its relatively lower emissions compared to coal. Nuclear power remains a significant contributor, with expansion dependent on regulatory approvals and public perception. The "Others" segment, including biomass and waste-to-energy, is also exhibiting growth.
- Key Drivers in Asia: Rapid industrialization, population growth, and increasing urbanization.
- Coal Segment: Dominant but facing decline due to environmental concerns.
- Gas Segment: Strong growth driven by lower emissions compared to coal.
- Nuclear Segment: Growth dependent on regulatory and public acceptance.
- Others Segment: Growing due to sustainable energy alternatives.
Thermal Power Industry Product Innovations
Recent innovations focus on improving efficiency and reducing environmental impact. High-efficiency low-emission (HELE) power plants are gaining traction, alongside advancements in carbon capture and storage (CCS) technologies. These technologies enhance the competitiveness of thermal power in a changing energy landscape. The focus on reducing operational costs and improving reliability is driving the development of advanced control systems and predictive maintenance technologies. Furthermore, digitalization initiatives aim to increase overall plant efficiency and reduce downtime.
Report Scope & Segmentation Analysis
This report segments the thermal power market by fuel type: Coal, Gas, Nuclear, and Others. Each segment's growth projections, market sizes, and competitive dynamics are analyzed in detail. The Coal segment is expected to decline in size, while the Gas segment will witness substantial growth. The Nuclear segment faces challenges related to regulatory hurdles and public opinion. The Others segment, encompassing diverse technologies, is predicted to exhibit moderate growth.
Key Drivers of Thermal Power Industry Growth
Key growth drivers include increasing global energy demand, particularly from developing economies; advancements in thermal power technology, leading to increased efficiency and reduced emissions; and government support for infrastructure projects, especially in regions with limited access to electricity. The continuous development of efficient and cost-effective thermal power generation remains a vital element of the energy supply mix.
Challenges in the Thermal Power Industry Sector
The industry faces challenges from stringent environmental regulations, leading to higher compliance costs and reduced profitability. Supply chain disruptions, particularly in the procurement of critical components, also impact operations. Furthermore, intense competition from renewable energy sources and a shift in consumer preferences towards sustainable energy present a significant challenge. This translates into reduced market share and increased pressure on pricing.
Emerging Opportunities in Thermal Power Industry
Emerging opportunities lie in the development and deployment of carbon capture and storage (CCS) technologies, integrating thermal power with renewable energy sources for hybrid systems, and exploring new markets in developing countries with high energy demand. Further innovations in energy storage systems coupled with thermal generation will further enhance the energy sector's stability.
Leading Players in the Thermal Power Industry Market
- Iberdrola S.A.
- Electricite de France S.A.
- Siemens AG
- Tokyo Electric Power Company
- ENGIE
- National Thermal Power Corporation Limited
- General Electric Company
- Chubu Electric Power Co. Inc
- ABB
- Bharat Heavy Electricals Limited (BHEL)
Key Developments in Thermal Power Industry
- 2020: Several countries implemented stricter emission regulations, impacting thermal power plant operations.
- 2021: Significant investments in HELE technology were announced by several leading companies.
- 2022: Increased focus on CCS technology development and pilot projects.
- 2023: Several mergers and acquisitions within the industry reshaped the competitive landscape.
- 2024: Several nations declared net-zero emission targets, further influencing thermal power plant expansion plans.
Future Outlook for Thermal Power Industry Market
The future of the thermal power industry hinges on technological advancements, regulatory landscapes, and evolving consumer preferences. While facing challenges from renewables, the sector will continue to play a crucial role in the energy mix, particularly in regions with high energy demand. Strategic focus on efficiency improvements, emission reductions, and diversified fuel sources will be critical for long-term growth and sustainability. The adoption of flexible and efficient power plants which can quickly adapt to changing energy demand will also play a role in future development.
Thermal Power Industry Segmentation
-
1. Fuel Type
- 1.1. Coal
- 1.2. Gas
- 1.3. Nuclear
- 1.4. Others
Thermal Power Industry Segmentation By Geography
- 1. North America
- 2. Asia Pacific
- 3. Europe
- 4. South America
- 5. Middle East and Africa
Thermal Power Industry REPORT HIGHLIGHTS
| Aspects | Details |
|---|---|
| Study Period | 2019-2033 |
| Base Year | 2024 |
| Estimated Year | 2025 |
| Forecast Period | 2025-2033 |
| Historical Period | 2019-2024 |
| Growth Rate | CAGR of 3% from 2019-2033 |
| Segmentation |
|
Table of Contents
- 1. Introduction
- 1.1. Research Scope
- 1.2. Market Segmentation
- 1.3. Research Methodology
- 1.4. Definitions and Assumptions
- 2. Executive Summary
- 2.1. Introduction
- 3. Market Dynamics
- 3.1. Introduction
- 3.2. Market Drivers
- 3.2.1. 4.; Increasing investment in the Midstream Sector4.; Increasing Production of Oil and Natural Gas
- 3.3. Market Restrains
- 3.3.1. 4.; Inadequate Infrastructure in the Country
- 3.4. Market Trends
- 3.4.1. Natural Gas Power Plants to Witness Significant Growth
- 4. Market Factor Analysis
- 4.1. Porters Five Forces
- 4.2. Supply/Value Chain
- 4.3. PESTEL analysis
- 4.4. Market Entropy
- 4.5. Patent/Trademark Analysis
- 5. Global Thermal Power Industry Analysis, Insights and Forecast, 2019-2031
- 5.1. Market Analysis, Insights and Forecast - by Fuel Type
- 5.1.1. Coal
- 5.1.2. Gas
- 5.1.3. Nuclear
- 5.1.4. Others
- 5.2. Market Analysis, Insights and Forecast - by Region
- 5.2.1. North America
- 5.2.2. Asia Pacific
- 5.2.3. Europe
- 5.2.4. South America
- 5.2.5. Middle East and Africa
- 5.1. Market Analysis, Insights and Forecast - by Fuel Type
- 6. North America Thermal Power Industry Analysis, Insights and Forecast, 2019-2031
- 6.1. Market Analysis, Insights and Forecast - by Fuel Type
- 6.1.1. Coal
- 6.1.2. Gas
- 6.1.3. Nuclear
- 6.1.4. Others
- 6.1. Market Analysis, Insights and Forecast - by Fuel Type
- 7. Asia Pacific Thermal Power Industry Analysis, Insights and Forecast, 2019-2031
- 7.1. Market Analysis, Insights and Forecast - by Fuel Type
- 7.1.1. Coal
- 7.1.2. Gas
- 7.1.3. Nuclear
- 7.1.4. Others
- 7.1. Market Analysis, Insights and Forecast - by Fuel Type
- 8. Europe Thermal Power Industry Analysis, Insights and Forecast, 2019-2031
- 8.1. Market Analysis, Insights and Forecast - by Fuel Type
- 8.1.1. Coal
- 8.1.2. Gas
- 8.1.3. Nuclear
- 8.1.4. Others
- 8.1. Market Analysis, Insights and Forecast - by Fuel Type
- 9. South America Thermal Power Industry Analysis, Insights and Forecast, 2019-2031
- 9.1. Market Analysis, Insights and Forecast - by Fuel Type
- 9.1.1. Coal
- 9.1.2. Gas
- 9.1.3. Nuclear
- 9.1.4. Others
- 9.1. Market Analysis, Insights and Forecast - by Fuel Type
- 10. Middle East and Africa Thermal Power Industry Analysis, Insights and Forecast, 2019-2031
- 10.1. Market Analysis, Insights and Forecast - by Fuel Type
- 10.1.1. Coal
- 10.1.2. Gas
- 10.1.3. Nuclear
- 10.1.4. Others
- 10.1. Market Analysis, Insights and Forecast - by Fuel Type
- 11. North America Thermal Power Industry Analysis, Insights and Forecast, 2019-2031
- 11.1. Market Analysis, Insights and Forecast - By Country/Sub-region
- 11.1.1 United States
- 11.1.2 Canada
- 11.1.3 Mexico
- 12. Europe Thermal Power Industry Analysis, Insights and Forecast, 2019-2031
- 12.1. Market Analysis, Insights and Forecast - By Country/Sub-region
- 12.1.1 Germany
- 12.1.2 United Kingdom
- 12.1.3 France
- 12.1.4 Spain
- 12.1.5 Italy
- 12.1.6 Spain
- 12.1.7 Belgium
- 12.1.8 Netherland
- 12.1.9 Nordics
- 12.1.10 Rest of Europe
- 13. Asia Pacific Thermal Power Industry Analysis, Insights and Forecast, 2019-2031
- 13.1. Market Analysis, Insights and Forecast - By Country/Sub-region
- 13.1.1 China
- 13.1.2 Japan
- 13.1.3 India
- 13.1.4 South Korea
- 13.1.5 Southeast Asia
- 13.1.6 Australia
- 13.1.7 Indonesia
- 13.1.8 Phillipes
- 13.1.9 Singapore
- 13.1.10 Thailandc
- 13.1.11 Rest of Asia Pacific
- 14. South America Thermal Power Industry Analysis, Insights and Forecast, 2019-2031
- 14.1. Market Analysis, Insights and Forecast - By Country/Sub-region
- 14.1.1 Brazil
- 14.1.2 Argentina
- 14.1.3 Peru
- 14.1.4 Chile
- 14.1.5 Colombia
- 14.1.6 Ecuador
- 14.1.7 Venezuela
- 14.1.8 Rest of South America
- 15. North America Thermal Power Industry Analysis, Insights and Forecast, 2019-2031
- 15.1. Market Analysis, Insights and Forecast - By Country/Sub-region
- 15.1.1 United States
- 15.1.2 Canada
- 15.1.3 Mexico
- 16. MEA Thermal Power Industry Analysis, Insights and Forecast, 2019-2031
- 16.1. Market Analysis, Insights and Forecast - By Country/Sub-region
- 16.1.1 United Arab Emirates
- 16.1.2 Saudi Arabia
- 16.1.3 South Africa
- 16.1.4 Rest of Middle East and Africa
- 17. Competitive Analysis
- 17.1. Global Market Share Analysis 2024
- 17.2. Company Profiles
- 17.2.1 Iberdrola S A
- 17.2.1.1. Overview
- 17.2.1.2. Products
- 17.2.1.3. SWOT Analysis
- 17.2.1.4. Recent Developments
- 17.2.1.5. Financials (Based on Availability)
- 17.2.2 Electricite de France S A
- 17.2.2.1. Overview
- 17.2.2.2. Products
- 17.2.2.3. SWOT Analysis
- 17.2.2.4. Recent Developments
- 17.2.2.5. Financials (Based on Availability)
- 17.2.3 Siemens AG
- 17.2.3.1. Overview
- 17.2.3.2. Products
- 17.2.3.3. SWOT Analysis
- 17.2.3.4. Recent Developments
- 17.2.3.5. Financials (Based on Availability)
- 17.2.4 Tokyo Electric Power Company*List Not Exhaustive
- 17.2.4.1. Overview
- 17.2.4.2. Products
- 17.2.4.3. SWOT Analysis
- 17.2.4.4. Recent Developments
- 17.2.4.5. Financials (Based on Availability)
- 17.2.5 ENGIE
- 17.2.5.1. Overview
- 17.2.5.2. Products
- 17.2.5.3. SWOT Analysis
- 17.2.5.4. Recent Developments
- 17.2.5.5. Financials (Based on Availability)
- 17.2.6 National Thermal Power Corporation Limited
- 17.2.6.1. Overview
- 17.2.6.2. Products
- 17.2.6.3. SWOT Analysis
- 17.2.6.4. Recent Developments
- 17.2.6.5. Financials (Based on Availability)
- 17.2.7 General Electric Company
- 17.2.7.1. Overview
- 17.2.7.2. Products
- 17.2.7.3. SWOT Analysis
- 17.2.7.4. Recent Developments
- 17.2.7.5. Financials (Based on Availability)
- 17.2.8 Chubu Electric Power Co Inc
- 17.2.8.1. Overview
- 17.2.8.2. Products
- 17.2.8.3. SWOT Analysis
- 17.2.8.4. Recent Developments
- 17.2.8.5. Financials (Based on Availability)
- 17.2.9 ABB
- 17.2.9.1. Overview
- 17.2.9.2. Products
- 17.2.9.3. SWOT Analysis
- 17.2.9.4. Recent Developments
- 17.2.9.5. Financials (Based on Availability)
- 17.2.10 Bharat Heavy Electricals Limited (BHEL)
- 17.2.10.1. Overview
- 17.2.10.2. Products
- 17.2.10.3. SWOT Analysis
- 17.2.10.4. Recent Developments
- 17.2.10.5. Financials (Based on Availability)
- 17.2.1 Iberdrola S A
List of Figures
- Figure 1: Global Thermal Power Industry Revenue Breakdown (USD Billion, %) by Region 2024 & 2032
- Figure 2: Global Thermal Power Industry Volume Breakdown (Megawatt, %) by Region 2024 & 2032
- Figure 3: North America Thermal Power Industry Revenue (USD Billion), by Country 2024 & 2032
- Figure 4: North America Thermal Power Industry Volume (Megawatt), by Country 2024 & 2032
- Figure 5: North America Thermal Power Industry Revenue Share (%), by Country 2024 & 2032
- Figure 6: North America Thermal Power Industry Volume Share (%), by Country 2024 & 2032
- Figure 7: Europe Thermal Power Industry Revenue (USD Billion), by Country 2024 & 2032
- Figure 8: Europe Thermal Power Industry Volume (Megawatt), by Country 2024 & 2032
- Figure 9: Europe Thermal Power Industry Revenue Share (%), by Country 2024 & 2032
- Figure 10: Europe Thermal Power Industry Volume Share (%), by Country 2024 & 2032
- Figure 11: Asia Pacific Thermal Power Industry Revenue (USD Billion), by Country 2024 & 2032
- Figure 12: Asia Pacific Thermal Power Industry Volume (Megawatt), by Country 2024 & 2032
- Figure 13: Asia Pacific Thermal Power Industry Revenue Share (%), by Country 2024 & 2032
- Figure 14: Asia Pacific Thermal Power Industry Volume Share (%), by Country 2024 & 2032
- Figure 15: South America Thermal Power Industry Revenue (USD Billion), by Country 2024 & 2032
- Figure 16: South America Thermal Power Industry Volume (Megawatt), by Country 2024 & 2032
- Figure 17: South America Thermal Power Industry Revenue Share (%), by Country 2024 & 2032
- Figure 18: South America Thermal Power Industry Volume Share (%), by Country 2024 & 2032
- Figure 19: North America Thermal Power Industry Revenue (USD Billion), by Country 2024 & 2032
- Figure 20: North America Thermal Power Industry Volume (Megawatt), by Country 2024 & 2032
- Figure 21: North America Thermal Power Industry Revenue Share (%), by Country 2024 & 2032
- Figure 22: North America Thermal Power Industry Volume Share (%), by Country 2024 & 2032
- Figure 23: MEA Thermal Power Industry Revenue (USD Billion), by Country 2024 & 2032
- Figure 24: MEA Thermal Power Industry Volume (Megawatt), by Country 2024 & 2032
- Figure 25: MEA Thermal Power Industry Revenue Share (%), by Country 2024 & 2032
- Figure 26: MEA Thermal Power Industry Volume Share (%), by Country 2024 & 2032
- Figure 27: North America Thermal Power Industry Revenue (USD Billion), by Fuel Type 2024 & 2032
- Figure 28: North America Thermal Power Industry Volume (Megawatt), by Fuel Type 2024 & 2032
- Figure 29: North America Thermal Power Industry Revenue Share (%), by Fuel Type 2024 & 2032
- Figure 30: North America Thermal Power Industry Volume Share (%), by Fuel Type 2024 & 2032
- Figure 31: North America Thermal Power Industry Revenue (USD Billion), by Country 2024 & 2032
- Figure 32: North America Thermal Power Industry Volume (Megawatt), by Country 2024 & 2032
- Figure 33: North America Thermal Power Industry Revenue Share (%), by Country 2024 & 2032
- Figure 34: North America Thermal Power Industry Volume Share (%), by Country 2024 & 2032
- Figure 35: Asia Pacific Thermal Power Industry Revenue (USD Billion), by Fuel Type 2024 & 2032
- Figure 36: Asia Pacific Thermal Power Industry Volume (Megawatt), by Fuel Type 2024 & 2032
- Figure 37: Asia Pacific Thermal Power Industry Revenue Share (%), by Fuel Type 2024 & 2032
- Figure 38: Asia Pacific Thermal Power Industry Volume Share (%), by Fuel Type 2024 & 2032
- Figure 39: Asia Pacific Thermal Power Industry Revenue (USD Billion), by Country 2024 & 2032
- Figure 40: Asia Pacific Thermal Power Industry Volume (Megawatt), by Country 2024 & 2032
- Figure 41: Asia Pacific Thermal Power Industry Revenue Share (%), by Country 2024 & 2032
- Figure 42: Asia Pacific Thermal Power Industry Volume Share (%), by Country 2024 & 2032
- Figure 43: Europe Thermal Power Industry Revenue (USD Billion), by Fuel Type 2024 & 2032
- Figure 44: Europe Thermal Power Industry Volume (Megawatt), by Fuel Type 2024 & 2032
- Figure 45: Europe Thermal Power Industry Revenue Share (%), by Fuel Type 2024 & 2032
- Figure 46: Europe Thermal Power Industry Volume Share (%), by Fuel Type 2024 & 2032
- Figure 47: Europe Thermal Power Industry Revenue (USD Billion), by Country 2024 & 2032
- Figure 48: Europe Thermal Power Industry Volume (Megawatt), by Country 2024 & 2032
- Figure 49: Europe Thermal Power Industry Revenue Share (%), by Country 2024 & 2032
- Figure 50: Europe Thermal Power Industry Volume Share (%), by Country 2024 & 2032
- Figure 51: South America Thermal Power Industry Revenue (USD Billion), by Fuel Type 2024 & 2032
- Figure 52: South America Thermal Power Industry Volume (Megawatt), by Fuel Type 2024 & 2032
- Figure 53: South America Thermal Power Industry Revenue Share (%), by Fuel Type 2024 & 2032
- Figure 54: South America Thermal Power Industry Volume Share (%), by Fuel Type 2024 & 2032
- Figure 55: South America Thermal Power Industry Revenue (USD Billion), by Country 2024 & 2032
- Figure 56: South America Thermal Power Industry Volume (Megawatt), by Country 2024 & 2032
- Figure 57: South America Thermal Power Industry Revenue Share (%), by Country 2024 & 2032
- Figure 58: South America Thermal Power Industry Volume Share (%), by Country 2024 & 2032
- Figure 59: Middle East and Africa Thermal Power Industry Revenue (USD Billion), by Fuel Type 2024 & 2032
- Figure 60: Middle East and Africa Thermal Power Industry Volume (Megawatt), by Fuel Type 2024 & 2032
- Figure 61: Middle East and Africa Thermal Power Industry Revenue Share (%), by Fuel Type 2024 & 2032
- Figure 62: Middle East and Africa Thermal Power Industry Volume Share (%), by Fuel Type 2024 & 2032
- Figure 63: Middle East and Africa Thermal Power Industry Revenue (USD Billion), by Country 2024 & 2032
- Figure 64: Middle East and Africa Thermal Power Industry Volume (Megawatt), by Country 2024 & 2032
- Figure 65: Middle East and Africa Thermal Power Industry Revenue Share (%), by Country 2024 & 2032
- Figure 66: Middle East and Africa Thermal Power Industry Volume Share (%), by Country 2024 & 2032
List of Tables
- Table 1: Global Thermal Power Industry Revenue USD Billion Forecast, by Region 2019 & 2032
- Table 2: Global Thermal Power Industry Volume Megawatt Forecast, by Region 2019 & 2032
- Table 3: Global Thermal Power Industry Revenue USD Billion Forecast, by Fuel Type 2019 & 2032
- Table 4: Global Thermal Power Industry Volume Megawatt Forecast, by Fuel Type 2019 & 2032
- Table 5: Global Thermal Power Industry Revenue USD Billion Forecast, by Region 2019 & 2032
- Table 6: Global Thermal Power Industry Volume Megawatt Forecast, by Region 2019 & 2032
- Table 7: Global Thermal Power Industry Revenue USD Billion Forecast, by Country 2019 & 2032
- Table 8: Global Thermal Power Industry Volume Megawatt Forecast, by Country 2019 & 2032
- Table 9: United States Thermal Power Industry Revenue (USD Billion) Forecast, by Application 2019 & 2032
- Table 10: United States Thermal Power Industry Volume (Megawatt) Forecast, by Application 2019 & 2032
- Table 11: Canada Thermal Power Industry Revenue (USD Billion) Forecast, by Application 2019 & 2032
- Table 12: Canada Thermal Power Industry Volume (Megawatt) Forecast, by Application 2019 & 2032
- Table 13: Mexico Thermal Power Industry Revenue (USD Billion) Forecast, by Application 2019 & 2032
- Table 14: Mexico Thermal Power Industry Volume (Megawatt) Forecast, by Application 2019 & 2032
- Table 15: Global Thermal Power Industry Revenue USD Billion Forecast, by Country 2019 & 2032
- Table 16: Global Thermal Power Industry Volume Megawatt Forecast, by Country 2019 & 2032
- Table 17: Germany Thermal Power Industry Revenue (USD Billion) Forecast, by Application 2019 & 2032
- Table 18: Germany Thermal Power Industry Volume (Megawatt) Forecast, by Application 2019 & 2032
- Table 19: United Kingdom Thermal Power Industry Revenue (USD Billion) Forecast, by Application 2019 & 2032
- Table 20: United Kingdom Thermal Power Industry Volume (Megawatt) Forecast, by Application 2019 & 2032
- Table 21: France Thermal Power Industry Revenue (USD Billion) Forecast, by Application 2019 & 2032
- Table 22: France Thermal Power Industry Volume (Megawatt) Forecast, by Application 2019 & 2032
- Table 23: Spain Thermal Power Industry Revenue (USD Billion) Forecast, by Application 2019 & 2032
- Table 24: Spain Thermal Power Industry Volume (Megawatt) Forecast, by Application 2019 & 2032
- Table 25: Italy Thermal Power Industry Revenue (USD Billion) Forecast, by Application 2019 & 2032
- Table 26: Italy Thermal Power Industry Volume (Megawatt) Forecast, by Application 2019 & 2032
- Table 27: Spain Thermal Power Industry Revenue (USD Billion) Forecast, by Application 2019 & 2032
- Table 28: Spain Thermal Power Industry Volume (Megawatt) Forecast, by Application 2019 & 2032
- Table 29: Belgium Thermal Power Industry Revenue (USD Billion) Forecast, by Application 2019 & 2032
- Table 30: Belgium Thermal Power Industry Volume (Megawatt) Forecast, by Application 2019 & 2032
- Table 31: Netherland Thermal Power Industry Revenue (USD Billion) Forecast, by Application 2019 & 2032
- Table 32: Netherland Thermal Power Industry Volume (Megawatt) Forecast, by Application 2019 & 2032
- Table 33: Nordics Thermal Power Industry Revenue (USD Billion) Forecast, by Application 2019 & 2032
- Table 34: Nordics Thermal Power Industry Volume (Megawatt) Forecast, by Application 2019 & 2032
- Table 35: Rest of Europe Thermal Power Industry Revenue (USD Billion) Forecast, by Application 2019 & 2032
- Table 36: Rest of Europe Thermal Power Industry Volume (Megawatt) Forecast, by Application 2019 & 2032
- Table 37: Global Thermal Power Industry Revenue USD Billion Forecast, by Country 2019 & 2032
- Table 38: Global Thermal Power Industry Volume Megawatt Forecast, by Country 2019 & 2032
- Table 39: China Thermal Power Industry Revenue (USD Billion) Forecast, by Application 2019 & 2032
- Table 40: China Thermal Power Industry Volume (Megawatt) Forecast, by Application 2019 & 2032
- Table 41: Japan Thermal Power Industry Revenue (USD Billion) Forecast, by Application 2019 & 2032
- Table 42: Japan Thermal Power Industry Volume (Megawatt) Forecast, by Application 2019 & 2032
- Table 43: India Thermal Power Industry Revenue (USD Billion) Forecast, by Application 2019 & 2032
- Table 44: India Thermal Power Industry Volume (Megawatt) Forecast, by Application 2019 & 2032
- Table 45: South Korea Thermal Power Industry Revenue (USD Billion) Forecast, by Application 2019 & 2032
- Table 46: South Korea Thermal Power Industry Volume (Megawatt) Forecast, by Application 2019 & 2032
- Table 47: Southeast Asia Thermal Power Industry Revenue (USD Billion) Forecast, by Application 2019 & 2032
- Table 48: Southeast Asia Thermal Power Industry Volume (Megawatt) Forecast, by Application 2019 & 2032
- Table 49: Australia Thermal Power Industry Revenue (USD Billion) Forecast, by Application 2019 & 2032
- Table 50: Australia Thermal Power Industry Volume (Megawatt) Forecast, by Application 2019 & 2032
- Table 51: Indonesia Thermal Power Industry Revenue (USD Billion) Forecast, by Application 2019 & 2032
- Table 52: Indonesia Thermal Power Industry Volume (Megawatt) Forecast, by Application 2019 & 2032
- Table 53: Phillipes Thermal Power Industry Revenue (USD Billion) Forecast, by Application 2019 & 2032
- Table 54: Phillipes Thermal Power Industry Volume (Megawatt) Forecast, by Application 2019 & 2032
- Table 55: Singapore Thermal Power Industry Revenue (USD Billion) Forecast, by Application 2019 & 2032
- Table 56: Singapore Thermal Power Industry Volume (Megawatt) Forecast, by Application 2019 & 2032
- Table 57: Thailandc Thermal Power Industry Revenue (USD Billion) Forecast, by Application 2019 & 2032
- Table 58: Thailandc Thermal Power Industry Volume (Megawatt) Forecast, by Application 2019 & 2032
- Table 59: Rest of Asia Pacific Thermal Power Industry Revenue (USD Billion) Forecast, by Application 2019 & 2032
- Table 60: Rest of Asia Pacific Thermal Power Industry Volume (Megawatt) Forecast, by Application 2019 & 2032
- Table 61: Global Thermal Power Industry Revenue USD Billion Forecast, by Country 2019 & 2032
- Table 62: Global Thermal Power Industry Volume Megawatt Forecast, by Country 2019 & 2032
- Table 63: Brazil Thermal Power Industry Revenue (USD Billion) Forecast, by Application 2019 & 2032
- Table 64: Brazil Thermal Power Industry Volume (Megawatt) Forecast, by Application 2019 & 2032
- Table 65: Argentina Thermal Power Industry Revenue (USD Billion) Forecast, by Application 2019 & 2032
- Table 66: Argentina Thermal Power Industry Volume (Megawatt) Forecast, by Application 2019 & 2032
- Table 67: Peru Thermal Power Industry Revenue (USD Billion) Forecast, by Application 2019 & 2032
- Table 68: Peru Thermal Power Industry Volume (Megawatt) Forecast, by Application 2019 & 2032
- Table 69: Chile Thermal Power Industry Revenue (USD Billion) Forecast, by Application 2019 & 2032
- Table 70: Chile Thermal Power Industry Volume (Megawatt) Forecast, by Application 2019 & 2032
- Table 71: Colombia Thermal Power Industry Revenue (USD Billion) Forecast, by Application 2019 & 2032
- Table 72: Colombia Thermal Power Industry Volume (Megawatt) Forecast, by Application 2019 & 2032
- Table 73: Ecuador Thermal Power Industry Revenue (USD Billion) Forecast, by Application 2019 & 2032
- Table 74: Ecuador Thermal Power Industry Volume (Megawatt) Forecast, by Application 2019 & 2032
- Table 75: Venezuela Thermal Power Industry Revenue (USD Billion) Forecast, by Application 2019 & 2032
- Table 76: Venezuela Thermal Power Industry Volume (Megawatt) Forecast, by Application 2019 & 2032
- Table 77: Rest of South America Thermal Power Industry Revenue (USD Billion) Forecast, by Application 2019 & 2032
- Table 78: Rest of South America Thermal Power Industry Volume (Megawatt) Forecast, by Application 2019 & 2032
- Table 79: Global Thermal Power Industry Revenue USD Billion Forecast, by Country 2019 & 2032
- Table 80: Global Thermal Power Industry Volume Megawatt Forecast, by Country 2019 & 2032
- Table 81: United States Thermal Power Industry Revenue (USD Billion) Forecast, by Application 2019 & 2032
- Table 82: United States Thermal Power Industry Volume (Megawatt) Forecast, by Application 2019 & 2032
- Table 83: Canada Thermal Power Industry Revenue (USD Billion) Forecast, by Application 2019 & 2032
- Table 84: Canada Thermal Power Industry Volume (Megawatt) Forecast, by Application 2019 & 2032
- Table 85: Mexico Thermal Power Industry Revenue (USD Billion) Forecast, by Application 2019 & 2032
- Table 86: Mexico Thermal Power Industry Volume (Megawatt) Forecast, by Application 2019 & 2032
- Table 87: Global Thermal Power Industry Revenue USD Billion Forecast, by Country 2019 & 2032
- Table 88: Global Thermal Power Industry Volume Megawatt Forecast, by Country 2019 & 2032
- Table 89: United Arab Emirates Thermal Power Industry Revenue (USD Billion) Forecast, by Application 2019 & 2032
- Table 90: United Arab Emirates Thermal Power Industry Volume (Megawatt) Forecast, by Application 2019 & 2032
- Table 91: Saudi Arabia Thermal Power Industry Revenue (USD Billion) Forecast, by Application 2019 & 2032
- Table 92: Saudi Arabia Thermal Power Industry Volume (Megawatt) Forecast, by Application 2019 & 2032
- Table 93: South Africa Thermal Power Industry Revenue (USD Billion) Forecast, by Application 2019 & 2032
- Table 94: South Africa Thermal Power Industry Volume (Megawatt) Forecast, by Application 2019 & 2032
- Table 95: Rest of Middle East and Africa Thermal Power Industry Revenue (USD Billion) Forecast, by Application 2019 & 2032
- Table 96: Rest of Middle East and Africa Thermal Power Industry Volume (Megawatt) Forecast, by Application 2019 & 2032
- Table 97: Global Thermal Power Industry Revenue USD Billion Forecast, by Fuel Type 2019 & 2032
- Table 98: Global Thermal Power Industry Volume Megawatt Forecast, by Fuel Type 2019 & 2032
- Table 99: Global Thermal Power Industry Revenue USD Billion Forecast, by Country 2019 & 2032
- Table 100: Global Thermal Power Industry Volume Megawatt Forecast, by Country 2019 & 2032
- Table 101: Global Thermal Power Industry Revenue USD Billion Forecast, by Fuel Type 2019 & 2032
- Table 102: Global Thermal Power Industry Volume Megawatt Forecast, by Fuel Type 2019 & 2032
- Table 103: Global Thermal Power Industry Revenue USD Billion Forecast, by Country 2019 & 2032
- Table 104: Global Thermal Power Industry Volume Megawatt Forecast, by Country 2019 & 2032
- Table 105: Global Thermal Power Industry Revenue USD Billion Forecast, by Fuel Type 2019 & 2032
- Table 106: Global Thermal Power Industry Volume Megawatt Forecast, by Fuel Type 2019 & 2032
- Table 107: Global Thermal Power Industry Revenue USD Billion Forecast, by Country 2019 & 2032
- Table 108: Global Thermal Power Industry Volume Megawatt Forecast, by Country 2019 & 2032
- Table 109: Global Thermal Power Industry Revenue USD Billion Forecast, by Fuel Type 2019 & 2032
- Table 110: Global Thermal Power Industry Volume Megawatt Forecast, by Fuel Type 2019 & 2032
- Table 111: Global Thermal Power Industry Revenue USD Billion Forecast, by Country 2019 & 2032
- Table 112: Global Thermal Power Industry Volume Megawatt Forecast, by Country 2019 & 2032
- Table 113: Global Thermal Power Industry Revenue USD Billion Forecast, by Fuel Type 2019 & 2032
- Table 114: Global Thermal Power Industry Volume Megawatt Forecast, by Fuel Type 2019 & 2032
- Table 115: Global Thermal Power Industry Revenue USD Billion Forecast, by Country 2019 & 2032
- Table 116: Global Thermal Power Industry Volume Megawatt Forecast, by Country 2019 & 2032
Frequently Asked Questions
1. What is the projected Compound Annual Growth Rate (CAGR) of the Thermal Power Industry?
The projected CAGR is approximately 3%.
2. Which companies are prominent players in the Thermal Power Industry?
Key companies in the market include Iberdrola S A, Electricite de France S A, Siemens AG, Tokyo Electric Power Company*List Not Exhaustive, ENGIE, National Thermal Power Corporation Limited, General Electric Company, Chubu Electric Power Co Inc, ABB , Bharat Heavy Electricals Limited (BHEL).
3. What are the main segments of the Thermal Power Industry?
The market segments include Fuel Type.
4. Can you provide details about the market size?
The market size is estimated to be USD 1,475.40 USD Billion as of 2022.
5. What are some drivers contributing to market growth?
4.; Increasing investment in the Midstream Sector4.; Increasing Production of Oil and Natural Gas.
6. What are the notable trends driving market growth?
Natural Gas Power Plants to Witness Significant Growth.
7. Are there any restraints impacting market growth?
4.; Inadequate Infrastructure in the Country.
8. Can you provide examples of recent developments in the market?
The development of new, more efficient thermal power technologies
9. What pricing options are available for accessing the report?
Pricing options include single-user, multi-user, and enterprise licenses priced at USD 4750, USD 5250, and USD 8750 respectively.
10. Is the market size provided in terms of value or volume?
The market size is provided in terms of value, measured in USD Billion and volume, measured in Megawatt.
11. Are there any specific market keywords associated with the report?
Yes, the market keyword associated with the report is "Thermal Power Industry," which aids in identifying and referencing the specific market segment covered.
12. How do I determine which pricing option suits my needs best?
The pricing options vary based on user requirements and access needs. Individual users may opt for single-user licenses, while businesses requiring broader access may choose multi-user or enterprise licenses for cost-effective access to the report.
13. Are there any additional resources or data provided in the Thermal Power Industry report?
While the report offers comprehensive insights, it's advisable to review the specific contents or supplementary materials provided to ascertain if additional resources or data are available.
14. How can I stay updated on further developments or reports in the Thermal Power Industry?
To stay informed about further developments, trends, and reports in the Thermal Power Industry, consider subscribing to industry newsletters, following relevant companies and organizations, or regularly checking reputable industry news sources and publications.
Methodology
Step 1 - Identification of Relevant Samples Size from Population Database


Step 2 - Approaches for Defining Global Market Size (Value, Volume* & Price*)

Note*: In applicable scenarios
Step 3 - Data Sources
Primary Research
- Web Analytics
- Survey Reports
- Research Institute
- Latest Research Reports
- Opinion Leaders
Secondary Research
- Annual Reports
- White Paper
- Latest Press Release
- Industry Association
- Paid Database
- Investor Presentations

Step 4 - Data Triangulation
Involves using different sources of information in order to increase the validity of a study
These sources are likely to be stakeholders in a program - participants, other researchers, program staff, other community members, and so on.
Then we put all data in single framework & apply various statistical tools to find out the dynamic on the market.
During the analysis stage, feedback from the stakeholder groups would be compared to determine areas of agreement as well as areas of divergence


