
Key Insights
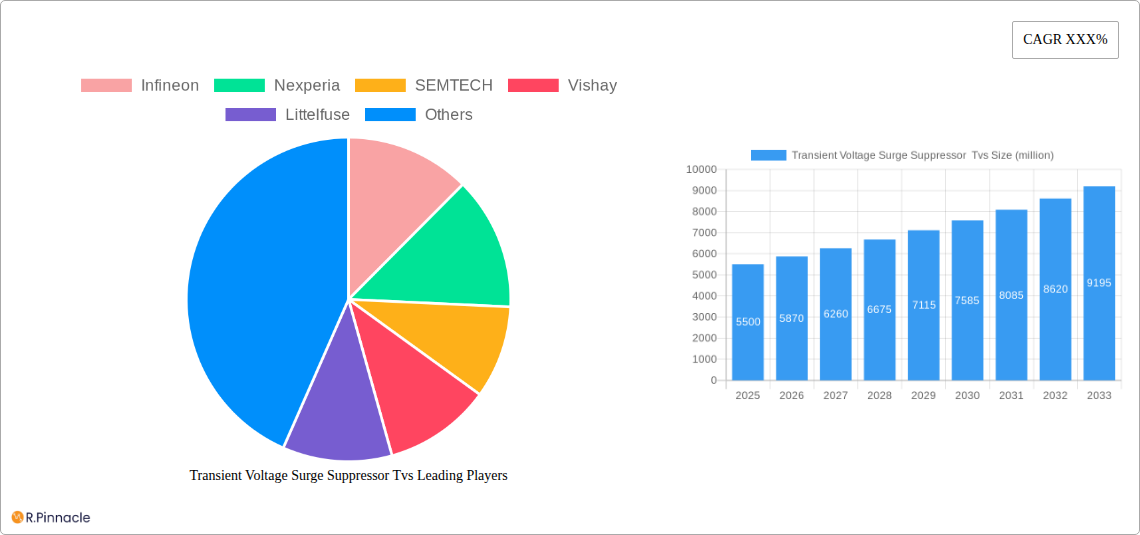
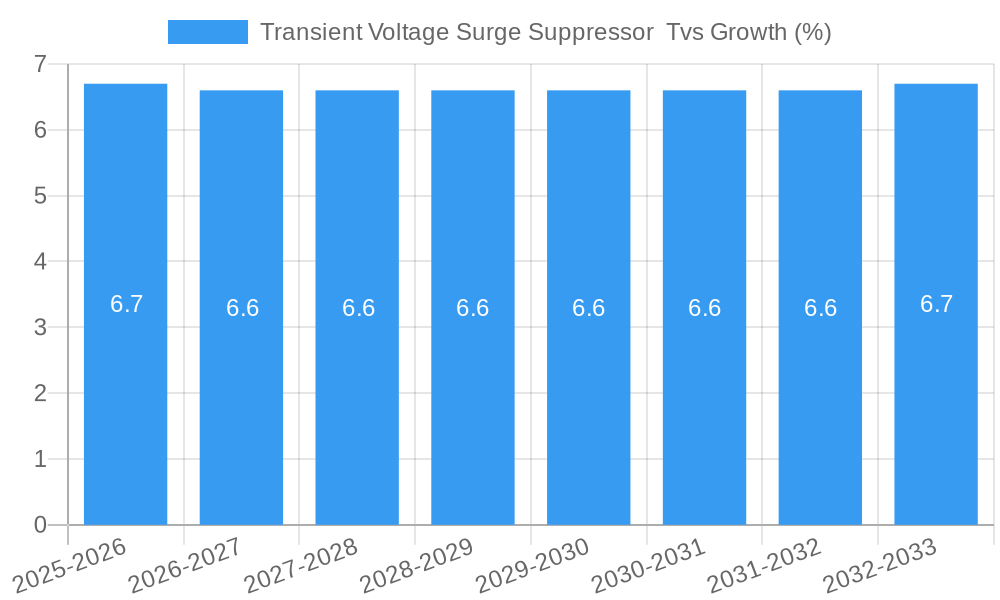
The global Transient Voltage Surge Suppressor (TVS) diode market is experiencing robust expansion, projected to reach approximately \$5.5 billion by 2025, with a Compound Annual Growth Rate (CAGR) of around 6.5% anticipated throughout the forecast period from 2025 to 2033. This growth is fueled by an escalating demand for advanced surge protection across a multitude of critical sectors. The automotive industry, driven by the increasing electrification and adoption of sophisticated electronic control units (ECUs) for advanced driver-assistance systems (ADAS) and infotainment, represents a significant driver. Similarly, the energy sector's expansion, particularly in renewable energy infrastructure requiring robust protection against transient overvoltages, further bolsters market dynamics. The industrial sector, with its growing automation and reliance on sensitive electronic equipment, alongside the telecommunications industry's continuous evolution towards higher bandwidth and more complex networks, also contributes substantially to this upward trajectory. The proliferation of IoT devices and the need for reliable power management in these connected ecosystems are also key enablers of market growth.
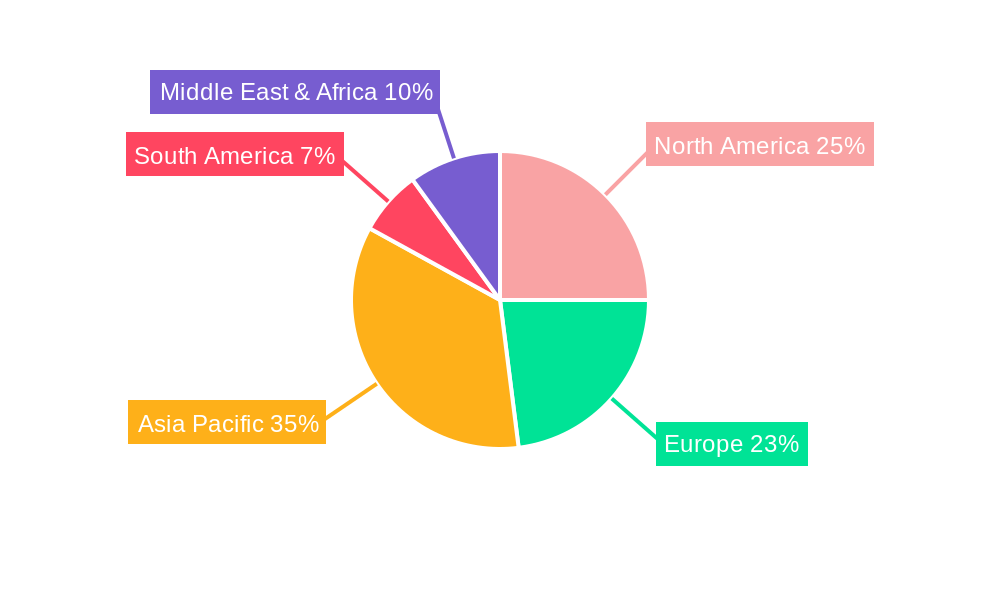
The market is characterized by a diverse range of applications, with the Automobile and Industrial segments holding substantial market shares due to the critical need for robust surge protection. Telecommunications and Energy sectors are also key contributors, reflecting the increasing reliance on sensitive electronics in these domains. Within the type segment, both Unipolar and Bipolar TVS diodes cater to specific protection needs, with advancements in semiconductor technology leading to smaller, more efficient, and higher-performance devices. Geographically, Asia Pacific, led by China and India, is emerging as the fastest-growing region, driven by its expanding manufacturing base and rapid adoption of advanced electronics across all key application sectors. North America and Europe remain mature yet significant markets, owing to the strong presence of established automotive manufacturers, advanced industrial operations, and sophisticated telecommunications infrastructure. The competitive landscape is dynamic, featuring established players like Infineon, Nexperia, SEMTECH, Vishay, and Littelfuse, alongside emerging innovators, all vying for market share through product development and strategic partnerships. Restraints include the price sensitivity in certain consumer electronics segments and potential supply chain disruptions, though the overall outlook remains highly positive.
This comprehensive report provides an in-depth analysis of the global Transient Voltage Surge Suppressor (TVS) market, offering valuable insights for industry professionals, investors, and stakeholders. Covering a detailed study period from 2019 to 2033, with a base year of 2025 and a forecast period extending to 2033, this report examines market structure, dynamics, regional dominance, product innovations, and key growth drivers. With a focus on high-ranking SEO keywords and actionable data, this report is designed to boost search visibility and engagement.
Transient Voltage Surge Suppressor Tvs Market Structure & Innovation Trends
The Transient Voltage Surge Suppressor (TVS) market exhibits a moderately consolidated structure, with a few key players holding significant market share, estimated to be around 65% for the top 5 companies. Innovation is a critical driver, fueled by the increasing demand for robust protection against transient voltage surges across a myriad of electronic applications. Regulatory frameworks, particularly concerning electromagnetic compatibility (EMC) and safety standards in sectors like automotive and industrial electronics, are becoming more stringent, compelling manufacturers to invest heavily in R&D for advanced TVS solutions. Product substitutes, such as Metal Oxide Varistors (MOVs) and Zener diodes, offer varying levels of protection and cost-effectiveness, influencing market segmentation. End-user demographics are expanding from traditional industrial and telecommunications sectors to burgeoning applications in the automotive (EVs, ADAS), energy (renewable energy systems, smart grids), and consumer electronics industries. Mergers and acquisitions (M&A) activities are observed, with notable deals in the historical period amounting to an estimated value of over $500 million, aimed at consolidating market presence, acquiring new technologies, and expanding product portfolios. The overall market concentration is expected to remain moderate, with continuous innovation and strategic partnerships shaping the competitive landscape.
Transient Voltage Surge Suppressor Tvs Market Dynamics & Trends
The global Transient Voltage Surge Suppressor (TVS) market is experiencing robust growth, propelled by escalating demand for electronic device reliability and protection against damaging voltage transients. The compound annual growth rate (CAGR) for the forecast period (2025–2033) is projected to be around 7.5%. This growth is fundamentally driven by the ubiquitous integration of sensitive electronic components across various industries, from advanced automotive systems and industrial automation to sophisticated telecommunications infrastructure and renewable energy grids. Technological advancements are continuously pushing the boundaries of TVS performance, enabling smaller form factors, higher power handling capabilities, faster response times, and improved clamping voltages. Key trends include the development of bidirectional TVS diodes for AC applications, low-capacitance TVS for high-speed data lines, and TVS arrays for comprehensive protection of complex integrated circuits. Consumer preferences are increasingly leaning towards highly reliable and durable electronic products, which directly translates to a higher demand for effective surge protection. The competitive dynamics are intense, with established players and emerging manufacturers vying for market share through product differentiation, cost optimization, and strategic collaborations. Market penetration is significant in developed economies and is rapidly expanding in emerging markets due to increased industrialization and the adoption of advanced technologies. The ongoing miniaturization of electronic devices also necessitates smaller and more efficient surge protection solutions, creating opportunities for innovation in packaging and material science. Furthermore, the growing adoption of electric vehicles (EVs), autonomous driving technologies, and the expansion of 5G networks are significant catalysts for increased TVS market penetration, as these applications are highly susceptible to voltage fluctuations and require robust protection to ensure operational integrity and safety. The increasing prevalence of smart home devices and the Internet of Things (IoT) ecosystem also contribute to this upward trajectory, as each connected device represents a potential point of failure without adequate surge suppression. The energy sector's transition towards renewable sources, such as solar and wind power, also introduces new challenges and opportunities for TVS solutions, given the inherent variability of power generation and the need to protect sensitive grid-tied inverters and associated electronics.
Dominant Regions & Segments in Transient Voltage Surge Suppressor Tvs
The Automobile application segment is emerging as a dominant force in the Transient Voltage Surge Suppressor (TVS) market, projected to capture a market share of approximately 30% by 2033. This surge is driven by the exponential growth of electric vehicles (EVs), advanced driver-assistance systems (ADAS), and the increasing complexity of automotive electronics. Stringent safety regulations and the demand for enhanced vehicle reliability are paramount. North America and Europe are leading regions for automotive TVS adoption due to their advanced automotive industries and aggressive targets for EV production.
- Key Drivers in Automobile Segment:
- Rapid adoption of electric vehicles and hybrid powertrains.
- Increasing implementation of ADAS and autonomous driving technologies.
- Growing number of ECUs (Electronic Control Units) per vehicle.
- Stringent automotive safety and EMC standards.
The Industrial segment remains a strong contender, historically a significant market for TVS devices due to the critical need for protection in automation, manufacturing, and control systems. Industrial applications require robust and reliable surge protection to prevent costly downtime and equipment damage. Asia-Pacific, particularly China, is a major hub for industrial manufacturing, contributing significantly to this segment's demand.
- Key Drivers in Industrial Segment:
- Growth in industrial automation and smart factory initiatives.
- Demand for reliable operation of critical infrastructure.
- Increased adoption of variable frequency drives (VFDs) and power electronics.
In terms of Type, Bipolar TVS devices are expected to maintain a leading position, driven by their versatility in protecting AC and bidirectional DC circuits, which are prevalent in a wide range of industrial and automotive applications. Unipolar TVS devices will continue to be crucial for specific DC applications, especially in telecommunications and consumer electronics.
- Key Drivers for Bipolar TVS Dominance:
- Suitability for AC power lines and bidirectional DC circuits.
- Prevalence in power supply units and industrial control systems.
The Telecommunications segment is also a significant market, fueled by the ongoing deployment of 5G networks, data centers, and the expansion of fiber optic infrastructure, all of which require robust protection against transient overvoltages. Asia-Pacific, with its massive investments in telecom infrastructure, is a key region for this segment.
- Key Drivers in Telecommunications Segment:
- 5G network deployment and expansion.
- Growth of cloud computing and data centers.
- Increased demand for high-speed data transmission.
The Energy sector, encompassing renewable energy systems (solar, wind) and smart grid technologies, presents substantial growth opportunities for TVS. The inherent variability of renewable energy sources and the need to protect sensitive grid-tied components make TVS indispensable.
- Key Drivers in Energy Segment:
- Expansion of renewable energy sources and grid integration.
- Development of smart grid technologies.
- Protection of power converters and inverters.
Transient Voltage Surge Suppressor Tvs Product Innovations
Product innovations in the TVS market are focused on enhancing performance, miniaturization, and specialized functionalities. Manufacturers are developing ultra-low capacitance TVS diodes for high-speed data lines, enabling signal integrity in advanced communication systems. Innovations in materials science and packaging are leading to TVS devices with higher surge current ratings in smaller footprints, crucial for space-constrained applications like smartphones and wearable electronics. The development of transient voltage suppressors with integrated functionalities, such as ESD protection and EMI filtering, also offers significant competitive advantages, simplifying circuit design and reducing bill of materials for end products.
Report Scope & Segmentation Analysis
This report provides a detailed segmentation of the Transient Voltage Surge Suppressor (TVS) market across key categories. The Application segment includes Automobile, Industrial, Energy, Aviation, Telecommunications, and Other applications. The Type segment is divided into Unipolar TVS and Bipolar TVS. Market sizes and growth projections are analyzed for each segment, considering their unique demand drivers and competitive landscapes. For instance, the Automobile segment is projected to experience a CAGR of approximately 9.2% due to the rapid electrification and advancement of vehicle technologies, while the Industrial segment is expected to grow at around 6.8% driven by automation and smart manufacturing trends.
Key Drivers of Transient Voltage Surge Suppressor Tvs Growth
The growth of the Transient Voltage Surge Suppressor (TVS) market is significantly propelled by the increasing integration of sophisticated electronic components across diverse industries. The burgeoning adoption of electric vehicles (EVs) and advanced driver-assistance systems (ADAS) in the automotive sector, coupled with stringent safety regulations, is a primary growth catalyst. The expansion of 5G infrastructure and data centers fuels demand in the telecommunications segment. Furthermore, the global push towards renewable energy sources and the development of smart grids necessitate robust protection for energy infrastructure, creating substantial opportunities. Technological advancements, leading to more efficient, smaller, and higher-performance TVS devices, also contribute to market expansion.
Challenges in the Transient Voltage Surge Suppressor Tvs Sector
Despite robust growth, the TVS sector faces several challenges. Intense price competition, particularly from manufacturers in low-cost regions, can impact profit margins. Supply chain disruptions, exacerbated by global events and semiconductor shortages, can affect production and lead times, as experienced in recent years. Evolving regulatory landscapes and the need for continuous compliance with international standards also pose challenges for manufacturers. The development of effective and cost-efficient surge protection for increasingly complex and miniaturized electronic devices requires ongoing R&D investment, which can be a barrier for smaller companies.
Emerging Opportunities in Transient Voltage Surge Suppressor Tvs
Emerging opportunities in the TVS market are abundant, driven by innovation and new application frontiers. The expansion of the Internet of Things (IoT) ecosystem, with billions of connected devices, presents a massive opportunity for tailored TVS solutions. The increasing adoption of electric vertical take-off and landing (eVTOL) aircraft and the growth in the aerospace sector demand highly reliable and compact surge protection. Furthermore, advancements in power electronics for industrial applications and the continued evolution of smart home technologies are creating new market niches for specialized TVS devices.
Leading Players in the Transient Voltage Surge Suppressor Tvs Market
- Infineon
- Nexperia
- SEMTECH
- Vishay
- Littelfuse
- BrightKing
- Amazing
- STMicroelectronics
- ON Semiconductor
- WAYON
- Diodes Inc.
- Bourns
- LAN technology
- ANOVA
- MDE
- TOSHIBA
- UN Semiconductor
- PROTEK
- INPAQ
- EIC
- SOCAY
- SG Micro Corp
Key Developments in Transient Voltage Surge Suppressor Tvs Industry
- 2023/06: Littelfuse introduces a new series of automotive-grade TVS diodes for enhanced protection in EV powertrains.
- 2023/04: Nexperia expands its portfolio of low-capacitance TVS diodes for high-speed data interfaces.
- 2022/11: SEMTECH announces advancements in TVS technology for 5G infrastructure and data centers.
- 2022/08: Vishay launches AEC-Q101 qualified TVS diodes for demanding automotive applications.
- 2022/02: STMicroelectronics enhances its TVS product line to meet the growing needs of industrial automation.
Future Outlook for Transient Voltage Surge Suppressor Tvs Market
The future outlook for the Transient Voltage Surge Suppressor (TVS) market is exceptionally positive, with sustained growth anticipated due to ongoing technological advancements and expanding application landscapes. The increasing complexity and sensitivity of electronic devices across automotive, industrial, energy, and telecommunications sectors will continue to drive demand for reliable surge protection. Emerging technologies like AI, advanced robotics, and the further proliferation of IoT devices will create new markets and necessitate innovative TVS solutions. Strategic partnerships, product diversification, and a focus on high-performance, miniaturized solutions will be key for players to capitalize on future market potential and maintain competitive advantages. The industry's ability to adapt to evolving regulatory standards and address supply chain vulnerabilities will also be critical for long-term success.
Transient Voltage Surge Suppressor Tvs Segmentation
-
1. Application
- 1.1. Automobile
- 1.2. Industrial
- 1.3. Energy
- 1.4. Aviation
- 1.5. Telecommunications
- 1.6. Other
-
2. Type
- 2.1. Unipolar TVS
- 2.2. Bipolar TVS
Transient Voltage Surge Suppressor Tvs Segmentation By Geography
-
1. North America
- 1.1. United States
- 1.2. Canada
- 1.3. Mexico
-
2. South America
- 2.1. Brazil
- 2.2. Argentina
- 2.3. Rest of South America
-
3. Europe
- 3.1. United Kingdom
- 3.2. Germany
- 3.3. France
- 3.4. Italy
- 3.5. Spain
- 3.6. Russia
- 3.7. Benelux
- 3.8. Nordics
- 3.9. Rest of Europe
-
4. Middle East & Africa
- 4.1. Turkey
- 4.2. Israel
- 4.3. GCC
- 4.4. North Africa
- 4.5. South Africa
- 4.6. Rest of Middle East & Africa
-
5. Asia Pacific
- 5.1. China
- 5.2. India
- 5.3. Japan
- 5.4. South Korea
- 5.5. ASEAN
- 5.6. Oceania
- 5.7. Rest of Asia Pacific
Transient Voltage Surge Suppressor Tvs REPORT HIGHLIGHTS
| Aspects | Details |
|---|---|
| Study Period | 2019-2033 |
| Base Year | 2024 |
| Estimated Year | 2025 |
| Forecast Period | 2025-2033 |
| Historical Period | 2019-2024 |
| Growth Rate | CAGR of XXX% from 2019-2033 |
| Segmentation |
|
Table of Contents
- 1. Introduction
- 1.1. Research Scope
- 1.2. Market Segmentation
- 1.3. Research Methodology
- 1.4. Definitions and Assumptions
- 2. Executive Summary
- 2.1. Introduction
- 3. Market Dynamics
- 3.1. Introduction
- 3.2. Market Drivers
- 3.3. Market Restrains
- 3.4. Market Trends
- 4. Market Factor Analysis
- 4.1. Porters Five Forces
- 4.2. Supply/Value Chain
- 4.3. PESTEL analysis
- 4.4. Market Entropy
- 4.5. Patent/Trademark Analysis
- 5. Global Transient Voltage Surge Suppressor Tvs Analysis, Insights and Forecast, 2019-2031
- 5.1. Market Analysis, Insights and Forecast - by Application
- 5.1.1. Automobile
- 5.1.2. Industrial
- 5.1.3. Energy
- 5.1.4. Aviation
- 5.1.5. Telecommunications
- 5.1.6. Other
- 5.2. Market Analysis, Insights and Forecast - by Type
- 5.2.1. Unipolar TVS
- 5.2.2. Bipolar TVS
- 5.3. Market Analysis, Insights and Forecast - by Region
- 5.3.1. North America
- 5.3.2. South America
- 5.3.3. Europe
- 5.3.4. Middle East & Africa
- 5.3.5. Asia Pacific
- 5.1. Market Analysis, Insights and Forecast - by Application
- 6. North America Transient Voltage Surge Suppressor Tvs Analysis, Insights and Forecast, 2019-2031
- 6.1. Market Analysis, Insights and Forecast - by Application
- 6.1.1. Automobile
- 6.1.2. Industrial
- 6.1.3. Energy
- 6.1.4. Aviation
- 6.1.5. Telecommunications
- 6.1.6. Other
- 6.2. Market Analysis, Insights and Forecast - by Type
- 6.2.1. Unipolar TVS
- 6.2.2. Bipolar TVS
- 6.1. Market Analysis, Insights and Forecast - by Application
- 7. South America Transient Voltage Surge Suppressor Tvs Analysis, Insights and Forecast, 2019-2031
- 7.1. Market Analysis, Insights and Forecast - by Application
- 7.1.1. Automobile
- 7.1.2. Industrial
- 7.1.3. Energy
- 7.1.4. Aviation
- 7.1.5. Telecommunications
- 7.1.6. Other
- 7.2. Market Analysis, Insights and Forecast - by Type
- 7.2.1. Unipolar TVS
- 7.2.2. Bipolar TVS
- 7.1. Market Analysis, Insights and Forecast - by Application
- 8. Europe Transient Voltage Surge Suppressor Tvs Analysis, Insights and Forecast, 2019-2031
- 8.1. Market Analysis, Insights and Forecast - by Application
- 8.1.1. Automobile
- 8.1.2. Industrial
- 8.1.3. Energy
- 8.1.4. Aviation
- 8.1.5. Telecommunications
- 8.1.6. Other
- 8.2. Market Analysis, Insights and Forecast - by Type
- 8.2.1. Unipolar TVS
- 8.2.2. Bipolar TVS
- 8.1. Market Analysis, Insights and Forecast - by Application
- 9. Middle East & Africa Transient Voltage Surge Suppressor Tvs Analysis, Insights and Forecast, 2019-2031
- 9.1. Market Analysis, Insights and Forecast - by Application
- 9.1.1. Automobile
- 9.1.2. Industrial
- 9.1.3. Energy
- 9.1.4. Aviation
- 9.1.5. Telecommunications
- 9.1.6. Other
- 9.2. Market Analysis, Insights and Forecast - by Type
- 9.2.1. Unipolar TVS
- 9.2.2. Bipolar TVS
- 9.1. Market Analysis, Insights and Forecast - by Application
- 10. Asia Pacific Transient Voltage Surge Suppressor Tvs Analysis, Insights and Forecast, 2019-2031
- 10.1. Market Analysis, Insights and Forecast - by Application
- 10.1.1. Automobile
- 10.1.2. Industrial
- 10.1.3. Energy
- 10.1.4. Aviation
- 10.1.5. Telecommunications
- 10.1.6. Other
- 10.2. Market Analysis, Insights and Forecast - by Type
- 10.2.1. Unipolar TVS
- 10.2.2. Bipolar TVS
- 10.1. Market Analysis, Insights and Forecast - by Application
- 11. Competitive Analysis
- 11.1. Global Market Share Analysis 2024
- 11.2. Company Profiles
- 11.2.1 Infineon
- 11.2.1.1. Overview
- 11.2.1.2. Products
- 11.2.1.3. SWOT Analysis
- 11.2.1.4. Recent Developments
- 11.2.1.5. Financials (Based on Availability)
- 11.2.2 Nexperia
- 11.2.2.1. Overview
- 11.2.2.2. Products
- 11.2.2.3. SWOT Analysis
- 11.2.2.4. Recent Developments
- 11.2.2.5. Financials (Based on Availability)
- 11.2.3 SEMTECH
- 11.2.3.1. Overview
- 11.2.3.2. Products
- 11.2.3.3. SWOT Analysis
- 11.2.3.4. Recent Developments
- 11.2.3.5. Financials (Based on Availability)
- 11.2.4 Vishay
- 11.2.4.1. Overview
- 11.2.4.2. Products
- 11.2.4.3. SWOT Analysis
- 11.2.4.4. Recent Developments
- 11.2.4.5. Financials (Based on Availability)
- 11.2.5 Littelfuse
- 11.2.5.1. Overview
- 11.2.5.2. Products
- 11.2.5.3. SWOT Analysis
- 11.2.5.4. Recent Developments
- 11.2.5.5. Financials (Based on Availability)
- 11.2.6 BrightKing
- 11.2.6.1. Overview
- 11.2.6.2. Products
- 11.2.6.3. SWOT Analysis
- 11.2.6.4. Recent Developments
- 11.2.6.5. Financials (Based on Availability)
- 11.2.7 Amazing
- 11.2.7.1. Overview
- 11.2.7.2. Products
- 11.2.7.3. SWOT Analysis
- 11.2.7.4. Recent Developments
- 11.2.7.5. Financials (Based on Availability)
- 11.2.8 STMicroelectronics
- 11.2.8.1. Overview
- 11.2.8.2. Products
- 11.2.8.3. SWOT Analysis
- 11.2.8.4. Recent Developments
- 11.2.8.5. Financials (Based on Availability)
- 11.2.9 ON Semiconductor
- 11.2.9.1. Overview
- 11.2.9.2. Products
- 11.2.9.3. SWOT Analysis
- 11.2.9.4. Recent Developments
- 11.2.9.5. Financials (Based on Availability)
- 11.2.10 WAYON
- 11.2.10.1. Overview
- 11.2.10.2. Products
- 11.2.10.3. SWOT Analysis
- 11.2.10.4. Recent Developments
- 11.2.10.5. Financials (Based on Availability)
- 11.2.11 Diodes Inc.
- 11.2.11.1. Overview
- 11.2.11.2. Products
- 11.2.11.3. SWOT Analysis
- 11.2.11.4. Recent Developments
- 11.2.11.5. Financials (Based on Availability)
- 11.2.12 Bourns
- 11.2.12.1. Overview
- 11.2.12.2. Products
- 11.2.12.3. SWOT Analysis
- 11.2.12.4. Recent Developments
- 11.2.12.5. Financials (Based on Availability)
- 11.2.13 LAN technology
- 11.2.13.1. Overview
- 11.2.13.2. Products
- 11.2.13.3. SWOT Analysis
- 11.2.13.4. Recent Developments
- 11.2.13.5. Financials (Based on Availability)
- 11.2.14 ANOVA
- 11.2.14.1. Overview
- 11.2.14.2. Products
- 11.2.14.3. SWOT Analysis
- 11.2.14.4. Recent Developments
- 11.2.14.5. Financials (Based on Availability)
- 11.2.15 MDE
- 11.2.15.1. Overview
- 11.2.15.2. Products
- 11.2.15.3. SWOT Analysis
- 11.2.15.4. Recent Developments
- 11.2.15.5. Financials (Based on Availability)
- 11.2.16 TOSHIBA
- 11.2.16.1. Overview
- 11.2.16.2. Products
- 11.2.16.3. SWOT Analysis
- 11.2.16.4. Recent Developments
- 11.2.16.5. Financials (Based on Availability)
- 11.2.17 UN Semiconductor
- 11.2.17.1. Overview
- 11.2.17.2. Products
- 11.2.17.3. SWOT Analysis
- 11.2.17.4. Recent Developments
- 11.2.17.5. Financials (Based on Availability)
- 11.2.18 PROTEK
- 11.2.18.1. Overview
- 11.2.18.2. Products
- 11.2.18.3. SWOT Analysis
- 11.2.18.4. Recent Developments
- 11.2.18.5. Financials (Based on Availability)
- 11.2.19 INPAQ
- 11.2.19.1. Overview
- 11.2.19.2. Products
- 11.2.19.3. SWOT Analysis
- 11.2.19.4. Recent Developments
- 11.2.19.5. Financials (Based on Availability)
- 11.2.20 EIC
- 11.2.20.1. Overview
- 11.2.20.2. Products
- 11.2.20.3. SWOT Analysis
- 11.2.20.4. Recent Developments
- 11.2.20.5. Financials (Based on Availability)
- 11.2.21 SOCAY
- 11.2.21.1. Overview
- 11.2.21.2. Products
- 11.2.21.3. SWOT Analysis
- 11.2.21.4. Recent Developments
- 11.2.21.5. Financials (Based on Availability)
- 11.2.22 SG Micro Corp
- 11.2.22.1. Overview
- 11.2.22.2. Products
- 11.2.22.3. SWOT Analysis
- 11.2.22.4. Recent Developments
- 11.2.22.5. Financials (Based on Availability)
- 11.2.1 Infineon
List of Figures
- Figure 1: Global Transient Voltage Surge Suppressor Tvs Revenue Breakdown (million, %) by Region 2024 & 2032
- Figure 2: Global Transient Voltage Surge Suppressor Tvs Volume Breakdown (K, %) by Region 2024 & 2032
- Figure 3: North America Transient Voltage Surge Suppressor Tvs Revenue (million), by Application 2024 & 2032
- Figure 4: North America Transient Voltage Surge Suppressor Tvs Volume (K), by Application 2024 & 2032
- Figure 5: North America Transient Voltage Surge Suppressor Tvs Revenue Share (%), by Application 2024 & 2032
- Figure 6: North America Transient Voltage Surge Suppressor Tvs Volume Share (%), by Application 2024 & 2032
- Figure 7: North America Transient Voltage Surge Suppressor Tvs Revenue (million), by Type 2024 & 2032
- Figure 8: North America Transient Voltage Surge Suppressor Tvs Volume (K), by Type 2024 & 2032
- Figure 9: North America Transient Voltage Surge Suppressor Tvs Revenue Share (%), by Type 2024 & 2032
- Figure 10: North America Transient Voltage Surge Suppressor Tvs Volume Share (%), by Type 2024 & 2032
- Figure 11: North America Transient Voltage Surge Suppressor Tvs Revenue (million), by Country 2024 & 2032
- Figure 12: North America Transient Voltage Surge Suppressor Tvs Volume (K), by Country 2024 & 2032
- Figure 13: North America Transient Voltage Surge Suppressor Tvs Revenue Share (%), by Country 2024 & 2032
- Figure 14: North America Transient Voltage Surge Suppressor Tvs Volume Share (%), by Country 2024 & 2032
- Figure 15: South America Transient Voltage Surge Suppressor Tvs Revenue (million), by Application 2024 & 2032
- Figure 16: South America Transient Voltage Surge Suppressor Tvs Volume (K), by Application 2024 & 2032
- Figure 17: South America Transient Voltage Surge Suppressor Tvs Revenue Share (%), by Application 2024 & 2032
- Figure 18: South America Transient Voltage Surge Suppressor Tvs Volume Share (%), by Application 2024 & 2032
- Figure 19: South America Transient Voltage Surge Suppressor Tvs Revenue (million), by Type 2024 & 2032
- Figure 20: South America Transient Voltage Surge Suppressor Tvs Volume (K), by Type 2024 & 2032
- Figure 21: South America Transient Voltage Surge Suppressor Tvs Revenue Share (%), by Type 2024 & 2032
- Figure 22: South America Transient Voltage Surge Suppressor Tvs Volume Share (%), by Type 2024 & 2032
- Figure 23: South America Transient Voltage Surge Suppressor Tvs Revenue (million), by Country 2024 & 2032
- Figure 24: South America Transient Voltage Surge Suppressor Tvs Volume (K), by Country 2024 & 2032
- Figure 25: South America Transient Voltage Surge Suppressor Tvs Revenue Share (%), by Country 2024 & 2032
- Figure 26: South America Transient Voltage Surge Suppressor Tvs Volume Share (%), by Country 2024 & 2032
- Figure 27: Europe Transient Voltage Surge Suppressor Tvs Revenue (million), by Application 2024 & 2032
- Figure 28: Europe Transient Voltage Surge Suppressor Tvs Volume (K), by Application 2024 & 2032
- Figure 29: Europe Transient Voltage Surge Suppressor Tvs Revenue Share (%), by Application 2024 & 2032
- Figure 30: Europe Transient Voltage Surge Suppressor Tvs Volume Share (%), by Application 2024 & 2032
- Figure 31: Europe Transient Voltage Surge Suppressor Tvs Revenue (million), by Type 2024 & 2032
- Figure 32: Europe Transient Voltage Surge Suppressor Tvs Volume (K), by Type 2024 & 2032
- Figure 33: Europe Transient Voltage Surge Suppressor Tvs Revenue Share (%), by Type 2024 & 2032
- Figure 34: Europe Transient Voltage Surge Suppressor Tvs Volume Share (%), by Type 2024 & 2032
- Figure 35: Europe Transient Voltage Surge Suppressor Tvs Revenue (million), by Country 2024 & 2032
- Figure 36: Europe Transient Voltage Surge Suppressor Tvs Volume (K), by Country 2024 & 2032
- Figure 37: Europe Transient Voltage Surge Suppressor Tvs Revenue Share (%), by Country 2024 & 2032
- Figure 38: Europe Transient Voltage Surge Suppressor Tvs Volume Share (%), by Country 2024 & 2032
- Figure 39: Middle East & Africa Transient Voltage Surge Suppressor Tvs Revenue (million), by Application 2024 & 2032
- Figure 40: Middle East & Africa Transient Voltage Surge Suppressor Tvs Volume (K), by Application 2024 & 2032
- Figure 41: Middle East & Africa Transient Voltage Surge Suppressor Tvs Revenue Share (%), by Application 2024 & 2032
- Figure 42: Middle East & Africa Transient Voltage Surge Suppressor Tvs Volume Share (%), by Application 2024 & 2032
- Figure 43: Middle East & Africa Transient Voltage Surge Suppressor Tvs Revenue (million), by Type 2024 & 2032
- Figure 44: Middle East & Africa Transient Voltage Surge Suppressor Tvs Volume (K), by Type 2024 & 2032
- Figure 45: Middle East & Africa Transient Voltage Surge Suppressor Tvs Revenue Share (%), by Type 2024 & 2032
- Figure 46: Middle East & Africa Transient Voltage Surge Suppressor Tvs Volume Share (%), by Type 2024 & 2032
- Figure 47: Middle East & Africa Transient Voltage Surge Suppressor Tvs Revenue (million), by Country 2024 & 2032
- Figure 48: Middle East & Africa Transient Voltage Surge Suppressor Tvs Volume (K), by Country 2024 & 2032
- Figure 49: Middle East & Africa Transient Voltage Surge Suppressor Tvs Revenue Share (%), by Country 2024 & 2032
- Figure 50: Middle East & Africa Transient Voltage Surge Suppressor Tvs Volume Share (%), by Country 2024 & 2032
- Figure 51: Asia Pacific Transient Voltage Surge Suppressor Tvs Revenue (million), by Application 2024 & 2032
- Figure 52: Asia Pacific Transient Voltage Surge Suppressor Tvs Volume (K), by Application 2024 & 2032
- Figure 53: Asia Pacific Transient Voltage Surge Suppressor Tvs Revenue Share (%), by Application 2024 & 2032
- Figure 54: Asia Pacific Transient Voltage Surge Suppressor Tvs Volume Share (%), by Application 2024 & 2032
- Figure 55: Asia Pacific Transient Voltage Surge Suppressor Tvs Revenue (million), by Type 2024 & 2032
- Figure 56: Asia Pacific Transient Voltage Surge Suppressor Tvs Volume (K), by Type 2024 & 2032
- Figure 57: Asia Pacific Transient Voltage Surge Suppressor Tvs Revenue Share (%), by Type 2024 & 2032
- Figure 58: Asia Pacific Transient Voltage Surge Suppressor Tvs Volume Share (%), by Type 2024 & 2032
- Figure 59: Asia Pacific Transient Voltage Surge Suppressor Tvs Revenue (million), by Country 2024 & 2032
- Figure 60: Asia Pacific Transient Voltage Surge Suppressor Tvs Volume (K), by Country 2024 & 2032
- Figure 61: Asia Pacific Transient Voltage Surge Suppressor Tvs Revenue Share (%), by Country 2024 & 2032
- Figure 62: Asia Pacific Transient Voltage Surge Suppressor Tvs Volume Share (%), by Country 2024 & 2032
List of Tables
- Table 1: Global Transient Voltage Surge Suppressor Tvs Revenue million Forecast, by Region 2019 & 2032
- Table 2: Global Transient Voltage Surge Suppressor Tvs Volume K Forecast, by Region 2019 & 2032
- Table 3: Global Transient Voltage Surge Suppressor Tvs Revenue million Forecast, by Application 2019 & 2032
- Table 4: Global Transient Voltage Surge Suppressor Tvs Volume K Forecast, by Application 2019 & 2032
- Table 5: Global Transient Voltage Surge Suppressor Tvs Revenue million Forecast, by Type 2019 & 2032
- Table 6: Global Transient Voltage Surge Suppressor Tvs Volume K Forecast, by Type 2019 & 2032
- Table 7: Global Transient Voltage Surge Suppressor Tvs Revenue million Forecast, by Region 2019 & 2032
- Table 8: Global Transient Voltage Surge Suppressor Tvs Volume K Forecast, by Region 2019 & 2032
- Table 9: Global Transient Voltage Surge Suppressor Tvs Revenue million Forecast, by Application 2019 & 2032
- Table 10: Global Transient Voltage Surge Suppressor Tvs Volume K Forecast, by Application 2019 & 2032
- Table 11: Global Transient Voltage Surge Suppressor Tvs Revenue million Forecast, by Type 2019 & 2032
- Table 12: Global Transient Voltage Surge Suppressor Tvs Volume K Forecast, by Type 2019 & 2032
- Table 13: Global Transient Voltage Surge Suppressor Tvs Revenue million Forecast, by Country 2019 & 2032
- Table 14: Global Transient Voltage Surge Suppressor Tvs Volume K Forecast, by Country 2019 & 2032
- Table 15: United States Transient Voltage Surge Suppressor Tvs Revenue (million) Forecast, by Application 2019 & 2032
- Table 16: United States Transient Voltage Surge Suppressor Tvs Volume (K) Forecast, by Application 2019 & 2032
- Table 17: Canada Transient Voltage Surge Suppressor Tvs Revenue (million) Forecast, by Application 2019 & 2032
- Table 18: Canada Transient Voltage Surge Suppressor Tvs Volume (K) Forecast, by Application 2019 & 2032
- Table 19: Mexico Transient Voltage Surge Suppressor Tvs Revenue (million) Forecast, by Application 2019 & 2032
- Table 20: Mexico Transient Voltage Surge Suppressor Tvs Volume (K) Forecast, by Application 2019 & 2032
- Table 21: Global Transient Voltage Surge Suppressor Tvs Revenue million Forecast, by Application 2019 & 2032
- Table 22: Global Transient Voltage Surge Suppressor Tvs Volume K Forecast, by Application 2019 & 2032
- Table 23: Global Transient Voltage Surge Suppressor Tvs Revenue million Forecast, by Type 2019 & 2032
- Table 24: Global Transient Voltage Surge Suppressor Tvs Volume K Forecast, by Type 2019 & 2032
- Table 25: Global Transient Voltage Surge Suppressor Tvs Revenue million Forecast, by Country 2019 & 2032
- Table 26: Global Transient Voltage Surge Suppressor Tvs Volume K Forecast, by Country 2019 & 2032
- Table 27: Brazil Transient Voltage Surge Suppressor Tvs Revenue (million) Forecast, by Application 2019 & 2032
- Table 28: Brazil Transient Voltage Surge Suppressor Tvs Volume (K) Forecast, by Application 2019 & 2032
- Table 29: Argentina Transient Voltage Surge Suppressor Tvs Revenue (million) Forecast, by Application 2019 & 2032
- Table 30: Argentina Transient Voltage Surge Suppressor Tvs Volume (K) Forecast, by Application 2019 & 2032
- Table 31: Rest of South America Transient Voltage Surge Suppressor Tvs Revenue (million) Forecast, by Application 2019 & 2032
- Table 32: Rest of South America Transient Voltage Surge Suppressor Tvs Volume (K) Forecast, by Application 2019 & 2032
- Table 33: Global Transient Voltage Surge Suppressor Tvs Revenue million Forecast, by Application 2019 & 2032
- Table 34: Global Transient Voltage Surge Suppressor Tvs Volume K Forecast, by Application 2019 & 2032
- Table 35: Global Transient Voltage Surge Suppressor Tvs Revenue million Forecast, by Type 2019 & 2032
- Table 36: Global Transient Voltage Surge Suppressor Tvs Volume K Forecast, by Type 2019 & 2032
- Table 37: Global Transient Voltage Surge Suppressor Tvs Revenue million Forecast, by Country 2019 & 2032
- Table 38: Global Transient Voltage Surge Suppressor Tvs Volume K Forecast, by Country 2019 & 2032
- Table 39: United Kingdom Transient Voltage Surge Suppressor Tvs Revenue (million) Forecast, by Application 2019 & 2032
- Table 40: United Kingdom Transient Voltage Surge Suppressor Tvs Volume (K) Forecast, by Application 2019 & 2032
- Table 41: Germany Transient Voltage Surge Suppressor Tvs Revenue (million) Forecast, by Application 2019 & 2032
- Table 42: Germany Transient Voltage Surge Suppressor Tvs Volume (K) Forecast, by Application 2019 & 2032
- Table 43: France Transient Voltage Surge Suppressor Tvs Revenue (million) Forecast, by Application 2019 & 2032
- Table 44: France Transient Voltage Surge Suppressor Tvs Volume (K) Forecast, by Application 2019 & 2032
- Table 45: Italy Transient Voltage Surge Suppressor Tvs Revenue (million) Forecast, by Application 2019 & 2032
- Table 46: Italy Transient Voltage Surge Suppressor Tvs Volume (K) Forecast, by Application 2019 & 2032
- Table 47: Spain Transient Voltage Surge Suppressor Tvs Revenue (million) Forecast, by Application 2019 & 2032
- Table 48: Spain Transient Voltage Surge Suppressor Tvs Volume (K) Forecast, by Application 2019 & 2032
- Table 49: Russia Transient Voltage Surge Suppressor Tvs Revenue (million) Forecast, by Application 2019 & 2032
- Table 50: Russia Transient Voltage Surge Suppressor Tvs Volume (K) Forecast, by Application 2019 & 2032
- Table 51: Benelux Transient Voltage Surge Suppressor Tvs Revenue (million) Forecast, by Application 2019 & 2032
- Table 52: Benelux Transient Voltage Surge Suppressor Tvs Volume (K) Forecast, by Application 2019 & 2032
- Table 53: Nordics Transient Voltage Surge Suppressor Tvs Revenue (million) Forecast, by Application 2019 & 2032
- Table 54: Nordics Transient Voltage Surge Suppressor Tvs Volume (K) Forecast, by Application 2019 & 2032
- Table 55: Rest of Europe Transient Voltage Surge Suppressor Tvs Revenue (million) Forecast, by Application 2019 & 2032
- Table 56: Rest of Europe Transient Voltage Surge Suppressor Tvs Volume (K) Forecast, by Application 2019 & 2032
- Table 57: Global Transient Voltage Surge Suppressor Tvs Revenue million Forecast, by Application 2019 & 2032
- Table 58: Global Transient Voltage Surge Suppressor Tvs Volume K Forecast, by Application 2019 & 2032
- Table 59: Global Transient Voltage Surge Suppressor Tvs Revenue million Forecast, by Type 2019 & 2032
- Table 60: Global Transient Voltage Surge Suppressor Tvs Volume K Forecast, by Type 2019 & 2032
- Table 61: Global Transient Voltage Surge Suppressor Tvs Revenue million Forecast, by Country 2019 & 2032
- Table 62: Global Transient Voltage Surge Suppressor Tvs Volume K Forecast, by Country 2019 & 2032
- Table 63: Turkey Transient Voltage Surge Suppressor Tvs Revenue (million) Forecast, by Application 2019 & 2032
- Table 64: Turkey Transient Voltage Surge Suppressor Tvs Volume (K) Forecast, by Application 2019 & 2032
- Table 65: Israel Transient Voltage Surge Suppressor Tvs Revenue (million) Forecast, by Application 2019 & 2032
- Table 66: Israel Transient Voltage Surge Suppressor Tvs Volume (K) Forecast, by Application 2019 & 2032
- Table 67: GCC Transient Voltage Surge Suppressor Tvs Revenue (million) Forecast, by Application 2019 & 2032
- Table 68: GCC Transient Voltage Surge Suppressor Tvs Volume (K) Forecast, by Application 2019 & 2032
- Table 69: North Africa Transient Voltage Surge Suppressor Tvs Revenue (million) Forecast, by Application 2019 & 2032
- Table 70: North Africa Transient Voltage Surge Suppressor Tvs Volume (K) Forecast, by Application 2019 & 2032
- Table 71: South Africa Transient Voltage Surge Suppressor Tvs Revenue (million) Forecast, by Application 2019 & 2032
- Table 72: South Africa Transient Voltage Surge Suppressor Tvs Volume (K) Forecast, by Application 2019 & 2032
- Table 73: Rest of Middle East & Africa Transient Voltage Surge Suppressor Tvs Revenue (million) Forecast, by Application 2019 & 2032
- Table 74: Rest of Middle East & Africa Transient Voltage Surge Suppressor Tvs Volume (K) Forecast, by Application 2019 & 2032
- Table 75: Global Transient Voltage Surge Suppressor Tvs Revenue million Forecast, by Application 2019 & 2032
- Table 76: Global Transient Voltage Surge Suppressor Tvs Volume K Forecast, by Application 2019 & 2032
- Table 77: Global Transient Voltage Surge Suppressor Tvs Revenue million Forecast, by Type 2019 & 2032
- Table 78: Global Transient Voltage Surge Suppressor Tvs Volume K Forecast, by Type 2019 & 2032
- Table 79: Global Transient Voltage Surge Suppressor Tvs Revenue million Forecast, by Country 2019 & 2032
- Table 80: Global Transient Voltage Surge Suppressor Tvs Volume K Forecast, by Country 2019 & 2032
- Table 81: China Transient Voltage Surge Suppressor Tvs Revenue (million) Forecast, by Application 2019 & 2032
- Table 82: China Transient Voltage Surge Suppressor Tvs Volume (K) Forecast, by Application 2019 & 2032
- Table 83: India Transient Voltage Surge Suppressor Tvs Revenue (million) Forecast, by Application 2019 & 2032
- Table 84: India Transient Voltage Surge Suppressor Tvs Volume (K) Forecast, by Application 2019 & 2032
- Table 85: Japan Transient Voltage Surge Suppressor Tvs Revenue (million) Forecast, by Application 2019 & 2032
- Table 86: Japan Transient Voltage Surge Suppressor Tvs Volume (K) Forecast, by Application 2019 & 2032
- Table 87: South Korea Transient Voltage Surge Suppressor Tvs Revenue (million) Forecast, by Application 2019 & 2032
- Table 88: South Korea Transient Voltage Surge Suppressor Tvs Volume (K) Forecast, by Application 2019 & 2032
- Table 89: ASEAN Transient Voltage Surge Suppressor Tvs Revenue (million) Forecast, by Application 2019 & 2032
- Table 90: ASEAN Transient Voltage Surge Suppressor Tvs Volume (K) Forecast, by Application 2019 & 2032
- Table 91: Oceania Transient Voltage Surge Suppressor Tvs Revenue (million) Forecast, by Application 2019 & 2032
- Table 92: Oceania Transient Voltage Surge Suppressor Tvs Volume (K) Forecast, by Application 2019 & 2032
- Table 93: Rest of Asia Pacific Transient Voltage Surge Suppressor Tvs Revenue (million) Forecast, by Application 2019 & 2032
- Table 94: Rest of Asia Pacific Transient Voltage Surge Suppressor Tvs Volume (K) Forecast, by Application 2019 & 2032
Frequently Asked Questions
1. What is the projected Compound Annual Growth Rate (CAGR) of the Transient Voltage Surge Suppressor Tvs?
The projected CAGR is approximately XXX%.
2. Which companies are prominent players in the Transient Voltage Surge Suppressor Tvs?
Key companies in the market include Infineon, Nexperia, SEMTECH, Vishay, Littelfuse, BrightKing, Amazing, STMicroelectronics, ON Semiconductor, WAYON, Diodes Inc., Bourns, LAN technology, ANOVA, MDE, TOSHIBA, UN Semiconductor, PROTEK, INPAQ, EIC, SOCAY, SG Micro Corp.
3. What are the main segments of the Transient Voltage Surge Suppressor Tvs?
The market segments include Application, Type.
4. Can you provide details about the market size?
The market size is estimated to be USD XXX million as of 2022.
5. What are some drivers contributing to market growth?
N/A
6. What are the notable trends driving market growth?
N/A
7. Are there any restraints impacting market growth?
N/A
8. Can you provide examples of recent developments in the market?
N/A
9. What pricing options are available for accessing the report?
Pricing options include single-user, multi-user, and enterprise licenses priced at USD 3950.00, USD 5925.00, and USD 7900.00 respectively.
10. Is the market size provided in terms of value or volume?
The market size is provided in terms of value, measured in million and volume, measured in K.
11. Are there any specific market keywords associated with the report?
Yes, the market keyword associated with the report is "Transient Voltage Surge Suppressor Tvs," which aids in identifying and referencing the specific market segment covered.
12. How do I determine which pricing option suits my needs best?
The pricing options vary based on user requirements and access needs. Individual users may opt for single-user licenses, while businesses requiring broader access may choose multi-user or enterprise licenses for cost-effective access to the report.
13. Are there any additional resources or data provided in the Transient Voltage Surge Suppressor Tvs report?
While the report offers comprehensive insights, it's advisable to review the specific contents or supplementary materials provided to ascertain if additional resources or data are available.
14. How can I stay updated on further developments or reports in the Transient Voltage Surge Suppressor Tvs?
To stay informed about further developments, trends, and reports in the Transient Voltage Surge Suppressor Tvs, consider subscribing to industry newsletters, following relevant companies and organizations, or regularly checking reputable industry news sources and publications.
Methodology
Step 1 - Identification of Relevant Samples Size from Population Database


Step 2 - Approaches for Defining Global Market Size (Value, Volume* & Price*)

Note*: In applicable scenarios
Step 3 - Data Sources
Primary Research
- Web Analytics
- Survey Reports
- Research Institute
- Latest Research Reports
- Opinion Leaders
Secondary Research
- Annual Reports
- White Paper
- Latest Press Release
- Industry Association
- Paid Database
- Investor Presentations

Step 4 - Data Triangulation
Involves using different sources of information in order to increase the validity of a study
These sources are likely to be stakeholders in a program - participants, other researchers, program staff, other community members, and so on.
Then we put all data in single framework & apply various statistical tools to find out the dynamic on the market.
During the analysis stage, feedback from the stakeholder groups would be compared to determine areas of agreement as well as areas of divergence


