

Key Insights
The UK mobile payments market demonstrates strong expansion, propelled by rising smartphone adoption, increasing contactless technology utilization, and a pronounced shift towards digital transactions. The market is projected for significant growth, with a projected Compound Annual Growth Rate (CAGR) of 15.2% from 2025 to 2033. The market size is estimated at $11.7 billion in 2025. Key growth drivers include the inherent convenience and speed of mobile payments, robust security features offered by leading providers, and widespread acceptance by both consumers and businesses. The proliferation of mobile wallets, augmented by attractive incentives and loyalty programs, further stimulates market development. The market is segmented by payment type (proximity and remote) and end-user (consumers and businesses), with both contributing to overall expansion. While proximity payments currently lead, remote payment solutions are rapidly gaining momentum. Despite potential regulatory challenges and security concerns, the market outlook remains exceptionally positive, anticipating sustained substantial growth through the forecast period.
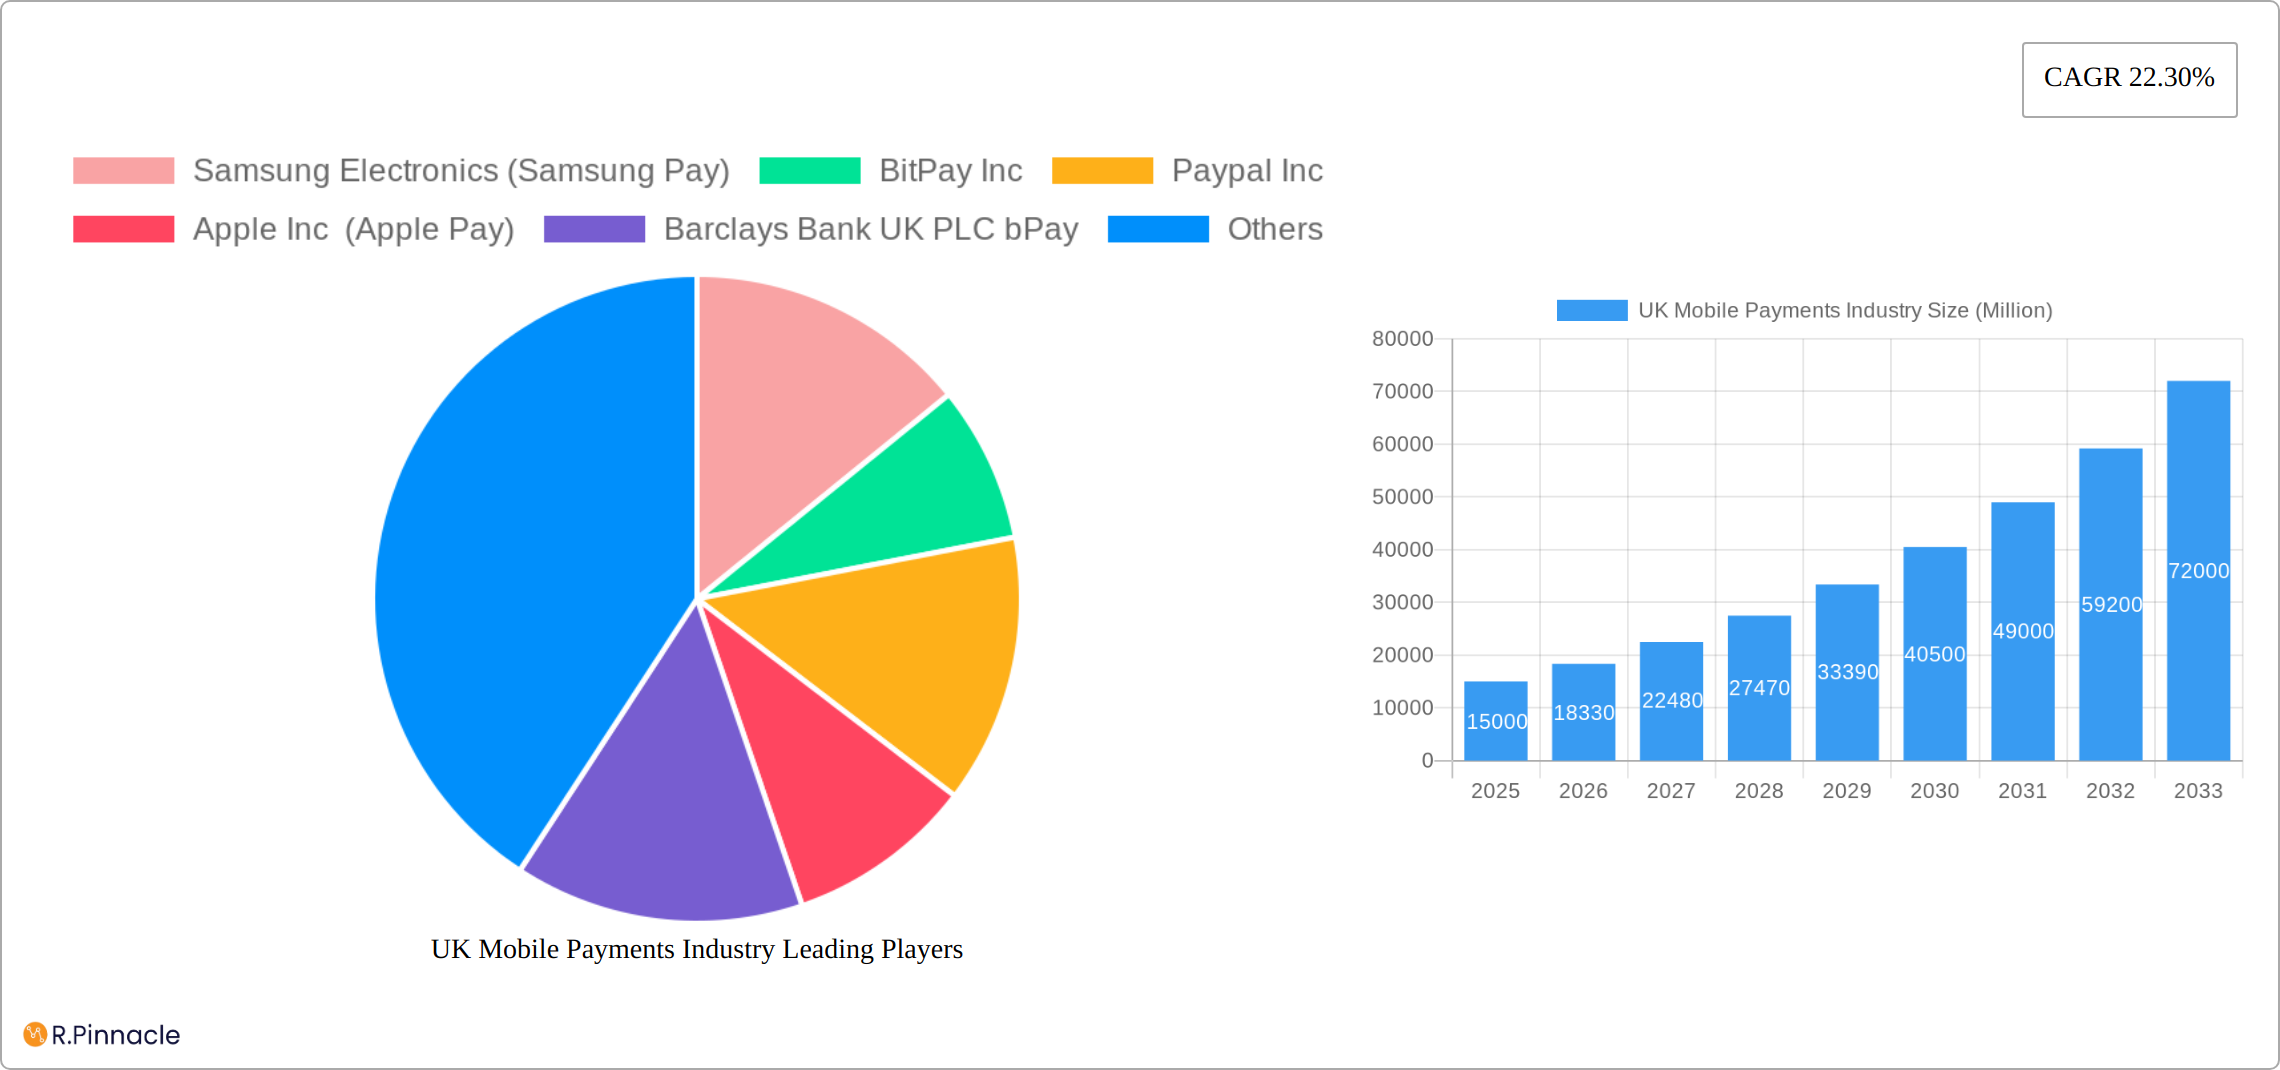
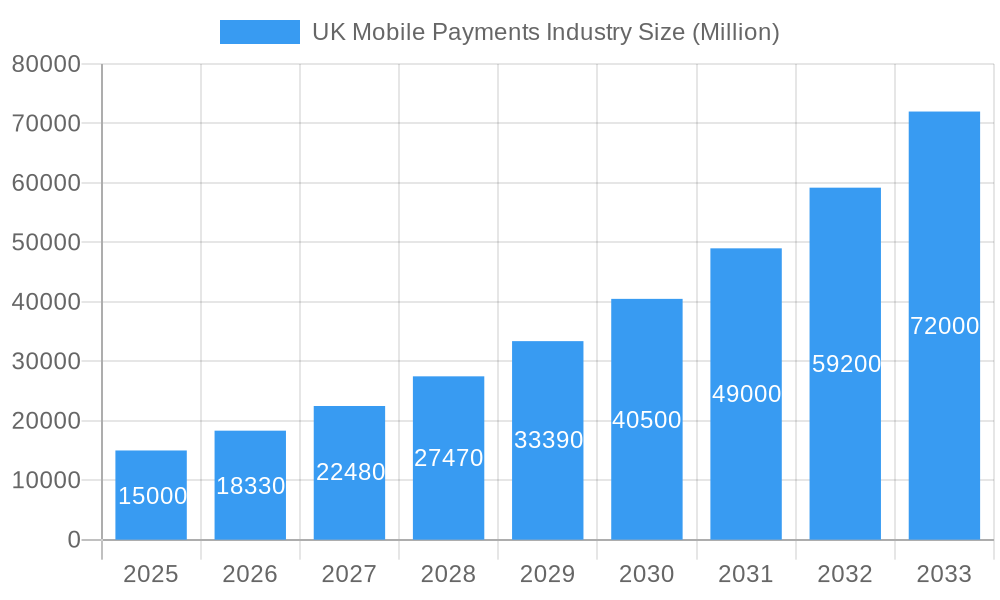
UK Mobile Payments Industry Market Size (In Billion)
The competitive environment features established leaders such as Apple, Google, and PayPal, alongside dynamic fintech innovators. Continuous innovation, the introduction of advanced features, and strategic partnerships are crucial for maintaining market position. The UK's advanced digital infrastructure and high smartphone penetration create an ideal ecosystem for mobile payment services. While regional nuances exist across the UK, consistent growth is observed nationwide. Future expansion will be influenced by 5G network advancements, the integration of mobile payments with broader financial services, and the development of pioneering solutions like biometric authentication and advanced fraud prevention. Continued consumer trust and rigorous security protocols are paramount to the market's ongoing success.
UK Mobile Payments Industry Company Market Share
UK Mobile Payments Industry Report: 2019-2033 Forecast
This comprehensive report provides an in-depth analysis of the UK mobile payments industry, offering invaluable insights for industry professionals, investors, and strategists. Covering the period from 2019 to 2033, with a focus on 2025, this report unveils the market's structure, dynamics, and future potential. The study incorporates detailed segmentation by payment type (Proximity and Remote) and end-user (Consumers and Businesses), providing granular data and actionable forecasts. Expect detailed analysis of key players like Samsung Pay, BitPay Inc, Paypal Inc, Apple Pay, Barclays Bank UK PLC bPay, Fitbit International Limited (Fitbit Pay), Google Pay, Amazon Payments Inc, Mobile Payments Service Company Limited (Paym), and Klarna Bank AB (publ). The report projects a market valued at £xx Million in 2025.
UK Mobile Payments Industry Market Structure & Innovation Trends
This section analyzes the UK mobile payments market's competitive landscape, highlighting market concentration, innovation drivers, regulatory frameworks, and M&A activities. The report examines the market share of key players and explores the impact of mergers and acquisitions on market dynamics. Deal values for significant M&A transactions are included where data is available. The analysis also considers the influence of product substitutes and end-user demographics on market growth. For example, the increasing adoption of contactless payments amongst younger demographics is assessed. The influence of regulatory frameworks on the development and adoption of mobile payment solutions is explored, influencing factors like PSD2 and open banking directives are taken into consideration. The report examines the influence of these external factors on the rate of adoption and innovation within the UK mobile payment sector. The concentration ratio (CR) for the top 5 players is estimated to be xx%, showing a moderately consolidated market in 2025. Total M&A deal value within the period 2019-2024 is estimated at £xx Million.
UK Mobile Payments Industry Market Dynamics & Trends
The UK mobile payments market is experiencing dynamic growth, driven by several key factors. Smartphone penetration continues to rise, fueling the adoption of e-commerce and contactless payment technologies. This trend is further accelerated by the increasing preference for speed and convenience in transactions. Technological innovation plays a crucial role, with the emergence of biometric authentication, improved security protocols, and the integration of mobile payments with other financial services significantly impacting market expansion. The competitive landscape is characterized by intense rivalry among established players and innovative fintech startups, leading to continuous product improvements and enhanced user experiences. Consumer behavior analysis reveals a strong preference for user-friendly, secure, and integrated mobile payment solutions. This is reflected in the projected Compound Annual Growth Rate (CAGR) of xx% during the forecast period (2025-2033), with market penetration expected to reach xx% by 2033. This growth is supported by government initiatives promoting cashless transactions and a broader shift towards digitalization within the UK economy.
Dominant Regions & Segments in UK Mobile Payments Industry
The UK mobile payments market exhibits varied growth patterns across different regions and segments. Analyzing market share and growth rates reveals key insights into the industry's structure.
Proximity Payments:
- Key Drivers: Widespread contactless payment infrastructure, government-led initiatives promoting digital transactions, and the inherent speed and convenience offered by proximity payment solutions.
- Dominant Regions/Segments: London and other major urban areas demonstrate the highest adoption rates due to high population density and established infrastructure. However, growth is also evident in smaller towns and cities as infrastructure improves.
Remote Payments:
- Key Drivers: The flourishing e-commerce sector, increased internet and smartphone penetration, and the expanding adoption of online banking services all contribute to the growth of remote payments.
- Dominant Regions/Segments: While nationwide reach is observed, growth in suburban and rural areas is particularly noteworthy, reflecting the increasing accessibility of online shopping in these regions.
Consumer Segment:
- Key Drivers: The convenience, speed, and enhanced security features offered by mobile payment apps, coupled with their integration with other digital services, are key factors driving consumer adoption.
- Dominant Demographics: Younger demographics demonstrate higher adoption rates; however, usage is expanding across all age groups as familiarity and trust in mobile payment systems increase.
Business Segment:
- Key Drivers: Reduced transaction costs, streamlined payment processing efficiency, robust security features, and improved customer experience are key incentives for businesses to adopt mobile payment solutions.
- Dominant Demographics: Small and medium-sized enterprises (SMEs) show high adoption rates, with larger enterprises increasingly integrating these solutions into their operations to enhance operational efficiency and customer engagement.
UK Mobile Payments Industry Product Innovations
The UK mobile payments landscape is characterized by continuous innovation. Recent developments highlight significant advancements in technology and user experience. The integration of biometric authentication enhances security, while the expansion of mobile wallets to incorporate various financial services provides greater convenience. The market trend is towards more integrated and user-friendly solutions, adapting to changing consumer preferences and fostering competition. New entrants leverage innovative technologies to gain a competitive advantage, resulting in the introduction of functionalities and value propositions that cater to evolving market demands. For example, the rise of embedded finance is creating opportunities for innovative partnerships and expanded service offerings.
Report Scope & Segmentation Analysis
This report provides a detailed segmentation of the UK mobile payments market, categorized by payment type (Proximity and Remote) and end-user (Consumers and Businesses). Each segment's market size and growth projections offer a comprehensive overview of the industry's structure and future trajectory.
Proximity Payments: This segment, encompassing NFC and similar technologies, is projected to reach a market size of £xx Million in 2025, with a CAGR of xx% during the forecast period. Competition is intense, with both established players and emerging fintech companies vying for market share.
Remote Payments: This segment, including mobile app and online platform payments, is projected to reach £xx Million in 2025, with a CAGR of xx%. Competition is primarily driven by innovation in security and user experience, particularly within the mobile payment app sector.
Consumers: The consumer segment, encompassing individuals using mobile payments for personal transactions, is projected to reach £xx Million in 2025, with a CAGR of xx%. This growth is fueled by increasing mobile penetration and the rising preference for convenient payment solutions.
Businesses: The business segment, encompassing businesses utilizing mobile payments for transaction processing, is projected to reach £xx Million in 2025, with a CAGR of xx%. Cost efficiency and improved operational processes are the primary drivers of this segment's growth.
Key Drivers of UK Mobile Payments Industry Growth
Several factors fuel the growth of the UK mobile payments industry. Increasing smartphone penetration, the rise of e-commerce, and the widespread adoption of contactless payment methods are key contributors. Government initiatives promoting digitalization and a favorable regulatory environment also play significant roles. Furthermore, the continuous innovation in payment technologies, such as the integration of biometrics and enhanced security features, drives market expansion.
Challenges in the UK Mobile Payments Industry Sector
Despite significant growth, the UK mobile payments industry faces challenges. Security concerns, particularly regarding data breaches and fraud, remain a significant obstacle. Regulatory compliance requirements can prove complex and costly for businesses, while concerns about consumer data privacy also pose challenges. Furthermore, the competitive landscape is highly dynamic, with established players and emerging fintech companies vying for market share. The estimated annual cost of dealing with these security challenges is £xx Million.
Emerging Opportunities in UK Mobile Payments Industry
The UK mobile payments market presents a wealth of opportunities for growth and innovation. The increasing adoption of open banking APIs creates new avenues for the development of innovative payment solutions. Integrating mobile payments with loyalty programs and other digital services offers significant market expansion potential. Further opportunities exist in expanding into new market segments, such as micropayments and peer-to-peer (P2P) transactions. Moreover, the development of sophisticated AI-powered fraud prevention systems is crucial for maintaining consumer trust and security, representing a significant opportunity for technology providers.
Leading Players in the UK Mobile Payments Industry Market
- Samsung Electronics (Samsung Pay)
- BitPay Inc
- Paypal Inc
- Apple Inc (Apple Pay)
- Barclays Bank UK PLC bPay
- Fitbit International Limited (Fitbit Pay)
- Google LLC (Google Pay)
- Amazon Payments Inc
- Mobile Payments Service Company Limited (Paym)
- Klarna Bank AB (publ)
Key Developments in UK Mobile Payments Industry
- May 2022: Google announced Google Wallet, expanding its reach in the UK. This launch is expected to significantly increase contactless payment adoption.
- May 2022: The Big Issue Group partnered with PayPal's Zettle, enabling contactless payments for its vendors. This initiative is expected to boost mobile payment adoption amongst smaller businesses.
Future Outlook for UK Mobile Payments Industry Market
The future of the UK mobile payments market looks bright. Continued growth is anticipated, driven by factors like increasing smartphone penetration, the expansion of e-commerce, and ongoing technological advancements. The market will likely witness further consolidation through mergers and acquisitions, with key players focusing on innovation and expansion into new market segments. The market is expected to experience robust growth due to continuous innovation and rising consumer adoption.
UK Mobile Payments Industry Segmentation
-
1. Type
- 1.1. Proximity Payment
- 1.2. Remote Payment
UK Mobile Payments Industry Segmentation By Geography
-
1. North America
- 1.1. United States
- 1.2. Canada
- 1.3. Mexico
-
2. South America
- 2.1. Brazil
- 2.2. Argentina
- 2.3. Rest of South America
-
3. Europe
- 3.1. United Kingdom
- 3.2. Germany
- 3.3. France
- 3.4. Italy
- 3.5. Spain
- 3.6. Russia
- 3.7. Benelux
- 3.8. Nordics
- 3.9. Rest of Europe
-
4. Middle East & Africa
- 4.1. Turkey
- 4.2. Israel
- 4.3. GCC
- 4.4. North Africa
- 4.5. South Africa
- 4.6. Rest of Middle East & Africa
-
5. Asia Pacific
- 5.1. China
- 5.2. India
- 5.3. Japan
- 5.4. South Korea
- 5.5. ASEAN
- 5.6. Oceania
- 5.7. Rest of Asia Pacific
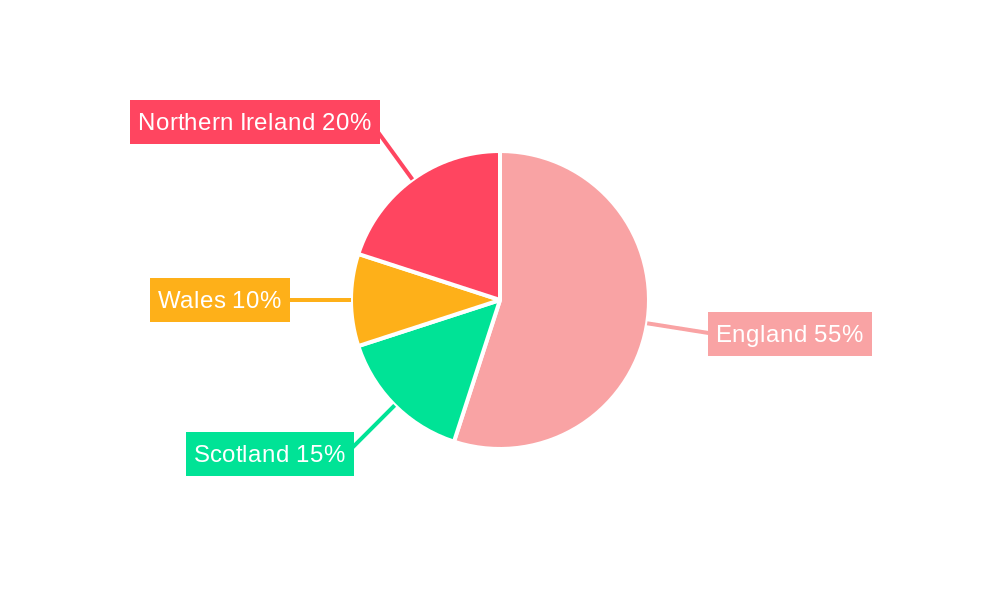
UK Mobile Payments Industry Regional Market Share
Geographic Coverage of UK Mobile Payments Industry
UK Mobile Payments Industry REPORT HIGHLIGHTS
| Aspects | Details |
|---|---|
| Study Period | 2020-2034 |
| Base Year | 2025 |
| Estimated Year | 2026 |
| Forecast Period | 2026-2034 |
| Historical Period | 2020-2025 |
| Growth Rate | CAGR of 15.2% from 2020-2034 |
| Segmentation |
|
Table of Contents
- 1. Introduction
- 1.1. Research Scope
- 1.2. Market Segmentation
- 1.3. Research Methodology
- 1.4. Definitions and Assumptions
- 2. Executive Summary
- 2.1. Introduction
- 3. Market Dynamics
- 3.1. Introduction
- 3.2. Market Drivers
- 3.2.1. Development of M-Commerce Ecosystem with High Internet Penetration; Favorable Government Initiatives and Regulations
- 3.3. Market Restrains
- 3.3.1. Cybersecurity and Data Breaches for Mobile Payments
- 3.4. Market Trends
- 3.4.1. Internet Penetration in the UK is Driving the Market
- 4. Market Factor Analysis
- 4.1. Porters Five Forces
- 4.2. Supply/Value Chain
- 4.3. PESTEL analysis
- 4.4. Market Entropy
- 4.5. Patent/Trademark Analysis
- 5. Global UK Mobile Payments Industry Analysis, Insights and Forecast, 2020-2032
- 5.1. Market Analysis, Insights and Forecast - by Type
- 5.1.1. Proximity Payment
- 5.1.2. Remote Payment
- 5.2. Market Analysis, Insights and Forecast - by Region
- 5.2.1. North America
- 5.2.2. South America
- 5.2.3. Europe
- 5.2.4. Middle East & Africa
- 5.2.5. Asia Pacific
- 5.1. Market Analysis, Insights and Forecast - by Type
- 6. North America UK Mobile Payments Industry Analysis, Insights and Forecast, 2020-2032
- 6.1. Market Analysis, Insights and Forecast - by Type
- 6.1.1. Proximity Payment
- 6.1.2. Remote Payment
- 6.1. Market Analysis, Insights and Forecast - by Type
- 7. South America UK Mobile Payments Industry Analysis, Insights and Forecast, 2020-2032
- 7.1. Market Analysis, Insights and Forecast - by Type
- 7.1.1. Proximity Payment
- 7.1.2. Remote Payment
- 7.1. Market Analysis, Insights and Forecast - by Type
- 8. Europe UK Mobile Payments Industry Analysis, Insights and Forecast, 2020-2032
- 8.1. Market Analysis, Insights and Forecast - by Type
- 8.1.1. Proximity Payment
- 8.1.2. Remote Payment
- 8.1. Market Analysis, Insights and Forecast - by Type
- 9. Middle East & Africa UK Mobile Payments Industry Analysis, Insights and Forecast, 2020-2032
- 9.1. Market Analysis, Insights and Forecast - by Type
- 9.1.1. Proximity Payment
- 9.1.2. Remote Payment
- 9.1. Market Analysis, Insights and Forecast - by Type
- 10. Asia Pacific UK Mobile Payments Industry Analysis, Insights and Forecast, 2020-2032
- 10.1. Market Analysis, Insights and Forecast - by Type
- 10.1.1. Proximity Payment
- 10.1.2. Remote Payment
- 10.1. Market Analysis, Insights and Forecast - by Type
- 11. Competitive Analysis
- 11.1. Global Market Share Analysis 2025
- 11.2. Company Profiles
- 11.2.1 Samsung Electronics (Samsung Pay)
- 11.2.1.1. Overview
- 11.2.1.2. Products
- 11.2.1.3. SWOT Analysis
- 11.2.1.4. Recent Developments
- 11.2.1.5. Financials (Based on Availability)
- 11.2.2 BitPay Inc
- 11.2.2.1. Overview
- 11.2.2.2. Products
- 11.2.2.3. SWOT Analysis
- 11.2.2.4. Recent Developments
- 11.2.2.5. Financials (Based on Availability)
- 11.2.3 Paypal Inc
- 11.2.3.1. Overview
- 11.2.3.2. Products
- 11.2.3.3. SWOT Analysis
- 11.2.3.4. Recent Developments
- 11.2.3.5. Financials (Based on Availability)
- 11.2.4 Apple Inc (Apple Pay)
- 11.2.4.1. Overview
- 11.2.4.2. Products
- 11.2.4.3. SWOT Analysis
- 11.2.4.4. Recent Developments
- 11.2.4.5. Financials (Based on Availability)
- 11.2.5 Barclays Bank UK PLC bPay
- 11.2.5.1. Overview
- 11.2.5.2. Products
- 11.2.5.3. SWOT Analysis
- 11.2.5.4. Recent Developments
- 11.2.5.5. Financials (Based on Availability)
- 11.2.6 Fitbit International Limited (Fitbit Pay)
- 11.2.6.1. Overview
- 11.2.6.2. Products
- 11.2.6.3. SWOT Analysis
- 11.2.6.4. Recent Developments
- 11.2.6.5. Financials (Based on Availability)
- 11.2.7 Google LLC (Google Pay)
- 11.2.7.1. Overview
- 11.2.7.2. Products
- 11.2.7.3. SWOT Analysis
- 11.2.7.4. Recent Developments
- 11.2.7.5. Financials (Based on Availability)
- 11.2.8 Amazon Payments Inc
- 11.2.8.1. Overview
- 11.2.8.2. Products
- 11.2.8.3. SWOT Analysis
- 11.2.8.4. Recent Developments
- 11.2.8.5. Financials (Based on Availability)
- 11.2.9 Mobile Payments Service Company Limited (Paym)
- 11.2.9.1. Overview
- 11.2.9.2. Products
- 11.2.9.3. SWOT Analysis
- 11.2.9.4. Recent Developments
- 11.2.9.5. Financials (Based on Availability)
- 11.2.10 Klarna Bank AB (publ)
- 11.2.10.1. Overview
- 11.2.10.2. Products
- 11.2.10.3. SWOT Analysis
- 11.2.10.4. Recent Developments
- 11.2.10.5. Financials (Based on Availability)
- 11.2.1 Samsung Electronics (Samsung Pay)
List of Figures
- Figure 1: Global UK Mobile Payments Industry Revenue Breakdown (billion, %) by Region 2025 & 2033
- Figure 2: North America UK Mobile Payments Industry Revenue (billion), by Type 2025 & 2033
- Figure 3: North America UK Mobile Payments Industry Revenue Share (%), by Type 2025 & 2033
- Figure 4: North America UK Mobile Payments Industry Revenue (billion), by Country 2025 & 2033
- Figure 5: North America UK Mobile Payments Industry Revenue Share (%), by Country 2025 & 2033
- Figure 6: South America UK Mobile Payments Industry Revenue (billion), by Type 2025 & 2033
- Figure 7: South America UK Mobile Payments Industry Revenue Share (%), by Type 2025 & 2033
- Figure 8: South America UK Mobile Payments Industry Revenue (billion), by Country 2025 & 2033
- Figure 9: South America UK Mobile Payments Industry Revenue Share (%), by Country 2025 & 2033
- Figure 10: Europe UK Mobile Payments Industry Revenue (billion), by Type 2025 & 2033
- Figure 11: Europe UK Mobile Payments Industry Revenue Share (%), by Type 2025 & 2033
- Figure 12: Europe UK Mobile Payments Industry Revenue (billion), by Country 2025 & 2033
- Figure 13: Europe UK Mobile Payments Industry Revenue Share (%), by Country 2025 & 2033
- Figure 14: Middle East & Africa UK Mobile Payments Industry Revenue (billion), by Type 2025 & 2033
- Figure 15: Middle East & Africa UK Mobile Payments Industry Revenue Share (%), by Type 2025 & 2033
- Figure 16: Middle East & Africa UK Mobile Payments Industry Revenue (billion), by Country 2025 & 2033
- Figure 17: Middle East & Africa UK Mobile Payments Industry Revenue Share (%), by Country 2025 & 2033
- Figure 18: Asia Pacific UK Mobile Payments Industry Revenue (billion), by Type 2025 & 2033
- Figure 19: Asia Pacific UK Mobile Payments Industry Revenue Share (%), by Type 2025 & 2033
- Figure 20: Asia Pacific UK Mobile Payments Industry Revenue (billion), by Country 2025 & 2033
- Figure 21: Asia Pacific UK Mobile Payments Industry Revenue Share (%), by Country 2025 & 2033
List of Tables
- Table 1: Global UK Mobile Payments Industry Revenue billion Forecast, by Type 2020 & 2033
- Table 2: Global UK Mobile Payments Industry Revenue billion Forecast, by Region 2020 & 2033
- Table 3: Global UK Mobile Payments Industry Revenue billion Forecast, by Type 2020 & 2033
- Table 4: Global UK Mobile Payments Industry Revenue billion Forecast, by Country 2020 & 2033
- Table 5: United States UK Mobile Payments Industry Revenue (billion) Forecast, by Application 2020 & 2033
- Table 6: Canada UK Mobile Payments Industry Revenue (billion) Forecast, by Application 2020 & 2033
- Table 7: Mexico UK Mobile Payments Industry Revenue (billion) Forecast, by Application 2020 & 2033
- Table 8: Global UK Mobile Payments Industry Revenue billion Forecast, by Type 2020 & 2033
- Table 9: Global UK Mobile Payments Industry Revenue billion Forecast, by Country 2020 & 2033
- Table 10: Brazil UK Mobile Payments Industry Revenue (billion) Forecast, by Application 2020 & 2033
- Table 11: Argentina UK Mobile Payments Industry Revenue (billion) Forecast, by Application 2020 & 2033
- Table 12: Rest of South America UK Mobile Payments Industry Revenue (billion) Forecast, by Application 2020 & 2033
- Table 13: Global UK Mobile Payments Industry Revenue billion Forecast, by Type 2020 & 2033
- Table 14: Global UK Mobile Payments Industry Revenue billion Forecast, by Country 2020 & 2033
- Table 15: United Kingdom UK Mobile Payments Industry Revenue (billion) Forecast, by Application 2020 & 2033
- Table 16: Germany UK Mobile Payments Industry Revenue (billion) Forecast, by Application 2020 & 2033
- Table 17: France UK Mobile Payments Industry Revenue (billion) Forecast, by Application 2020 & 2033
- Table 18: Italy UK Mobile Payments Industry Revenue (billion) Forecast, by Application 2020 & 2033
- Table 19: Spain UK Mobile Payments Industry Revenue (billion) Forecast, by Application 2020 & 2033
- Table 20: Russia UK Mobile Payments Industry Revenue (billion) Forecast, by Application 2020 & 2033
- Table 21: Benelux UK Mobile Payments Industry Revenue (billion) Forecast, by Application 2020 & 2033
- Table 22: Nordics UK Mobile Payments Industry Revenue (billion) Forecast, by Application 2020 & 2033
- Table 23: Rest of Europe UK Mobile Payments Industry Revenue (billion) Forecast, by Application 2020 & 2033
- Table 24: Global UK Mobile Payments Industry Revenue billion Forecast, by Type 2020 & 2033
- Table 25: Global UK Mobile Payments Industry Revenue billion Forecast, by Country 2020 & 2033
- Table 26: Turkey UK Mobile Payments Industry Revenue (billion) Forecast, by Application 2020 & 2033
- Table 27: Israel UK Mobile Payments Industry Revenue (billion) Forecast, by Application 2020 & 2033
- Table 28: GCC UK Mobile Payments Industry Revenue (billion) Forecast, by Application 2020 & 2033
- Table 29: North Africa UK Mobile Payments Industry Revenue (billion) Forecast, by Application 2020 & 2033
- Table 30: South Africa UK Mobile Payments Industry Revenue (billion) Forecast, by Application 2020 & 2033
- Table 31: Rest of Middle East & Africa UK Mobile Payments Industry Revenue (billion) Forecast, by Application 2020 & 2033
- Table 32: Global UK Mobile Payments Industry Revenue billion Forecast, by Type 2020 & 2033
- Table 33: Global UK Mobile Payments Industry Revenue billion Forecast, by Country 2020 & 2033
- Table 34: China UK Mobile Payments Industry Revenue (billion) Forecast, by Application 2020 & 2033
- Table 35: India UK Mobile Payments Industry Revenue (billion) Forecast, by Application 2020 & 2033
- Table 36: Japan UK Mobile Payments Industry Revenue (billion) Forecast, by Application 2020 & 2033
- Table 37: South Korea UK Mobile Payments Industry Revenue (billion) Forecast, by Application 2020 & 2033
- Table 38: ASEAN UK Mobile Payments Industry Revenue (billion) Forecast, by Application 2020 & 2033
- Table 39: Oceania UK Mobile Payments Industry Revenue (billion) Forecast, by Application 2020 & 2033
- Table 40: Rest of Asia Pacific UK Mobile Payments Industry Revenue (billion) Forecast, by Application 2020 & 2033
Frequently Asked Questions
1. What is the projected Compound Annual Growth Rate (CAGR) of the UK Mobile Payments Industry?
The projected CAGR is approximately 15.2%.
2. Which companies are prominent players in the UK Mobile Payments Industry?
Key companies in the market include Samsung Electronics (Samsung Pay), BitPay Inc, Paypal Inc, Apple Inc (Apple Pay), Barclays Bank UK PLC bPay, Fitbit International Limited (Fitbit Pay), Google LLC (Google Pay), Amazon Payments Inc, Mobile Payments Service Company Limited (Paym), Klarna Bank AB (publ).
3. What are the main segments of the UK Mobile Payments Industry?
The market segments include Type.
4. Can you provide details about the market size?
The market size is estimated to be USD 11.7 billion as of 2022.
5. What are some drivers contributing to market growth?
Development of M-Commerce Ecosystem with High Internet Penetration; Favorable Government Initiatives and Regulations.
6. What are the notable trends driving market growth?
Internet Penetration in the UK is Driving the Market.
7. Are there any restraints impacting market growth?
Cybersecurity and Data Breaches for Mobile Payments.
8. Can you provide examples of recent developments in the market?
May 2022 - Google announced Google Wallet to store payment and non-payment assets in virtual cloud-based storage. The payment assets could include credit cards, debit cards, etc., which could be used to make payments by using the Tap to Pay feature from the smartphone, wherever Google Pay is acceptable for a mode of payment. The app will be available in 39 markets worldwide, including the United Kingdom.
9. What pricing options are available for accessing the report?
Pricing options include single-user, multi-user, and enterprise licenses priced at USD 3800, USD 4500, and USD 5800 respectively.
10. Is the market size provided in terms of value or volume?
The market size is provided in terms of value, measured in billion.
11. Are there any specific market keywords associated with the report?
Yes, the market keyword associated with the report is "UK Mobile Payments Industry," which aids in identifying and referencing the specific market segment covered.
12. How do I determine which pricing option suits my needs best?
The pricing options vary based on user requirements and access needs. Individual users may opt for single-user licenses, while businesses requiring broader access may choose multi-user or enterprise licenses for cost-effective access to the report.
13. Are there any additional resources or data provided in the UK Mobile Payments Industry report?
While the report offers comprehensive insights, it's advisable to review the specific contents or supplementary materials provided to ascertain if additional resources or data are available.
14. How can I stay updated on further developments or reports in the UK Mobile Payments Industry?
To stay informed about further developments, trends, and reports in the UK Mobile Payments Industry, consider subscribing to industry newsletters, following relevant companies and organizations, or regularly checking reputable industry news sources and publications.
Methodology
Step 1 - Identification of Relevant Samples Size from Population Database


Step 2 - Approaches for Defining Global Market Size (Value, Volume* & Price*)

Note*: In applicable scenarios
Step 3 - Data Sources
Primary Research
- Web Analytics
- Survey Reports
- Research Institute
- Latest Research Reports
- Opinion Leaders
Secondary Research
- Annual Reports
- White Paper
- Latest Press Release
- Industry Association
- Paid Database
- Investor Presentations

Step 4 - Data Triangulation
Involves using different sources of information in order to increase the validity of a study
These sources are likely to be stakeholders in a program - participants, other researchers, program staff, other community members, and so on.
Then we put all data in single framework & apply various statistical tools to find out the dynamic on the market.
During the analysis stage, feedback from the stakeholder groups would be compared to determine areas of agreement as well as areas of divergence