
Key Insights
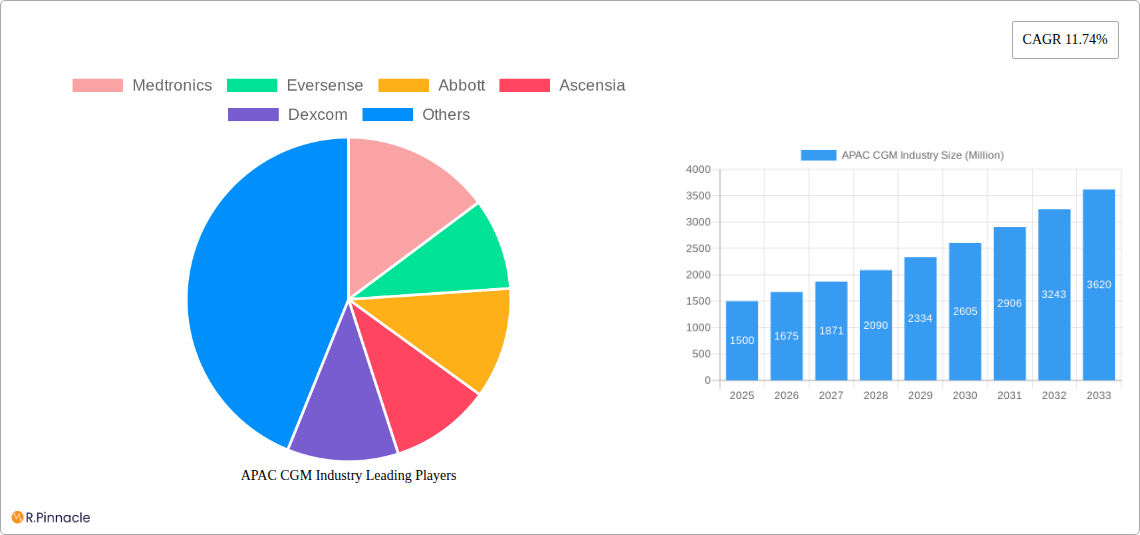
The Asia Pacific Continuous Glucose Monitoring (CGM) market is poised for significant expansion, projected to reach a substantial market size of USD 1,500 million by 2025, with an impressive Compound Annual Growth Rate (CAGR) of 11.74%. This robust growth is primarily fueled by increasing awareness and adoption of advanced diabetes management solutions across the region. Key drivers include the rising prevalence of diabetes, particularly Type 2, driven by lifestyle changes, aging populations, and genetic predispositions in countries like China and India. Furthermore, government initiatives promoting preventative healthcare and the growing disposable income of consumers are contributing to a higher demand for sophisticated CGM devices that offer real-time glucose readings and improved patient outcomes. The integration of Artificial Intelligence (AI) and Machine Learning (ML) into CGM systems, enabling predictive analytics and personalized treatment recommendations, represents a major trend, enhancing user experience and therapeutic efficacy.
However, the market is not without its restraints. The high cost of CGM devices and sensor replacements can be a significant barrier to widespread adoption, especially in developing economies within the APAC region. Limited reimbursement policies and a lack of insurance coverage for these advanced technologies in certain countries also hinder market penetration. Nevertheless, the increasing focus on remote patient monitoring and telehealth, accelerated by recent global health events, presents a significant opportunity for CGM manufacturers. The market is segmented by components, with Sensors and Durables being key product categories. Geographically, while South Korea, Japan, and Australia are currently leading in adoption due to higher healthcare spending and technological integration, countries like China and India are expected to witness the fastest growth rates due to their massive patient populations and increasing focus on diabetes management. The competitive landscape features major players such as Medtronics, Eversense, Abbott, Ascensia, and Dexcom, all vying for market share through product innovation and strategic partnerships.
APAC CGM Industry Market Outlook: Navigating Growth, Innovation, and Regional Dynamics (2019-2033)
This comprehensive report delves into the dynamic APAC Continuous Glucose Monitoring (CGM) industry, offering in-depth analysis and actionable insights for industry professionals, investors, and stakeholders. Covering the period from 2019 to 2033, with a base and estimated year of 2025, this report provides a detailed examination of market structure, dynamics, regional dominance, product innovations, and future trends. Leverage high-ranking keywords like "APAC CGM market," "continuous glucose monitoring Asia," "diabetes technology," and "MedTech Japan" to enhance search visibility.
APAC CGM Industry Market Structure & Innovation Trends
The APAC CGM market exhibits a moderately concentrated structure, with key players like Medtronics, Eversense, Abbott, Ascensia, and Dexcom holding significant market share. Innovation is a primary driver, fueled by advancements in sensor accuracy, miniaturization, and data analytics. Regulatory frameworks are evolving across the region, with countries like Japan and South Korea demonstrating proactive approaches to reimbursement and approval processes. Product substitutes, while present in traditional glucose monitoring, are increasingly being displaced by the superior convenience and insights offered by CGM. End-user demographics are shifting, with a growing aging population and rising prevalence of diabetes globally fueling demand. Mergers and acquisitions (M&A) activity, valued at approximately 500 Million in recent years, is anticipated to continue as larger players seek to consolidate market presence and acquire innovative technologies. The market share of leading players is estimated to be 70% collectively.
- Market Concentration: Moderate, with key players dominating.
- Innovation Drivers: Sensor technology, data integration, user-friendliness.
- Regulatory Frameworks: Varied, with increasing government support for diabetes management.
- Product Substitutes: Traditional blood glucose meters, declining in relevance.
- End-User Demographics: Aging population, increasing diabetes prevalence.
- M&A Activities: Expected to rise, driving consolidation. Deal values estimated at 500 Million.
APAC CGM Industry Market Dynamics & Trends
The APAC CGM market is poised for substantial growth, driven by a confluence of factors. A projected Compound Annual Growth Rate (CAGR) of 15% from 2025 to 2033 underscores its significant expansion potential. Technological disruptions are at the forefront, with innovations in non-invasive sensor technology and AI-powered predictive analytics transforming patient care. Consumer preferences are increasingly leaning towards proactive health management and user-friendly devices that offer real-time insights into glucose levels. This shift is propelling market penetration, which is estimated to reach 30% by 2033. Competitive dynamics are intensifying, with established players investing heavily in R&D and new entrants emerging with disruptive technologies. The rising burden of diabetes in the Asia-Pacific region, coupled with growing awareness and access to advanced healthcare solutions, are key market growth drivers. Furthermore, favorable government initiatives aimed at improving chronic disease management are providing a robust ecosystem for market expansion. The increasing adoption of telehealth and remote patient monitoring further amplifies the demand for CGM devices, enabling continuous oversight and personalized treatment adjustments.
Dominant Regions & Segments in APAC CGM Industry
Japan stands out as a dominant region in the APAC CGM industry, driven by a confluence of factors that foster rapid adoption and market maturity. The country's advanced healthcare infrastructure, coupled with a high prevalence of diabetes and a proactive approach to embracing innovative medical technologies, positions it as a leader. The reimbursement expansion for Abbott's FreeStyle Libre system in March 2022, covering all insulin-dependent individuals, is a testament to Japan's commitment to accessible CGM technology and a significant catalyst for market growth. The exclusive distribution agreement between Dexcom and Terumo Corporation for the Dexcom G6 in July 2021 further solidifies Japan's position as a key market for advanced CGM solutions.
Within the Component segmentation, Sensors represent the most critical and high-growth segment. The continuous innovation in sensor accuracy, longevity, and miniaturization directly impacts the overall performance and user experience of CGM devices. Advancements in materials science and microelectronics are enabling the development of next-generation sensors that are more comfortable, reliable, and cost-effective.
Key Drivers of Dominance in Japan:
- Favorable Reimbursement Policies: Expanded coverage accelerates patient access and adoption.
- Advanced Healthcare Infrastructure: High standard of medical care and technological adoption.
- High Diabetes Prevalence: A significant and growing patient population demanding effective management solutions.
- Technological Acumen: Strong receptiveness to cutting-edge medical devices.
- Strategic Partnerships: Collaborations between global manufacturers and local distributors enhance market reach.
The Rest of Asia-Pacific region, encompassing countries like China, India, South Korea, and Southeast Asian nations, presents substantial untapped potential and is emerging as a crucial growth engine. Rising disposable incomes, increasing health awareness, and a growing burden of diabetes in these populous nations are creating a fertile ground for CGM market expansion. Government initiatives focused on digital health and chronic disease management are also playing a pivotal role in fostering adoption.
APAC CGM Industry Product Innovations
Product innovation in the APAC CGM industry is characterized by advancements in sensor accuracy, user comfort, and data integration. Companies are developing smaller, less invasive, and longer-lasting sensors, alongside user-friendly mobile applications that provide real-time glucose data and personalized insights. The competitive advantage lies in seamless connectivity with insulin pumps, smart devices, and electronic health records, enabling a holistic approach to diabetes management. The focus is on creating intuitive and data-rich platforms that empower both patients and healthcare providers with actionable information, thereby improving glycemic control and reducing the risk of complications.
Report Scope & Segmentation Analysis
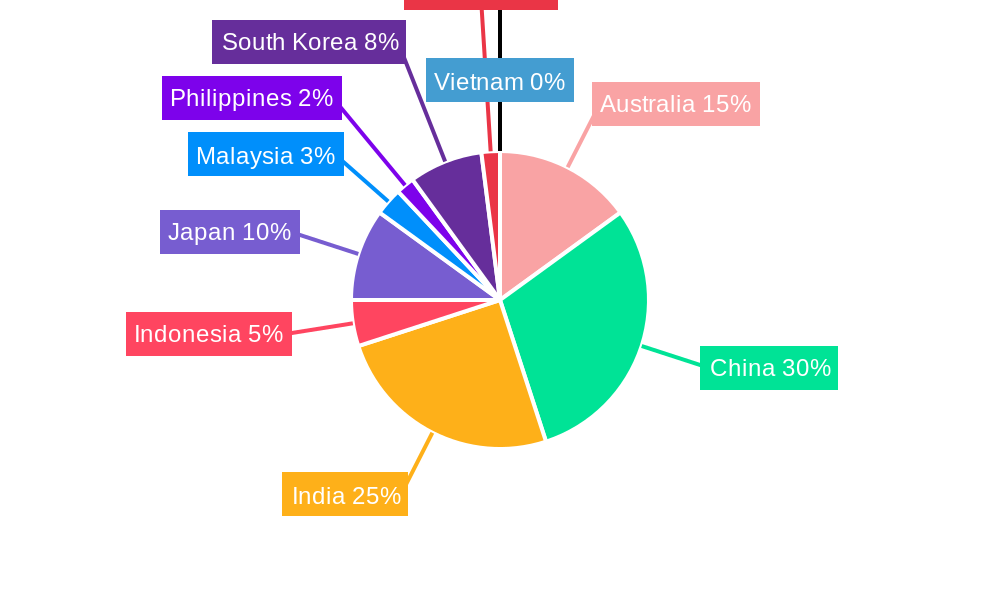
This report meticulously analyzes the APAC CGM industry across key segmentations. The Component segmentation includes Sensors and Durables, with Sensors projected to witness a CAGR of 16% due to continuous technological advancements, while Durables are expected to grow at a CAGR of 12%. Geographically, the analysis covers Australia, China, India, Indonesia, Japan, Malaysia, Philippines, South Korea, Thailand, Vietnam, and the Rest of Asia-Pacific. Japan is currently the dominant market, with a projected market share of 35% by 2028, while China and India are expected to exhibit the highest growth rates, with CAGRs exceeding 18%.
Key Drivers of APAC CGM Industry Growth
The APAC CGM industry's growth is propelled by several critical drivers. The escalating prevalence of diabetes across the region, fueled by lifestyle changes and an aging population, is the primary demand generator. Technological advancements in sensor accuracy, connectivity, and data analytics are making CGM devices more accessible and effective. Favorable government initiatives and increasing health awareness among the population are further stimulating market adoption. Moreover, expanded reimbursement policies in key markets like Japan are significantly improving patient affordability and access to these life-changing technologies.
Challenges in the APAC CGM Industry Sector
Despite robust growth, the APAC CGM industry faces several challenges. High device costs remain a significant barrier to widespread adoption, particularly in emerging economies. Evolving and fragmented regulatory landscapes across different countries can create hurdles for market entry and product approvals. Supply chain disruptions and the need for robust cold chain logistics for certain components also pose operational challenges. Intense competitive pressure and the need for continuous innovation to stay ahead of emerging technologies are constant demands on manufacturers. Furthermore, a lack of adequate healthcare infrastructure and trained professionals in some regions can limit the effective utilization of CGM devices.
Emerging Opportunities in APAC CGM Industry
Emerging opportunities in the APAC CGM industry are diverse and promising. The untapped potential in populous nations like China and India presents significant growth avenues as their healthcare systems mature and disposable incomes rise. Advancements in artificial intelligence and machine learning are opening doors for predictive analytics in diabetes management, offering personalized insights and early warnings of glycemic events. The increasing integration of CGM with other connected health devices and wearable technology is creating a more comprehensive health ecosystem. Furthermore, the development of more affordable and user-friendly CGM solutions specifically tailored for emerging markets could unlock massive patient segments.
Leading Players in the APAC CGM Industry Market
- Medtronics
- Eversense
- Abbott
- Ascensia
- Dexcom
Key Developments in APAC CGM Industry Industry
- March 2022: Abbott announced that it received expanded reimbursement coverage in Japan for the FreeStyle Libre system. Japan's Ministry of Health, Labor, and Welfare approved the expansion of the continuous glucose monitoring (CGM) system to include all people with diabetes who use insulin at least once per day.
- July 2021: Dexcom and Terumo Corporation signed an agreement for exclusively distributing Dexcom G6 across Japan.
Future Outlook for APAC CGM Industry Market
The future outlook for the APAC CGM industry is exceptionally bright, characterized by sustained high growth and transformative innovation. The increasing demand for advanced diabetes management solutions, coupled with supportive government policies and a growing emphasis on preventative healthcare, will continue to propel market expansion. Strategic investments in research and development to enhance sensor technology, data intelligence, and device connectivity will be crucial for sustained success. Expansion into underserved markets within the Asia-Pacific region, coupled with partnerships to improve affordability and accessibility, will unlock significant future market potential. The industry is set to play an increasingly vital role in improving the lives of millions of individuals living with diabetes across the APAC region.
APAC CGM Industry Segmentation
-
1. Component
- 1.1. Sensors
- 1.2. Durables
-
2. Geography
- 2.1. Australia
- 2.2. China
- 2.3. India
- 2.4. Indonesia
- 2.5. Japan
- 2.6. Malaysia
- 2.7. Philippines
- 2.8. South Korea
- 2.9. Thailand
- 2.10. Vietnam
- 2.11. Rest of Asia-Pacific
APAC CGM Industry Segmentation By Geography
- 1. Australia
- 2. China
- 3. India
- 4. Indonesia
- 5. Japan
- 6. Malaysia
- 7. Philippines
- 8. South Korea
- 9. Thailand
- 10. Vietnam
- 11. Rest of Asia Pacific
APAC CGM Industry REPORT HIGHLIGHTS
| Aspects | Details |
|---|---|
| Study Period | 2019-2033 |
| Base Year | 2024 |
| Estimated Year | 2025 |
| Forecast Period | 2025-2033 |
| Historical Period | 2019-2024 |
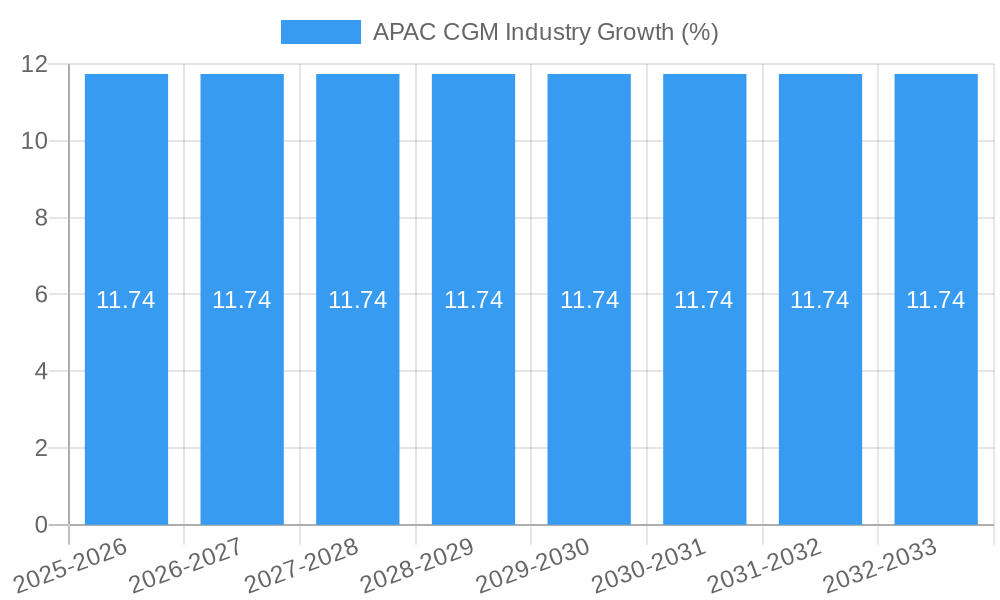
| Growth Rate | CAGR of 11.74% from 2019-2033 |
| Segmentation |
|
Table of Contents
- 1. Introduction
- 1.1. Research Scope
- 1.2. Market Segmentation
- 1.3. Research Methodology
- 1.4. Definitions and Assumptions
- 2. Executive Summary
- 2.1. Introduction
- 3. Market Dynamics
- 3.1. Introduction
- 3.2. Market Drivers
- 3.2.1. Growing Burden of Gastrointestinal Diseases; Rising Preference of Point of Care Test
- 3.3. Market Restrains
- 3.3.1. High Cost of Instruments
- 3.4. Market Trends
- 3.4.1. The sensors Segment is having the highest market share in Asia-Pacific Continuous Glucose Monitoring Market.
- 4. Market Factor Analysis
- 4.1. Porters Five Forces
- 4.2. Supply/Value Chain
- 4.3. PESTEL analysis
- 4.4. Market Entropy
- 4.5. Patent/Trademark Analysis
- 5. Global APAC CGM Industry Analysis, Insights and Forecast, 2019-2031
- 5.1. Market Analysis, Insights and Forecast - by Component
- 5.1.1. Sensors
- 5.1.2. Durables
- 5.2. Market Analysis, Insights and Forecast - by Geography
- 5.2.1. Australia
- 5.2.2. China
- 5.2.3. India
- 5.2.4. Indonesia
- 5.2.5. Japan
- 5.2.6. Malaysia
- 5.2.7. Philippines
- 5.2.8. South Korea
- 5.2.9. Thailand
- 5.2.10. Vietnam
- 5.2.11. Rest of Asia-Pacific
- 5.3. Market Analysis, Insights and Forecast - by Region
- 5.3.1. Australia
- 5.3.2. China
- 5.3.3. India
- 5.3.4. Indonesia
- 5.3.5. Japan
- 5.3.6. Malaysia
- 5.3.7. Philippines
- 5.3.8. South Korea
- 5.3.9. Thailand
- 5.3.10. Vietnam
- 5.3.11. Rest of Asia Pacific
- 5.1. Market Analysis, Insights and Forecast - by Component
- 6. Australia APAC CGM Industry Analysis, Insights and Forecast, 2019-2031
- 6.1. Market Analysis, Insights and Forecast - by Component
- 6.1.1. Sensors
- 6.1.2. Durables
- 6.2. Market Analysis, Insights and Forecast - by Geography
- 6.2.1. Australia
- 6.2.2. China
- 6.2.3. India
- 6.2.4. Indonesia
- 6.2.5. Japan
- 6.2.6. Malaysia
- 6.2.7. Philippines
- 6.2.8. South Korea
- 6.2.9. Thailand
- 6.2.10. Vietnam
- 6.2.11. Rest of Asia-Pacific
- 6.1. Market Analysis, Insights and Forecast - by Component
- 7. China APAC CGM Industry Analysis, Insights and Forecast, 2019-2031
- 7.1. Market Analysis, Insights and Forecast - by Component
- 7.1.1. Sensors
- 7.1.2. Durables
- 7.2. Market Analysis, Insights and Forecast - by Geography
- 7.2.1. Australia
- 7.2.2. China
- 7.2.3. India
- 7.2.4. Indonesia
- 7.2.5. Japan
- 7.2.6. Malaysia
- 7.2.7. Philippines
- 7.2.8. South Korea
- 7.2.9. Thailand
- 7.2.10. Vietnam
- 7.2.11. Rest of Asia-Pacific
- 7.1. Market Analysis, Insights and Forecast - by Component
- 8. India APAC CGM Industry Analysis, Insights and Forecast, 2019-2031
- 8.1. Market Analysis, Insights and Forecast - by Component
- 8.1.1. Sensors
- 8.1.2. Durables
- 8.2. Market Analysis, Insights and Forecast - by Geography
- 8.2.1. Australia
- 8.2.2. China
- 8.2.3. India
- 8.2.4. Indonesia
- 8.2.5. Japan
- 8.2.6. Malaysia
- 8.2.7. Philippines
- 8.2.8. South Korea
- 8.2.9. Thailand
- 8.2.10. Vietnam
- 8.2.11. Rest of Asia-Pacific
- 8.1. Market Analysis, Insights and Forecast - by Component
- 9. Indonesia APAC CGM Industry Analysis, Insights and Forecast, 2019-2031
- 9.1. Market Analysis, Insights and Forecast - by Component
- 9.1.1. Sensors
- 9.1.2. Durables
- 9.2. Market Analysis, Insights and Forecast - by Geography
- 9.2.1. Australia
- 9.2.2. China
- 9.2.3. India
- 9.2.4. Indonesia
- 9.2.5. Japan
- 9.2.6. Malaysia
- 9.2.7. Philippines
- 9.2.8. South Korea
- 9.2.9. Thailand
- 9.2.10. Vietnam
- 9.2.11. Rest of Asia-Pacific
- 9.1. Market Analysis, Insights and Forecast - by Component
- 10. Japan APAC CGM Industry Analysis, Insights and Forecast, 2019-2031
- 10.1. Market Analysis, Insights and Forecast - by Component
- 10.1.1. Sensors
- 10.1.2. Durables
- 10.2. Market Analysis, Insights and Forecast - by Geography
- 10.2.1. Australia
- 10.2.2. China
- 10.2.3. India
- 10.2.4. Indonesia
- 10.2.5. Japan
- 10.2.6. Malaysia
- 10.2.7. Philippines
- 10.2.8. South Korea
- 10.2.9. Thailand
- 10.2.10. Vietnam
- 10.2.11. Rest of Asia-Pacific
- 10.1. Market Analysis, Insights and Forecast - by Component
- 11. Malaysia APAC CGM Industry Analysis, Insights and Forecast, 2019-2031
- 11.1. Market Analysis, Insights and Forecast - by Component
- 11.1.1. Sensors
- 11.1.2. Durables
- 11.2. Market Analysis, Insights and Forecast - by Geography
- 11.2.1. Australia
- 11.2.2. China
- 11.2.3. India
- 11.2.4. Indonesia
- 11.2.5. Japan
- 11.2.6. Malaysia
- 11.2.7. Philippines
- 11.2.8. South Korea
- 11.2.9. Thailand
- 11.2.10. Vietnam
- 11.2.11. Rest of Asia-Pacific
- 11.1. Market Analysis, Insights and Forecast - by Component
- 12. Philippines APAC CGM Industry Analysis, Insights and Forecast, 2019-2031
- 12.1. Market Analysis, Insights and Forecast - by Component
- 12.1.1. Sensors
- 12.1.2. Durables
- 12.2. Market Analysis, Insights and Forecast - by Geography
- 12.2.1. Australia
- 12.2.2. China
- 12.2.3. India
- 12.2.4. Indonesia
- 12.2.5. Japan
- 12.2.6. Malaysia
- 12.2.7. Philippines
- 12.2.8. South Korea
- 12.2.9. Thailand
- 12.2.10. Vietnam
- 12.2.11. Rest of Asia-Pacific
- 12.1. Market Analysis, Insights and Forecast - by Component
- 13. South Korea APAC CGM Industry Analysis, Insights and Forecast, 2019-2031
- 13.1. Market Analysis, Insights and Forecast - by Component
- 13.1.1. Sensors
- 13.1.2. Durables
- 13.2. Market Analysis, Insights and Forecast - by Geography
- 13.2.1. Australia
- 13.2.2. China
- 13.2.3. India
- 13.2.4. Indonesia
- 13.2.5. Japan
- 13.2.6. Malaysia
- 13.2.7. Philippines
- 13.2.8. South Korea
- 13.2.9. Thailand
- 13.2.10. Vietnam
- 13.2.11. Rest of Asia-Pacific
- 13.1. Market Analysis, Insights and Forecast - by Component
- 14. Thailand APAC CGM Industry Analysis, Insights and Forecast, 2019-2031
- 14.1. Market Analysis, Insights and Forecast - by Component
- 14.1.1. Sensors
- 14.1.2. Durables
- 14.2. Market Analysis, Insights and Forecast - by Geography
- 14.2.1. Australia
- 14.2.2. China
- 14.2.3. India
- 14.2.4. Indonesia
- 14.2.5. Japan
- 14.2.6. Malaysia
- 14.2.7. Philippines
- 14.2.8. South Korea
- 14.2.9. Thailand
- 14.2.10. Vietnam
- 14.2.11. Rest of Asia-Pacific
- 14.1. Market Analysis, Insights and Forecast - by Component
- 15. Vietnam APAC CGM Industry Analysis, Insights and Forecast, 2019-2031
- 15.1. Market Analysis, Insights and Forecast - by Component
- 15.1.1. Sensors
- 15.1.2. Durables
- 15.2. Market Analysis, Insights and Forecast - by Geography
- 15.2.1. Australia
- 15.2.2. China
- 15.2.3. India
- 15.2.4. Indonesia
- 15.2.5. Japan
- 15.2.6. Malaysia
- 15.2.7. Philippines
- 15.2.8. South Korea
- 15.2.9. Thailand
- 15.2.10. Vietnam
- 15.2.11. Rest of Asia-Pacific
- 15.1. Market Analysis, Insights and Forecast - by Component
- 16. Rest of Asia Pacific APAC CGM Industry Analysis, Insights and Forecast, 2019-2031
- 16.1. Market Analysis, Insights and Forecast - by Component
- 16.1.1. Sensors
- 16.1.2. Durables
- 16.2. Market Analysis, Insights and Forecast - by Geography
- 16.2.1. Australia
- 16.2.2. China
- 16.2.3. India
- 16.2.4. Indonesia
- 16.2.5. Japan
- 16.2.6. Malaysia
- 16.2.7. Philippines
- 16.2.8. South Korea
- 16.2.9. Thailand
- 16.2.10. Vietnam
- 16.2.11. Rest of Asia-Pacific
- 16.1. Market Analysis, Insights and Forecast - by Component
- 17. China APAC CGM Industry Analysis, Insights and Forecast, 2019-2031
- 18. Japan APAC CGM Industry Analysis, Insights and Forecast, 2019-2031
- 19. India APAC CGM Industry Analysis, Insights and Forecast, 2019-2031
- 20. South Korea APAC CGM Industry Analysis, Insights and Forecast, 2019-2031
- 21. Taiwan APAC CGM Industry Analysis, Insights and Forecast, 2019-2031
- 22. Australia APAC CGM Industry Analysis, Insights and Forecast, 2019-2031
- 23. Rest of Asia-Pacific APAC CGM Industry Analysis, Insights and Forecast, 2019-2031
- 24. Competitive Analysis
- 24.1. Global Market Share Analysis 2024
- 24.2. Company Profiles
- 24.2.1 Medtronics
- 24.2.1.1. Overview
- 24.2.1.2. Products
- 24.2.1.3. SWOT Analysis
- 24.2.1.4. Recent Developments
- 24.2.1.5. Financials (Based on Availability)
- 24.2.2 Eversense
- 24.2.2.1. Overview
- 24.2.2.2. Products
- 24.2.2.3. SWOT Analysis
- 24.2.2.4. Recent Developments
- 24.2.2.5. Financials (Based on Availability)
- 24.2.3 Abbott
- 24.2.3.1. Overview
- 24.2.3.2. Products
- 24.2.3.3. SWOT Analysis
- 24.2.3.4. Recent Developments
- 24.2.3.5. Financials (Based on Availability)
- 24.2.4 Ascensia
- 24.2.4.1. Overview
- 24.2.4.2. Products
- 24.2.4.3. SWOT Analysis
- 24.2.4.4. Recent Developments
- 24.2.4.5. Financials (Based on Availability)
- 24.2.5 Dexcom
- 24.2.5.1. Overview
- 24.2.5.2. Products
- 24.2.5.3. SWOT Analysis
- 24.2.5.4. Recent Developments
- 24.2.5.5. Financials (Based on Availability)
- 24.2.1 Medtronics
List of Figures
- Figure 1: Global APAC CGM Industry Revenue Breakdown (Million, %) by Region 2024 & 2032
- Figure 2: Global APAC CGM Industry Volume Breakdown (K Unit, %) by Region 2024 & 2032
- Figure 3: Asia Pacific APAC CGM Industry Revenue (Million), by Country 2024 & 2032
- Figure 4: Asia Pacific APAC CGM Industry Volume (K Unit), by Country 2024 & 2032
- Figure 5: Asia Pacific APAC CGM Industry Revenue Share (%), by Country 2024 & 2032
- Figure 6: Asia Pacific APAC CGM Industry Volume Share (%), by Country 2024 & 2032
- Figure 7: Australia APAC CGM Industry Revenue (Million), by Component 2024 & 2032
- Figure 8: Australia APAC CGM Industry Volume (K Unit), by Component 2024 & 2032
- Figure 9: Australia APAC CGM Industry Revenue Share (%), by Component 2024 & 2032
- Figure 10: Australia APAC CGM Industry Volume Share (%), by Component 2024 & 2032
- Figure 11: Australia APAC CGM Industry Revenue (Million), by Geography 2024 & 2032
- Figure 12: Australia APAC CGM Industry Volume (K Unit), by Geography 2024 & 2032
- Figure 13: Australia APAC CGM Industry Revenue Share (%), by Geography 2024 & 2032
- Figure 14: Australia APAC CGM Industry Volume Share (%), by Geography 2024 & 2032
- Figure 15: Australia APAC CGM Industry Revenue (Million), by Country 2024 & 2032
- Figure 16: Australia APAC CGM Industry Volume (K Unit), by Country 2024 & 2032
- Figure 17: Australia APAC CGM Industry Revenue Share (%), by Country 2024 & 2032
- Figure 18: Australia APAC CGM Industry Volume Share (%), by Country 2024 & 2032
- Figure 19: China APAC CGM Industry Revenue (Million), by Component 2024 & 2032
- Figure 20: China APAC CGM Industry Volume (K Unit), by Component 2024 & 2032
- Figure 21: China APAC CGM Industry Revenue Share (%), by Component 2024 & 2032
- Figure 22: China APAC CGM Industry Volume Share (%), by Component 2024 & 2032
- Figure 23: China APAC CGM Industry Revenue (Million), by Geography 2024 & 2032
- Figure 24: China APAC CGM Industry Volume (K Unit), by Geography 2024 & 2032
- Figure 25: China APAC CGM Industry Revenue Share (%), by Geography 2024 & 2032
- Figure 26: China APAC CGM Industry Volume Share (%), by Geography 2024 & 2032
- Figure 27: China APAC CGM Industry Revenue (Million), by Country 2024 & 2032
- Figure 28: China APAC CGM Industry Volume (K Unit), by Country 2024 & 2032
- Figure 29: China APAC CGM Industry Revenue Share (%), by Country 2024 & 2032
- Figure 30: China APAC CGM Industry Volume Share (%), by Country 2024 & 2032
- Figure 31: India APAC CGM Industry Revenue (Million), by Component 2024 & 2032
- Figure 32: India APAC CGM Industry Volume (K Unit), by Component 2024 & 2032
- Figure 33: India APAC CGM Industry Revenue Share (%), by Component 2024 & 2032
- Figure 34: India APAC CGM Industry Volume Share (%), by Component 2024 & 2032
- Figure 35: India APAC CGM Industry Revenue (Million), by Geography 2024 & 2032
- Figure 36: India APAC CGM Industry Volume (K Unit), by Geography 2024 & 2032
- Figure 37: India APAC CGM Industry Revenue Share (%), by Geography 2024 & 2032
- Figure 38: India APAC CGM Industry Volume Share (%), by Geography 2024 & 2032
- Figure 39: India APAC CGM Industry Revenue (Million), by Country 2024 & 2032
- Figure 40: India APAC CGM Industry Volume (K Unit), by Country 2024 & 2032
- Figure 41: India APAC CGM Industry Revenue Share (%), by Country 2024 & 2032
- Figure 42: India APAC CGM Industry Volume Share (%), by Country 2024 & 2032
- Figure 43: Indonesia APAC CGM Industry Revenue (Million), by Component 2024 & 2032
- Figure 44: Indonesia APAC CGM Industry Volume (K Unit), by Component 2024 & 2032
- Figure 45: Indonesia APAC CGM Industry Revenue Share (%), by Component 2024 & 2032
- Figure 46: Indonesia APAC CGM Industry Volume Share (%), by Component 2024 & 2032
- Figure 47: Indonesia APAC CGM Industry Revenue (Million), by Geography 2024 & 2032
- Figure 48: Indonesia APAC CGM Industry Volume (K Unit), by Geography 2024 & 2032
- Figure 49: Indonesia APAC CGM Industry Revenue Share (%), by Geography 2024 & 2032
- Figure 50: Indonesia APAC CGM Industry Volume Share (%), by Geography 2024 & 2032
- Figure 51: Indonesia APAC CGM Industry Revenue (Million), by Country 2024 & 2032
- Figure 52: Indonesia APAC CGM Industry Volume (K Unit), by Country 2024 & 2032
- Figure 53: Indonesia APAC CGM Industry Revenue Share (%), by Country 2024 & 2032
- Figure 54: Indonesia APAC CGM Industry Volume Share (%), by Country 2024 & 2032
- Figure 55: Japan APAC CGM Industry Revenue (Million), by Component 2024 & 2032
- Figure 56: Japan APAC CGM Industry Volume (K Unit), by Component 2024 & 2032
- Figure 57: Japan APAC CGM Industry Revenue Share (%), by Component 2024 & 2032
- Figure 58: Japan APAC CGM Industry Volume Share (%), by Component 2024 & 2032
- Figure 59: Japan APAC CGM Industry Revenue (Million), by Geography 2024 & 2032
- Figure 60: Japan APAC CGM Industry Volume (K Unit), by Geography 2024 & 2032
- Figure 61: Japan APAC CGM Industry Revenue Share (%), by Geography 2024 & 2032
- Figure 62: Japan APAC CGM Industry Volume Share (%), by Geography 2024 & 2032
- Figure 63: Japan APAC CGM Industry Revenue (Million), by Country 2024 & 2032
- Figure 64: Japan APAC CGM Industry Volume (K Unit), by Country 2024 & 2032
- Figure 65: Japan APAC CGM Industry Revenue Share (%), by Country 2024 & 2032
- Figure 66: Japan APAC CGM Industry Volume Share (%), by Country 2024 & 2032
- Figure 67: Malaysia APAC CGM Industry Revenue (Million), by Component 2024 & 2032
- Figure 68: Malaysia APAC CGM Industry Volume (K Unit), by Component 2024 & 2032
- Figure 69: Malaysia APAC CGM Industry Revenue Share (%), by Component 2024 & 2032
- Figure 70: Malaysia APAC CGM Industry Volume Share (%), by Component 2024 & 2032
- Figure 71: Malaysia APAC CGM Industry Revenue (Million), by Geography 2024 & 2032
- Figure 72: Malaysia APAC CGM Industry Volume (K Unit), by Geography 2024 & 2032
- Figure 73: Malaysia APAC CGM Industry Revenue Share (%), by Geography 2024 & 2032
- Figure 74: Malaysia APAC CGM Industry Volume Share (%), by Geography 2024 & 2032
- Figure 75: Malaysia APAC CGM Industry Revenue (Million), by Country 2024 & 2032
- Figure 76: Malaysia APAC CGM Industry Volume (K Unit), by Country 2024 & 2032
- Figure 77: Malaysia APAC CGM Industry Revenue Share (%), by Country 2024 & 2032
- Figure 78: Malaysia APAC CGM Industry Volume Share (%), by Country 2024 & 2032
- Figure 79: Philippines APAC CGM Industry Revenue (Million), by Component 2024 & 2032
- Figure 80: Philippines APAC CGM Industry Volume (K Unit), by Component 2024 & 2032
- Figure 81: Philippines APAC CGM Industry Revenue Share (%), by Component 2024 & 2032
- Figure 82: Philippines APAC CGM Industry Volume Share (%), by Component 2024 & 2032
- Figure 83: Philippines APAC CGM Industry Revenue (Million), by Geography 2024 & 2032
- Figure 84: Philippines APAC CGM Industry Volume (K Unit), by Geography 2024 & 2032
- Figure 85: Philippines APAC CGM Industry Revenue Share (%), by Geography 2024 & 2032
- Figure 86: Philippines APAC CGM Industry Volume Share (%), by Geography 2024 & 2032
- Figure 87: Philippines APAC CGM Industry Revenue (Million), by Country 2024 & 2032
- Figure 88: Philippines APAC CGM Industry Volume (K Unit), by Country 2024 & 2032
- Figure 89: Philippines APAC CGM Industry Revenue Share (%), by Country 2024 & 2032
- Figure 90: Philippines APAC CGM Industry Volume Share (%), by Country 2024 & 2032
- Figure 91: South Korea APAC CGM Industry Revenue (Million), by Component 2024 & 2032
- Figure 92: South Korea APAC CGM Industry Volume (K Unit), by Component 2024 & 2032
- Figure 93: South Korea APAC CGM Industry Revenue Share (%), by Component 2024 & 2032
- Figure 94: South Korea APAC CGM Industry Volume Share (%), by Component 2024 & 2032
- Figure 95: South Korea APAC CGM Industry Revenue (Million), by Geography 2024 & 2032
- Figure 96: South Korea APAC CGM Industry Volume (K Unit), by Geography 2024 & 2032
- Figure 97: South Korea APAC CGM Industry Revenue Share (%), by Geography 2024 & 2032
- Figure 98: South Korea APAC CGM Industry Volume Share (%), by Geography 2024 & 2032
- Figure 99: South Korea APAC CGM Industry Revenue (Million), by Country 2024 & 2032
- Figure 100: South Korea APAC CGM Industry Volume (K Unit), by Country 2024 & 2032
- Figure 101: South Korea APAC CGM Industry Revenue Share (%), by Country 2024 & 2032
- Figure 102: South Korea APAC CGM Industry Volume Share (%), by Country 2024 & 2032
- Figure 103: Thailand APAC CGM Industry Revenue (Million), by Component 2024 & 2032
- Figure 104: Thailand APAC CGM Industry Volume (K Unit), by Component 2024 & 2032
- Figure 105: Thailand APAC CGM Industry Revenue Share (%), by Component 2024 & 2032
- Figure 106: Thailand APAC CGM Industry Volume Share (%), by Component 2024 & 2032
- Figure 107: Thailand APAC CGM Industry Revenue (Million), by Geography 2024 & 2032
- Figure 108: Thailand APAC CGM Industry Volume (K Unit), by Geography 2024 & 2032
- Figure 109: Thailand APAC CGM Industry Revenue Share (%), by Geography 2024 & 2032
- Figure 110: Thailand APAC CGM Industry Volume Share (%), by Geography 2024 & 2032
- Figure 111: Thailand APAC CGM Industry Revenue (Million), by Country 2024 & 2032
- Figure 112: Thailand APAC CGM Industry Volume (K Unit), by Country 2024 & 2032
- Figure 113: Thailand APAC CGM Industry Revenue Share (%), by Country 2024 & 2032
- Figure 114: Thailand APAC CGM Industry Volume Share (%), by Country 2024 & 2032
- Figure 115: Vietnam APAC CGM Industry Revenue (Million), by Component 2024 & 2032
- Figure 116: Vietnam APAC CGM Industry Volume (K Unit), by Component 2024 & 2032
- Figure 117: Vietnam APAC CGM Industry Revenue Share (%), by Component 2024 & 2032
- Figure 118: Vietnam APAC CGM Industry Volume Share (%), by Component 2024 & 2032
- Figure 119: Vietnam APAC CGM Industry Revenue (Million), by Geography 2024 & 2032
- Figure 120: Vietnam APAC CGM Industry Volume (K Unit), by Geography 2024 & 2032
- Figure 121: Vietnam APAC CGM Industry Revenue Share (%), by Geography 2024 & 2032
- Figure 122: Vietnam APAC CGM Industry Volume Share (%), by Geography 2024 & 2032
- Figure 123: Vietnam APAC CGM Industry Revenue (Million), by Country 2024 & 2032
- Figure 124: Vietnam APAC CGM Industry Volume (K Unit), by Country 2024 & 2032
- Figure 125: Vietnam APAC CGM Industry Revenue Share (%), by Country 2024 & 2032
- Figure 126: Vietnam APAC CGM Industry Volume Share (%), by Country 2024 & 2032
- Figure 127: Rest of Asia Pacific APAC CGM Industry Revenue (Million), by Component 2024 & 2032
- Figure 128: Rest of Asia Pacific APAC CGM Industry Volume (K Unit), by Component 2024 & 2032
- Figure 129: Rest of Asia Pacific APAC CGM Industry Revenue Share (%), by Component 2024 & 2032
- Figure 130: Rest of Asia Pacific APAC CGM Industry Volume Share (%), by Component 2024 & 2032
- Figure 131: Rest of Asia Pacific APAC CGM Industry Revenue (Million), by Geography 2024 & 2032
- Figure 132: Rest of Asia Pacific APAC CGM Industry Volume (K Unit), by Geography 2024 & 2032
- Figure 133: Rest of Asia Pacific APAC CGM Industry Revenue Share (%), by Geography 2024 & 2032
- Figure 134: Rest of Asia Pacific APAC CGM Industry Volume Share (%), by Geography 2024 & 2032
- Figure 135: Rest of Asia Pacific APAC CGM Industry Revenue (Million), by Country 2024 & 2032
- Figure 136: Rest of Asia Pacific APAC CGM Industry Volume (K Unit), by Country 2024 & 2032
- Figure 137: Rest of Asia Pacific APAC CGM Industry Revenue Share (%), by Country 2024 & 2032
- Figure 138: Rest of Asia Pacific APAC CGM Industry Volume Share (%), by Country 2024 & 2032
List of Tables
- Table 1: Global APAC CGM Industry Revenue Million Forecast, by Region 2019 & 2032
- Table 2: Global APAC CGM Industry Volume K Unit Forecast, by Region 2019 & 2032
- Table 3: Global APAC CGM Industry Revenue Million Forecast, by Component 2019 & 2032
- Table 4: Global APAC CGM Industry Volume K Unit Forecast, by Component 2019 & 2032
- Table 5: Global APAC CGM Industry Revenue Million Forecast, by Geography 2019 & 2032
- Table 6: Global APAC CGM Industry Volume K Unit Forecast, by Geography 2019 & 2032
- Table 7: Global APAC CGM Industry Revenue Million Forecast, by Region 2019 & 2032
- Table 8: Global APAC CGM Industry Volume K Unit Forecast, by Region 2019 & 2032
- Table 9: Global APAC CGM Industry Revenue Million Forecast, by Country 2019 & 2032
- Table 10: Global APAC CGM Industry Volume K Unit Forecast, by Country 2019 & 2032
- Table 11: China APAC CGM Industry Revenue (Million) Forecast, by Application 2019 & 2032
- Table 12: China APAC CGM Industry Volume (K Unit) Forecast, by Application 2019 & 2032
- Table 13: Japan APAC CGM Industry Revenue (Million) Forecast, by Application 2019 & 2032
- Table 14: Japan APAC CGM Industry Volume (K Unit) Forecast, by Application 2019 & 2032
- Table 15: India APAC CGM Industry Revenue (Million) Forecast, by Application 2019 & 2032
- Table 16: India APAC CGM Industry Volume (K Unit) Forecast, by Application 2019 & 2032
- Table 17: South Korea APAC CGM Industry Revenue (Million) Forecast, by Application 2019 & 2032
- Table 18: South Korea APAC CGM Industry Volume (K Unit) Forecast, by Application 2019 & 2032
- Table 19: Taiwan APAC CGM Industry Revenue (Million) Forecast, by Application 2019 & 2032
- Table 20: Taiwan APAC CGM Industry Volume (K Unit) Forecast, by Application 2019 & 2032
- Table 21: Australia APAC CGM Industry Revenue (Million) Forecast, by Application 2019 & 2032
- Table 22: Australia APAC CGM Industry Volume (K Unit) Forecast, by Application 2019 & 2032
- Table 23: Rest of Asia-Pacific APAC CGM Industry Revenue (Million) Forecast, by Application 2019 & 2032
- Table 24: Rest of Asia-Pacific APAC CGM Industry Volume (K Unit) Forecast, by Application 2019 & 2032
- Table 25: Global APAC CGM Industry Revenue Million Forecast, by Component 2019 & 2032
- Table 26: Global APAC CGM Industry Volume K Unit Forecast, by Component 2019 & 2032
- Table 27: Global APAC CGM Industry Revenue Million Forecast, by Geography 2019 & 2032
- Table 28: Global APAC CGM Industry Volume K Unit Forecast, by Geography 2019 & 2032
- Table 29: Global APAC CGM Industry Revenue Million Forecast, by Country 2019 & 2032
- Table 30: Global APAC CGM Industry Volume K Unit Forecast, by Country 2019 & 2032
- Table 31: Global APAC CGM Industry Revenue Million Forecast, by Component 2019 & 2032
- Table 32: Global APAC CGM Industry Volume K Unit Forecast, by Component 2019 & 2032
- Table 33: Global APAC CGM Industry Revenue Million Forecast, by Geography 2019 & 2032
- Table 34: Global APAC CGM Industry Volume K Unit Forecast, by Geography 2019 & 2032
- Table 35: Global APAC CGM Industry Revenue Million Forecast, by Country 2019 & 2032
- Table 36: Global APAC CGM Industry Volume K Unit Forecast, by Country 2019 & 2032
- Table 37: Global APAC CGM Industry Revenue Million Forecast, by Component 2019 & 2032
- Table 38: Global APAC CGM Industry Volume K Unit Forecast, by Component 2019 & 2032
- Table 39: Global APAC CGM Industry Revenue Million Forecast, by Geography 2019 & 2032
- Table 40: Global APAC CGM Industry Volume K Unit Forecast, by Geography 2019 & 2032
- Table 41: Global APAC CGM Industry Revenue Million Forecast, by Country 2019 & 2032
- Table 42: Global APAC CGM Industry Volume K Unit Forecast, by Country 2019 & 2032
- Table 43: Global APAC CGM Industry Revenue Million Forecast, by Component 2019 & 2032
- Table 44: Global APAC CGM Industry Volume K Unit Forecast, by Component 2019 & 2032
- Table 45: Global APAC CGM Industry Revenue Million Forecast, by Geography 2019 & 2032
- Table 46: Global APAC CGM Industry Volume K Unit Forecast, by Geography 2019 & 2032
- Table 47: Global APAC CGM Industry Revenue Million Forecast, by Country 2019 & 2032
- Table 48: Global APAC CGM Industry Volume K Unit Forecast, by Country 2019 & 2032
- Table 49: Global APAC CGM Industry Revenue Million Forecast, by Component 2019 & 2032
- Table 50: Global APAC CGM Industry Volume K Unit Forecast, by Component 2019 & 2032
- Table 51: Global APAC CGM Industry Revenue Million Forecast, by Geography 2019 & 2032
- Table 52: Global APAC CGM Industry Volume K Unit Forecast, by Geography 2019 & 2032
- Table 53: Global APAC CGM Industry Revenue Million Forecast, by Country 2019 & 2032
- Table 54: Global APAC CGM Industry Volume K Unit Forecast, by Country 2019 & 2032
- Table 55: Global APAC CGM Industry Revenue Million Forecast, by Component 2019 & 2032
- Table 56: Global APAC CGM Industry Volume K Unit Forecast, by Component 2019 & 2032
- Table 57: Global APAC CGM Industry Revenue Million Forecast, by Geography 2019 & 2032
- Table 58: Global APAC CGM Industry Volume K Unit Forecast, by Geography 2019 & 2032
- Table 59: Global APAC CGM Industry Revenue Million Forecast, by Country 2019 & 2032
- Table 60: Global APAC CGM Industry Volume K Unit Forecast, by Country 2019 & 2032
- Table 61: Global APAC CGM Industry Revenue Million Forecast, by Component 2019 & 2032
- Table 62: Global APAC CGM Industry Volume K Unit Forecast, by Component 2019 & 2032
- Table 63: Global APAC CGM Industry Revenue Million Forecast, by Geography 2019 & 2032
- Table 64: Global APAC CGM Industry Volume K Unit Forecast, by Geography 2019 & 2032
- Table 65: Global APAC CGM Industry Revenue Million Forecast, by Country 2019 & 2032
- Table 66: Global APAC CGM Industry Volume K Unit Forecast, by Country 2019 & 2032
- Table 67: Global APAC CGM Industry Revenue Million Forecast, by Component 2019 & 2032
- Table 68: Global APAC CGM Industry Volume K Unit Forecast, by Component 2019 & 2032
- Table 69: Global APAC CGM Industry Revenue Million Forecast, by Geography 2019 & 2032
- Table 70: Global APAC CGM Industry Volume K Unit Forecast, by Geography 2019 & 2032
- Table 71: Global APAC CGM Industry Revenue Million Forecast, by Country 2019 & 2032
- Table 72: Global APAC CGM Industry Volume K Unit Forecast, by Country 2019 & 2032
- Table 73: Global APAC CGM Industry Revenue Million Forecast, by Component 2019 & 2032
- Table 74: Global APAC CGM Industry Volume K Unit Forecast, by Component 2019 & 2032
- Table 75: Global APAC CGM Industry Revenue Million Forecast, by Geography 2019 & 2032
- Table 76: Global APAC CGM Industry Volume K Unit Forecast, by Geography 2019 & 2032
- Table 77: Global APAC CGM Industry Revenue Million Forecast, by Country 2019 & 2032
- Table 78: Global APAC CGM Industry Volume K Unit Forecast, by Country 2019 & 2032
- Table 79: Global APAC CGM Industry Revenue Million Forecast, by Component 2019 & 2032
- Table 80: Global APAC CGM Industry Volume K Unit Forecast, by Component 2019 & 2032
- Table 81: Global APAC CGM Industry Revenue Million Forecast, by Geography 2019 & 2032
- Table 82: Global APAC CGM Industry Volume K Unit Forecast, by Geography 2019 & 2032
- Table 83: Global APAC CGM Industry Revenue Million Forecast, by Country 2019 & 2032
- Table 84: Global APAC CGM Industry Volume K Unit Forecast, by Country 2019 & 2032
- Table 85: Global APAC CGM Industry Revenue Million Forecast, by Component 2019 & 2032
- Table 86: Global APAC CGM Industry Volume K Unit Forecast, by Component 2019 & 2032
- Table 87: Global APAC CGM Industry Revenue Million Forecast, by Geography 2019 & 2032
- Table 88: Global APAC CGM Industry Volume K Unit Forecast, by Geography 2019 & 2032
- Table 89: Global APAC CGM Industry Revenue Million Forecast, by Country 2019 & 2032
- Table 90: Global APAC CGM Industry Volume K Unit Forecast, by Country 2019 & 2032
Frequently Asked Questions
1. What is the projected Compound Annual Growth Rate (CAGR) of the APAC CGM Industry?
The projected CAGR is approximately 11.74%.
2. Which companies are prominent players in the APAC CGM Industry?
Key companies in the market include Medtronics, Eversense, Abbott, Ascensia, Dexcom.
3. What are the main segments of the APAC CGM Industry?
The market segments include Component, Geography.
4. Can you provide details about the market size?
The market size is estimated to be USD XX Million as of 2022.
5. What are some drivers contributing to market growth?
Growing Burden of Gastrointestinal Diseases; Rising Preference of Point of Care Test.
6. What are the notable trends driving market growth?
The sensors Segment is having the highest market share in Asia-Pacific Continuous Glucose Monitoring Market..
7. Are there any restraints impacting market growth?
High Cost of Instruments.
8. Can you provide examples of recent developments in the market?
March 2022: Abbott announced that it received expanded reimbursement coverage in Japan for the FreeStyle Libre system. Japan's Ministry of Health, Labor, and Welfare approved the expansion of the continuous glucose monitoring (CGM) system to include all people with diabetes who use insulin at least once per day.
9. What pricing options are available for accessing the report?
Pricing options include single-user, multi-user, and enterprise licenses priced at USD 4750, USD 5250, and USD 8750 respectively.
10. Is the market size provided in terms of value or volume?
The market size is provided in terms of value, measured in Million and volume, measured in K Unit.
11. Are there any specific market keywords associated with the report?
Yes, the market keyword associated with the report is "APAC CGM Industry," which aids in identifying and referencing the specific market segment covered.
12. How do I determine which pricing option suits my needs best?
The pricing options vary based on user requirements and access needs. Individual users may opt for single-user licenses, while businesses requiring broader access may choose multi-user or enterprise licenses for cost-effective access to the report.
13. Are there any additional resources or data provided in the APAC CGM Industry report?
While the report offers comprehensive insights, it's advisable to review the specific contents or supplementary materials provided to ascertain if additional resources or data are available.
14. How can I stay updated on further developments or reports in the APAC CGM Industry?
To stay informed about further developments, trends, and reports in the APAC CGM Industry, consider subscribing to industry newsletters, following relevant companies and organizations, or regularly checking reputable industry news sources and publications.
Methodology
Step 1 - Identification of Relevant Samples Size from Population Database


Step 2 - Approaches for Defining Global Market Size (Value, Volume* & Price*)

Note*: In applicable scenarios
Step 3 - Data Sources
Primary Research
- Web Analytics
- Survey Reports
- Research Institute
- Latest Research Reports
- Opinion Leaders
Secondary Research
- Annual Reports
- White Paper
- Latest Press Release
- Industry Association
- Paid Database
- Investor Presentations

Step 4 - Data Triangulation
Involves using different sources of information in order to increase the validity of a study
These sources are likely to be stakeholders in a program - participants, other researchers, program staff, other community members, and so on.
Then we put all data in single framework & apply various statistical tools to find out the dynamic on the market.
During the analysis stage, feedback from the stakeholder groups would be compared to determine areas of agreement as well as areas of divergence


