
Key Insights
The global Knotless Tissue Control Devices market is projected for robust growth, estimated at approximately $XX million in 2025, with a Compound Annual Growth Rate (CAGR) of 5.50% through 2033. This expansion is primarily fueled by an increasing prevalence of orthopedic and sports-related injuries, coupled with a growing demand for minimally invasive surgical procedures. The shift towards advanced biomaterials and innovative designs that offer improved patient outcomes and faster recovery times are key drivers. The market is segmented by product type into Absorbable and Non-Absorbable devices, with Non-Absorbable types currently dominating due to their superior durability in certain applications. Material types include Metallic Suture Anchors, Bio-absorbable Suture Anchors, and Others, with bio-absorbable materials gaining traction for their ability to be naturally integrated by the body, reducing the risk of long-term complications. The Tying Type is further categorized into Knotted and Knotless, with the latter experiencing significant adoption owing to its efficiency and reduced tissue trauma during procedures like arthroscopy and rotator cuff repairs.
Key players such as Arthrex Inc., Johnson & Johnson (DePuy Synthes Inc.), and Stryker Corporation are at the forefront, investing heavily in research and development to introduce novel knotless tissue control solutions. Emerging economies, particularly in the Asia Pacific region, are expected to witness substantial growth due to improving healthcare infrastructure and increasing patient awareness. However, the market faces restraints such as the high cost of advanced knotless devices and the need for specialized surgical training. Despite these challenges, the overarching trend towards enhanced surgical precision, reduced procedural complexity, and improved patient satisfaction is expected to propel the knotless tissue control devices market forward. The continued innovation in material science and device design will be critical in overcoming existing limitations and unlocking new application areas within orthopedic surgery and beyond.
Knotless Tissue Control Devices Industry Market Structure & Innovation Trends
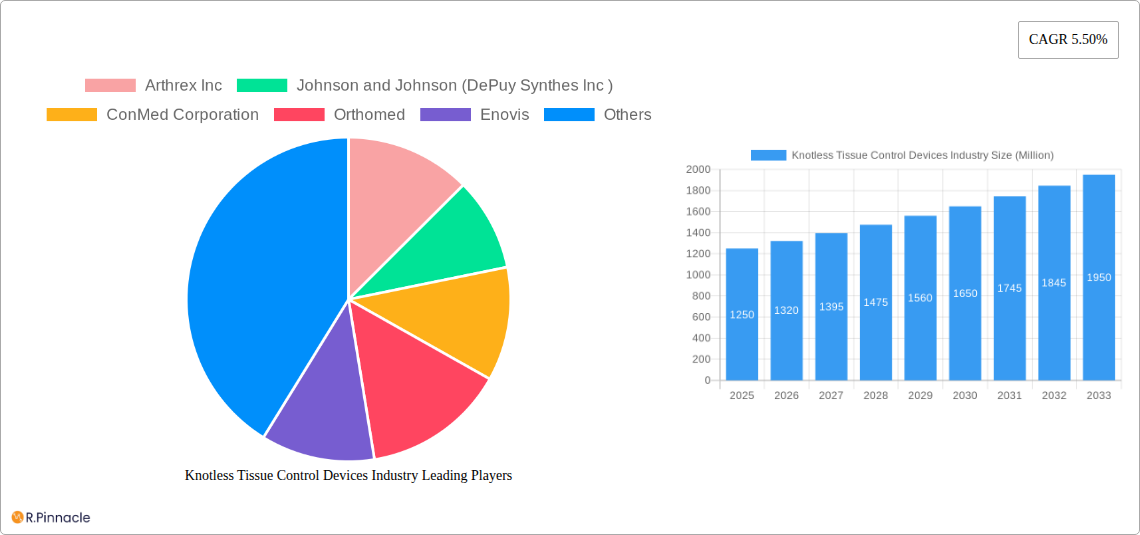
The knotless tissue control devices market is characterized by a dynamic and evolving structure, driven by significant innovation. Key players such as Arthrex Inc, Johnson & Johnson (DePuy Synthes Inc), ConMed Corporation, Enovis, and Stryker Corporation command substantial market share, contributing to a moderately concentrated landscape. Innovation in orthopedic surgery and minimally invasive procedures remains a primary driver, fostering the development of advanced suture anchors and tissue fixation devices. Regulatory frameworks, particularly stringent FDA approvals in North America and CE marking in Europe, shape market entry and product development. While direct product substitutes are limited, alternative surgical techniques can pose indirect competitive pressures. End-user demographics, primarily orthopedic surgeons and sports medicine specialists, influence product design and demand. Mergers and acquisitions (M&A) activity is a notable trend, with recent deals valued in the hundreds of millions of dollars, indicating consolidation and strategic expansion within the surgical devices sector. This segment is expected to see continued investment in R&D and strategic partnerships.
Knotless Tissue Control Devices Industry Market Dynamics & Trends
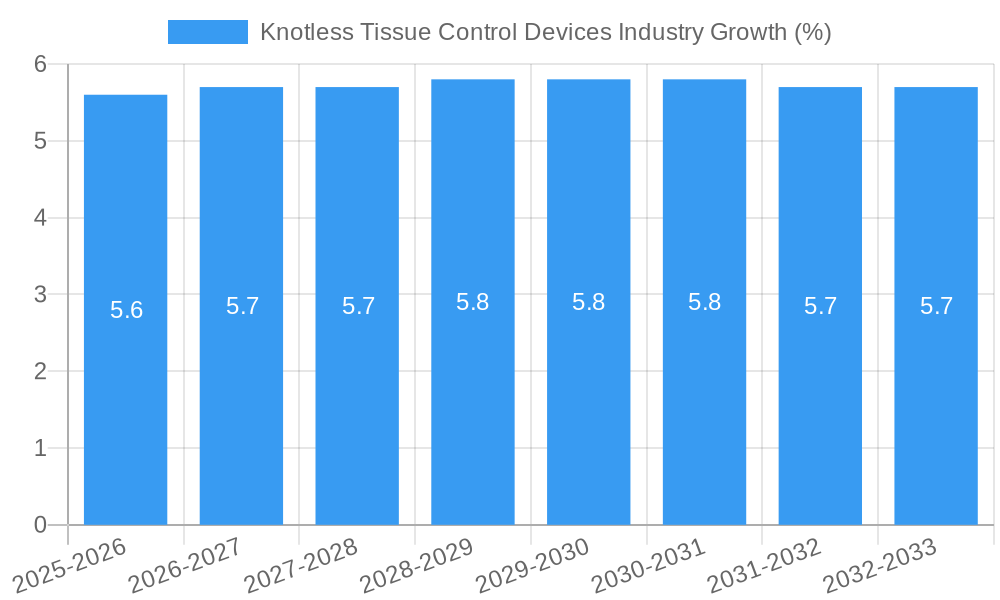
The knotless tissue control devices market is poised for robust growth, projected to expand at a significant Compound Annual Growth Rate (CAGR) of approximately XX% over the forecast period of 2025–2033. This upward trajectory is propelled by several key market growth drivers, including the increasing prevalence of sports-related injuries, degenerative joint diseases, and the growing demand for minimally invasive surgical procedures. The shift towards arthroscopic techniques, which minimize patient trauma and recovery time, directly fuels the adoption of knotless suture anchors and other tissue control solutions. Technological advancements in material science have led to the development of more biocompatible and bio-absorbable materials, enhancing patient outcomes and reducing the risk of complications. Furthermore, the aging global population contributes to a higher incidence of orthopedic conditions requiring surgical intervention, thus expanding the addressable market. The competitive landscape is intense, with leading companies continuously investing in research and development to introduce next-generation devices with improved efficacy, safety, and ease of use. Market penetration is steadily increasing as surgeons gain more experience and confidence in using knotless techniques, recognizing their advantages over traditional suturing methods. The rising healthcare expenditure globally, particularly in emerging economies, also plays a crucial role in driving market expansion, enabling greater access to advanced surgical technologies. The emphasis on patient-centric care and faster return to function is a significant trend that further bolsters the demand for knotless solutions, making them a preferred choice for a wide range of orthopedic procedures.
Dominant Regions & Segments in Knotless Tissue Control Devices Industry
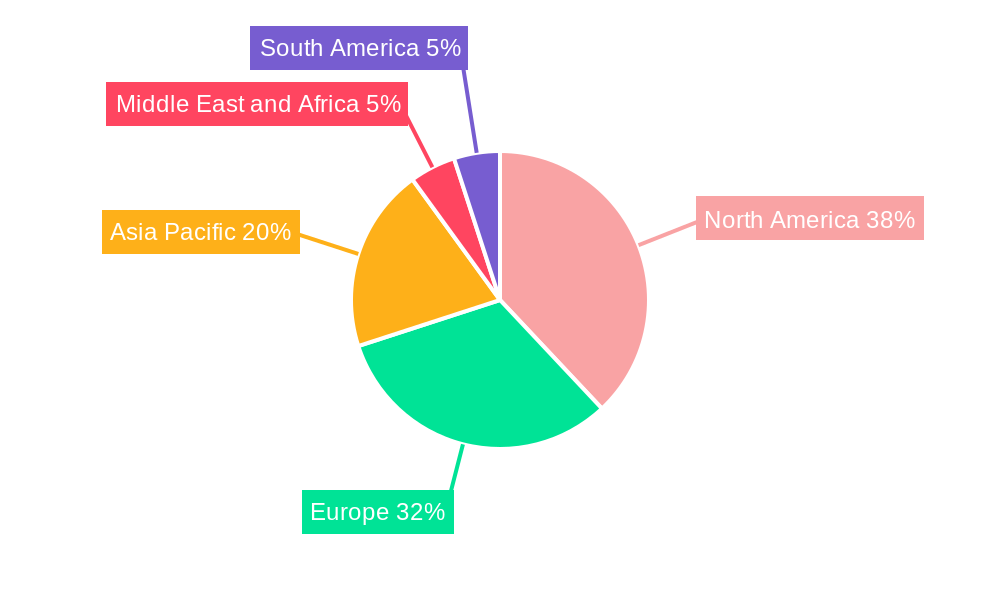
North America, particularly the United States, currently dominates the knotless tissue control devices market, driven by a combination of factors including high healthcare expenditure, advanced medical infrastructure, a high prevalence of sports injuries, and the early adoption of innovative surgical technologies. The region’s strong research and development ecosystem and the presence of leading medical device manufacturers like Arthrex Inc and Stryker Corporation further solidify its leadership position.
Product Type Dominance: Within Product Type, the Non-Absorbable segment holds a significant market share. This is due to the need for long-term stability and strength in certain orthopedic repairs, such as rotator cuff repairs and ligament reconstructions. However, the Absorbable segment is experiencing rapid growth, driven by advancements in bio-absorbable materials that offer excellent tissue integration and eliminate the need for secondary removal, thereby improving patient comfort and reducing complication rates.
Material Type Dominance: The Bio-absorbable Suture Anchor material type is witnessing substantial traction and is projected to outpace other segments in growth. This surge is attributed to the increasing focus on biocompatibility and the body's natural healing processes. Metallic suture anchors still hold a considerable market share due to their proven durability and strength, particularly in high-stress applications. However, the development of advanced bio-absorbable polymers is gradually shifting the preference towards these materials.
Tying Type Dominance: While the market is transitioning, the Knotless tying type segment is experiencing the most substantial growth and is expected to become the dominant force in the coming years. The inherent advantages of knotless techniques—reduced tissue irritation, decreased operative time, and improved knot security—are driving widespread adoption among surgeons. The Knotted tying type, though historically prevalent, is gradually ceding market share as surgeons embrace the benefits offered by knotless alternatives.
The dominance of these segments is reinforced by economic policies that encourage innovation in medical devices, robust healthcare reimbursement systems, and the continuous drive for improved patient outcomes in orthopedic and sports medicine surgeries.
Knotless Tissue Control Devices Industry Product Innovations
Product innovations in the knotless tissue control devices sector are centered on enhancing surgical efficiency, patient safety, and tissue healing. Manufacturers are developing advanced bio-absorbable suture anchors with improved integration properties and faster absorption rates. Novel materials and designs are emerging to offer superior biomechanical strength and secure tissue fixation for a wider range of applications, including complex reconstructive procedures. The competitive advantage lies in devices that offer streamlined implantation, versatility across different tissue types, and minimally invasive profiles, ultimately leading to faster patient recovery and reduced complications.
Report Scope & Segmentation Analysis
This report provides a comprehensive analysis of the knotless tissue control devices market, segmented by Product Type (Absorbable, Non-Absorbable), Material Type (Metallic Suture Anchor, Bio-absorbable Suture Anchor, Others), and Tying Type (Knotted, Knotless, Others). The Absorbable segment is projected to witness a significant CAGR of XX%, driven by advancements in biomaterials. The Non-Absorbable segment will maintain a steady market share due to its established use in high-stress applications. In terms of Material Type, Bio-absorbable Suture Anchors are expected to exhibit the highest growth rate, while Metallic Suture Anchors will continue to hold a strong position. The Knotless Tying Type segment is poised for substantial expansion, displacing traditional Knotted techniques as surgeons increasingly adopt these advanced solutions. The "Others" category for both Material and Tying Types encompasses emerging technologies and niche applications.
Key Drivers of Knotless Tissue Control Devices Industry Growth
The knotless tissue control devices industry is experiencing accelerated growth driven by several pivotal factors. The escalating incidence of sports injuries and degenerative joint diseases globally necessitates advanced surgical interventions, directly boosting demand for efficient tissue fixation solutions. Furthermore, the ongoing shift towards minimally invasive surgical (MIS) procedures, favored for their reduced patient trauma and faster recovery times, strongly favors the adoption of knotless techniques. Technological advancements in biomaterials, leading to the development of stronger, more biocompatible, and bio-absorbable suture anchors, are also key accelerators. Government initiatives promoting healthcare innovation and increased R&D investments by leading companies like Arthrex Inc and Zimmer Biomet Holdings further fuel market expansion.
Challenges in the Knotless Tissue Control Devices Industry Sector
Despite strong growth prospects, the knotless tissue control devices industry faces certain challenges. Stringent regulatory approval processes in key markets can lead to extended product launch timelines and significant R&D costs. The relatively higher cost of knotless devices compared to traditional suturing methods can pose a barrier to adoption in cost-sensitive healthcare systems. Surgeon training and education are critical for the successful implementation of knotless techniques, and a lack of widespread adoption of such training programs can slow market penetration. Moreover, the competitive landscape, with numerous players vying for market share, can lead to pricing pressures and affect profit margins. Supply chain disruptions, particularly for specialized biomaterials, can also impact the availability and cost of these devices.
Emerging Opportunities in Knotless Tissue Control Devices Industry
The knotless tissue control devices industry is ripe with emerging opportunities. The growing demand for advanced solutions in emerging economies, where disposable income and healthcare infrastructure are improving, presents a significant untapped market. Innovations in bio-integrative materials and smart device technologies, which can monitor tissue healing or deliver therapeutic agents, offer promising avenues for product differentiation and value addition. The increasing focus on sports medicine and regenerative therapies opens doors for specialized knotless devices tailored for these rapidly growing fields. Partnerships between device manufacturers and academic institutions can drive further research and development, leading to breakthrough innovations. Expansion into new surgical areas beyond orthopedics also represents a substantial growth opportunity.
Leading Players in the Knotless Tissue Control Devices Industry Market
- Arthrex Inc
- Johnson and Johnson (DePuy Synthes Inc )
- ConMed Corporation
- Orthomed
- Enovis
- Parcus Medical LLC
- Zimmer Biomet Holdings
- Stryker Corporation
- Teknimed
- Smith & Nephew plc
- Wright Medical
- Medtronic plc
Key Developments in Knotless Tissue Control Devices Industry Industry
- 2024: Launch of new generation of bio-absorbable suture anchors with enhanced mechanical properties.
- 2023: Arthrex Inc announces strategic acquisition of a key biomaterial supplier to enhance supply chain resilience.
- 2022: Stryker Corporation receives FDA approval for its novel knotless rotator cuff repair system.
- 2021: Johnson & Johnson (DePuy Synthes Inc ) expands its portfolio with the introduction of a multi-directional knotless anchor.
- 2020: ConMed Corporation introduces an innovative knotless device designed for shoulder instability repairs.
- 2019: Medtronic plc receives CE mark for its latest generation of knotless tissue fixation devices in Europe.
Future Outlook for Knotless Tissue Control Devices Industry Market
The future outlook for the knotless tissue control devices market is exceptionally bright, fueled by continuous innovation and increasing surgeon and patient preference for less invasive and more effective surgical solutions. The market is expected to witness sustained high growth driven by advancements in biomaterials and robotic-assisted surgery. Expansion into new geographic regions and a deeper penetration in existing markets, particularly in Asia-Pacific and Latin America, will be key growth accelerators. Strategic collaborations and potential mergers will further shape the competitive landscape, leading to greater market consolidation and the development of integrated surgical solutions. The focus on personalized medicine and patient outcomes will continue to drive the development of highly specialized and advanced knotless devices.
Knotless Tissue Control Devices Industry Segmentation
-
1. Product Type
- 1.1. Absorbable
- 1.2. Non-Absorbable
-
2. Material Type
- 2.1. Metallic Suture Anchor
- 2.2. Bio-absorbable Suture Anchor
- 2.3. Others
-
3. Tying Type
- 3.1. Knotted
- 3.2. Knotless
- 3.3. Others
Knotless Tissue Control Devices Industry Segmentation By Geography
-
1. North America
- 1.1. United States
- 1.2. Canada
- 1.3. Mexico
-
2. Europe
- 2.1. Germany
- 2.2. United Kingdom
- 2.3. France
- 2.4. Italy
- 2.5. Spain
- 2.6. Rest of Europe
-
3. Asia Pacific
- 3.1. China
- 3.2. Japan
- 3.3. India
- 3.4. Australia
- 3.5. South Korea
- 3.6. Rest of Asia Pacific
-
4. Middle East and Africa
- 4.1. GCC
- 4.2. South Africa
- 4.3. Rest of Middle East and Africa
-
5. South America
- 5.1. Brazil
- 5.2. Argentina
- 5.3. Rest of South America
Knotless Tissue Control Devices Industry REPORT HIGHLIGHTS
| Aspects | Details |
|---|---|
| Study Period | 2019-2033 |
| Base Year | 2024 |
| Estimated Year | 2025 |
| Forecast Period | 2025-2033 |
| Historical Period | 2019-2024 |
| Growth Rate | CAGR of 5.50% from 2019-2033 |
| Segmentation |
|
Table of Contents
- 1. Introduction
- 1.1. Research Scope
- 1.2. Market Segmentation
- 1.3. Research Methodology
- 1.4. Definitions and Assumptions
- 2. Executive Summary
- 2.1. Introduction
- 3. Market Dynamics
- 3.1. Introduction
- 3.2. Market Drivers
- 3.2.1. Increasing Orthopedic injuries in geriatric population; Demand for minimally-invasive surgeries; Rising Number of Sports Accidents
- 3.3. Market Restrains
- 3.3.1. Varying degree of tissue reaction
- 3.4. Market Trends
- 3.4.1. Knotless Segment is Expected to Hold a Major Market Share in the Suture Anchor Devices Market
- 4. Market Factor Analysis
- 4.1. Porters Five Forces
- 4.2. Supply/Value Chain
- 4.3. PESTEL analysis
- 4.4. Market Entropy
- 4.5. Patent/Trademark Analysis
- 5. Global Knotless Tissue Control Devices Industry Analysis, Insights and Forecast, 2019-2031
- 5.1. Market Analysis, Insights and Forecast - by Product Type
- 5.1.1. Absorbable
- 5.1.2. Non-Absorbable
- 5.2. Market Analysis, Insights and Forecast - by Material Type
- 5.2.1. Metallic Suture Anchor
- 5.2.2. Bio-absorbable Suture Anchor
- 5.2.3. Others
- 5.3. Market Analysis, Insights and Forecast - by Tying Type
- 5.3.1. Knotted
- 5.3.2. Knotless
- 5.3.3. Others
- 5.4. Market Analysis, Insights and Forecast - by Region
- 5.4.1. North America
- 5.4.2. Europe
- 5.4.3. Asia Pacific
- 5.4.4. Middle East and Africa
- 5.4.5. South America
- 5.1. Market Analysis, Insights and Forecast - by Product Type
- 6. North America Knotless Tissue Control Devices Industry Analysis, Insights and Forecast, 2019-2031
- 6.1. Market Analysis, Insights and Forecast - by Product Type
- 6.1.1. Absorbable
- 6.1.2. Non-Absorbable
- 6.2. Market Analysis, Insights and Forecast - by Material Type
- 6.2.1. Metallic Suture Anchor
- 6.2.2. Bio-absorbable Suture Anchor
- 6.2.3. Others
- 6.3. Market Analysis, Insights and Forecast - by Tying Type
- 6.3.1. Knotted
- 6.3.2. Knotless
- 6.3.3. Others
- 6.1. Market Analysis, Insights and Forecast - by Product Type
- 7. Europe Knotless Tissue Control Devices Industry Analysis, Insights and Forecast, 2019-2031
- 7.1. Market Analysis, Insights and Forecast - by Product Type
- 7.1.1. Absorbable
- 7.1.2. Non-Absorbable
- 7.2. Market Analysis, Insights and Forecast - by Material Type
- 7.2.1. Metallic Suture Anchor
- 7.2.2. Bio-absorbable Suture Anchor
- 7.2.3. Others
- 7.3. Market Analysis, Insights and Forecast - by Tying Type
- 7.3.1. Knotted
- 7.3.2. Knotless
- 7.3.3. Others
- 7.1. Market Analysis, Insights and Forecast - by Product Type
- 8. Asia Pacific Knotless Tissue Control Devices Industry Analysis, Insights and Forecast, 2019-2031
- 8.1. Market Analysis, Insights and Forecast - by Product Type
- 8.1.1. Absorbable
- 8.1.2. Non-Absorbable
- 8.2. Market Analysis, Insights and Forecast - by Material Type
- 8.2.1. Metallic Suture Anchor
- 8.2.2. Bio-absorbable Suture Anchor
- 8.2.3. Others
- 8.3. Market Analysis, Insights and Forecast - by Tying Type
- 8.3.1. Knotted
- 8.3.2. Knotless
- 8.3.3. Others
- 8.1. Market Analysis, Insights and Forecast - by Product Type
- 9. Middle East and Africa Knotless Tissue Control Devices Industry Analysis, Insights and Forecast, 2019-2031
- 9.1. Market Analysis, Insights and Forecast - by Product Type
- 9.1.1. Absorbable
- 9.1.2. Non-Absorbable
- 9.2. Market Analysis, Insights and Forecast - by Material Type
- 9.2.1. Metallic Suture Anchor
- 9.2.2. Bio-absorbable Suture Anchor
- 9.2.3. Others
- 9.3. Market Analysis, Insights and Forecast - by Tying Type
- 9.3.1. Knotted
- 9.3.2. Knotless
- 9.3.3. Others
- 9.1. Market Analysis, Insights and Forecast - by Product Type
- 10. South America Knotless Tissue Control Devices Industry Analysis, Insights and Forecast, 2019-2031
- 10.1. Market Analysis, Insights and Forecast - by Product Type
- 10.1.1. Absorbable
- 10.1.2. Non-Absorbable
- 10.2. Market Analysis, Insights and Forecast - by Material Type
- 10.2.1. Metallic Suture Anchor
- 10.2.2. Bio-absorbable Suture Anchor
- 10.2.3. Others
- 10.3. Market Analysis, Insights and Forecast - by Tying Type
- 10.3.1. Knotted
- 10.3.2. Knotless
- 10.3.3. Others
- 10.1. Market Analysis, Insights and Forecast - by Product Type
- 11. North America Knotless Tissue Control Devices Industry Analysis, Insights and Forecast, 2019-2031
- 11.1. Market Analysis, Insights and Forecast - By Country/Sub-region
- 11.1.1 United States
- 11.1.2 Canada
- 11.1.3 Mexico
- 12. Europe Knotless Tissue Control Devices Industry Analysis, Insights and Forecast, 2019-2031
- 12.1. Market Analysis, Insights and Forecast - By Country/Sub-region
- 12.1.1 Germany
- 12.1.2 United Kingdom
- 12.1.3 France
- 12.1.4 Italy
- 12.1.5 Spain
- 12.1.6 Rest of Europe
- 13. Asia Pacific Knotless Tissue Control Devices Industry Analysis, Insights and Forecast, 2019-2031
- 13.1. Market Analysis, Insights and Forecast - By Country/Sub-region
- 13.1.1 China
- 13.1.2 Japan
- 13.1.3 India
- 13.1.4 Australia
- 13.1.5 South Korea
- 13.1.6 Rest of Asia Pacific
- 14. Middle East and Africa Knotless Tissue Control Devices Industry Analysis, Insights and Forecast, 2019-2031
- 14.1. Market Analysis, Insights and Forecast - By Country/Sub-region
- 14.1.1 GCC
- 14.1.2 South Africa
- 14.1.3 Rest of Middle East and Africa
- 15. South America Knotless Tissue Control Devices Industry Analysis, Insights and Forecast, 2019-2031
- 15.1. Market Analysis, Insights and Forecast - By Country/Sub-region
- 15.1.1 Brazil
- 15.1.2 Argentina
- 15.1.3 Rest of South America
- 16. Competitive Analysis
- 16.1. Global Market Share Analysis 2024
- 16.2. Company Profiles
- 16.2.1 Arthrex Inc
- 16.2.1.1. Overview
- 16.2.1.2. Products
- 16.2.1.3. SWOT Analysis
- 16.2.1.4. Recent Developments
- 16.2.1.5. Financials (Based on Availability)
- 16.2.2 Johnson and Johnson (DePuy Synthes Inc )
- 16.2.2.1. Overview
- 16.2.2.2. Products
- 16.2.2.3. SWOT Analysis
- 16.2.2.4. Recent Developments
- 16.2.2.5. Financials (Based on Availability)
- 16.2.3 ConMed Corporation
- 16.2.3.1. Overview
- 16.2.3.2. Products
- 16.2.3.3. SWOT Analysis
- 16.2.3.4. Recent Developments
- 16.2.3.5. Financials (Based on Availability)
- 16.2.4 Orthomed
- 16.2.4.1. Overview
- 16.2.4.2. Products
- 16.2.4.3. SWOT Analysis
- 16.2.4.4. Recent Developments
- 16.2.4.5. Financials (Based on Availability)
- 16.2.5 Enovis
- 16.2.5.1. Overview
- 16.2.5.2. Products
- 16.2.5.3. SWOT Analysis
- 16.2.5.4. Recent Developments
- 16.2.5.5. Financials (Based on Availability)
- 16.2.6 Parcus Medical LLC
- 16.2.6.1. Overview
- 16.2.6.2. Products
- 16.2.6.3. SWOT Analysis
- 16.2.6.4. Recent Developments
- 16.2.6.5. Financials (Based on Availability)
- 16.2.7 Zimmer Biomet Holdings
- 16.2.7.1. Overview
- 16.2.7.2. Products
- 16.2.7.3. SWOT Analysis
- 16.2.7.4. Recent Developments
- 16.2.7.5. Financials (Based on Availability)
- 16.2.8 Stryker Corporation
- 16.2.8.1. Overview
- 16.2.8.2. Products
- 16.2.8.3. SWOT Analysis
- 16.2.8.4. Recent Developments
- 16.2.8.5. Financials (Based on Availability)
- 16.2.9 Teknimed
- 16.2.9.1. Overview
- 16.2.9.2. Products
- 16.2.9.3. SWOT Analysis
- 16.2.9.4. Recent Developments
- 16.2.9.5. Financials (Based on Availability)
- 16.2.10 Smith & Nephew plc
- 16.2.10.1. Overview
- 16.2.10.2. Products
- 16.2.10.3. SWOT Analysis
- 16.2.10.4. Recent Developments
- 16.2.10.5. Financials (Based on Availability)
- 16.2.11 Wright Medical
- 16.2.11.1. Overview
- 16.2.11.2. Products
- 16.2.11.3. SWOT Analysis
- 16.2.11.4. Recent Developments
- 16.2.11.5. Financials (Based on Availability)
- 16.2.12 Medtronic plc
- 16.2.12.1. Overview
- 16.2.12.2. Products
- 16.2.12.3. SWOT Analysis
- 16.2.12.4. Recent Developments
- 16.2.12.5. Financials (Based on Availability)
- 16.2.1 Arthrex Inc
List of Figures
- Figure 1: Global Knotless Tissue Control Devices Industry Revenue Breakdown (Million, %) by Region 2024 & 2032
- Figure 2: Global Knotless Tissue Control Devices Industry Volume Breakdown (K Unit, %) by Region 2024 & 2032
- Figure 3: North America Knotless Tissue Control Devices Industry Revenue (Million), by Country 2024 & 2032
- Figure 4: North America Knotless Tissue Control Devices Industry Volume (K Unit), by Country 2024 & 2032
- Figure 5: North America Knotless Tissue Control Devices Industry Revenue Share (%), by Country 2024 & 2032
- Figure 6: North America Knotless Tissue Control Devices Industry Volume Share (%), by Country 2024 & 2032
- Figure 7: Europe Knotless Tissue Control Devices Industry Revenue (Million), by Country 2024 & 2032
- Figure 8: Europe Knotless Tissue Control Devices Industry Volume (K Unit), by Country 2024 & 2032
- Figure 9: Europe Knotless Tissue Control Devices Industry Revenue Share (%), by Country 2024 & 2032
- Figure 10: Europe Knotless Tissue Control Devices Industry Volume Share (%), by Country 2024 & 2032
- Figure 11: Asia Pacific Knotless Tissue Control Devices Industry Revenue (Million), by Country 2024 & 2032
- Figure 12: Asia Pacific Knotless Tissue Control Devices Industry Volume (K Unit), by Country 2024 & 2032
- Figure 13: Asia Pacific Knotless Tissue Control Devices Industry Revenue Share (%), by Country 2024 & 2032
- Figure 14: Asia Pacific Knotless Tissue Control Devices Industry Volume Share (%), by Country 2024 & 2032
- Figure 15: Middle East and Africa Knotless Tissue Control Devices Industry Revenue (Million), by Country 2024 & 2032
- Figure 16: Middle East and Africa Knotless Tissue Control Devices Industry Volume (K Unit), by Country 2024 & 2032
- Figure 17: Middle East and Africa Knotless Tissue Control Devices Industry Revenue Share (%), by Country 2024 & 2032
- Figure 18: Middle East and Africa Knotless Tissue Control Devices Industry Volume Share (%), by Country 2024 & 2032
- Figure 19: South America Knotless Tissue Control Devices Industry Revenue (Million), by Country 2024 & 2032
- Figure 20: South America Knotless Tissue Control Devices Industry Volume (K Unit), by Country 2024 & 2032
- Figure 21: South America Knotless Tissue Control Devices Industry Revenue Share (%), by Country 2024 & 2032
- Figure 22: South America Knotless Tissue Control Devices Industry Volume Share (%), by Country 2024 & 2032
- Figure 23: North America Knotless Tissue Control Devices Industry Revenue (Million), by Product Type 2024 & 2032
- Figure 24: North America Knotless Tissue Control Devices Industry Volume (K Unit), by Product Type 2024 & 2032
- Figure 25: North America Knotless Tissue Control Devices Industry Revenue Share (%), by Product Type 2024 & 2032
- Figure 26: North America Knotless Tissue Control Devices Industry Volume Share (%), by Product Type 2024 & 2032
- Figure 27: North America Knotless Tissue Control Devices Industry Revenue (Million), by Material Type 2024 & 2032
- Figure 28: North America Knotless Tissue Control Devices Industry Volume (K Unit), by Material Type 2024 & 2032
- Figure 29: North America Knotless Tissue Control Devices Industry Revenue Share (%), by Material Type 2024 & 2032
- Figure 30: North America Knotless Tissue Control Devices Industry Volume Share (%), by Material Type 2024 & 2032
- Figure 31: North America Knotless Tissue Control Devices Industry Revenue (Million), by Tying Type 2024 & 2032
- Figure 32: North America Knotless Tissue Control Devices Industry Volume (K Unit), by Tying Type 2024 & 2032
- Figure 33: North America Knotless Tissue Control Devices Industry Revenue Share (%), by Tying Type 2024 & 2032
- Figure 34: North America Knotless Tissue Control Devices Industry Volume Share (%), by Tying Type 2024 & 2032
- Figure 35: North America Knotless Tissue Control Devices Industry Revenue (Million), by Country 2024 & 2032
- Figure 36: North America Knotless Tissue Control Devices Industry Volume (K Unit), by Country 2024 & 2032
- Figure 37: North America Knotless Tissue Control Devices Industry Revenue Share (%), by Country 2024 & 2032
- Figure 38: North America Knotless Tissue Control Devices Industry Volume Share (%), by Country 2024 & 2032
- Figure 39: Europe Knotless Tissue Control Devices Industry Revenue (Million), by Product Type 2024 & 2032
- Figure 40: Europe Knotless Tissue Control Devices Industry Volume (K Unit), by Product Type 2024 & 2032
- Figure 41: Europe Knotless Tissue Control Devices Industry Revenue Share (%), by Product Type 2024 & 2032
- Figure 42: Europe Knotless Tissue Control Devices Industry Volume Share (%), by Product Type 2024 & 2032
- Figure 43: Europe Knotless Tissue Control Devices Industry Revenue (Million), by Material Type 2024 & 2032
- Figure 44: Europe Knotless Tissue Control Devices Industry Volume (K Unit), by Material Type 2024 & 2032
- Figure 45: Europe Knotless Tissue Control Devices Industry Revenue Share (%), by Material Type 2024 & 2032
- Figure 46: Europe Knotless Tissue Control Devices Industry Volume Share (%), by Material Type 2024 & 2032
- Figure 47: Europe Knotless Tissue Control Devices Industry Revenue (Million), by Tying Type 2024 & 2032
- Figure 48: Europe Knotless Tissue Control Devices Industry Volume (K Unit), by Tying Type 2024 & 2032
- Figure 49: Europe Knotless Tissue Control Devices Industry Revenue Share (%), by Tying Type 2024 & 2032
- Figure 50: Europe Knotless Tissue Control Devices Industry Volume Share (%), by Tying Type 2024 & 2032
- Figure 51: Europe Knotless Tissue Control Devices Industry Revenue (Million), by Country 2024 & 2032
- Figure 52: Europe Knotless Tissue Control Devices Industry Volume (K Unit), by Country 2024 & 2032
- Figure 53: Europe Knotless Tissue Control Devices Industry Revenue Share (%), by Country 2024 & 2032
- Figure 54: Europe Knotless Tissue Control Devices Industry Volume Share (%), by Country 2024 & 2032
- Figure 55: Asia Pacific Knotless Tissue Control Devices Industry Revenue (Million), by Product Type 2024 & 2032
- Figure 56: Asia Pacific Knotless Tissue Control Devices Industry Volume (K Unit), by Product Type 2024 & 2032
- Figure 57: Asia Pacific Knotless Tissue Control Devices Industry Revenue Share (%), by Product Type 2024 & 2032
- Figure 58: Asia Pacific Knotless Tissue Control Devices Industry Volume Share (%), by Product Type 2024 & 2032
- Figure 59: Asia Pacific Knotless Tissue Control Devices Industry Revenue (Million), by Material Type 2024 & 2032
- Figure 60: Asia Pacific Knotless Tissue Control Devices Industry Volume (K Unit), by Material Type 2024 & 2032
- Figure 61: Asia Pacific Knotless Tissue Control Devices Industry Revenue Share (%), by Material Type 2024 & 2032
- Figure 62: Asia Pacific Knotless Tissue Control Devices Industry Volume Share (%), by Material Type 2024 & 2032
- Figure 63: Asia Pacific Knotless Tissue Control Devices Industry Revenue (Million), by Tying Type 2024 & 2032
- Figure 64: Asia Pacific Knotless Tissue Control Devices Industry Volume (K Unit), by Tying Type 2024 & 2032
- Figure 65: Asia Pacific Knotless Tissue Control Devices Industry Revenue Share (%), by Tying Type 2024 & 2032
- Figure 66: Asia Pacific Knotless Tissue Control Devices Industry Volume Share (%), by Tying Type 2024 & 2032
- Figure 67: Asia Pacific Knotless Tissue Control Devices Industry Revenue (Million), by Country 2024 & 2032
- Figure 68: Asia Pacific Knotless Tissue Control Devices Industry Volume (K Unit), by Country 2024 & 2032
- Figure 69: Asia Pacific Knotless Tissue Control Devices Industry Revenue Share (%), by Country 2024 & 2032
- Figure 70: Asia Pacific Knotless Tissue Control Devices Industry Volume Share (%), by Country 2024 & 2032
- Figure 71: Middle East and Africa Knotless Tissue Control Devices Industry Revenue (Million), by Product Type 2024 & 2032
- Figure 72: Middle East and Africa Knotless Tissue Control Devices Industry Volume (K Unit), by Product Type 2024 & 2032
- Figure 73: Middle East and Africa Knotless Tissue Control Devices Industry Revenue Share (%), by Product Type 2024 & 2032
- Figure 74: Middle East and Africa Knotless Tissue Control Devices Industry Volume Share (%), by Product Type 2024 & 2032
- Figure 75: Middle East and Africa Knotless Tissue Control Devices Industry Revenue (Million), by Material Type 2024 & 2032
- Figure 76: Middle East and Africa Knotless Tissue Control Devices Industry Volume (K Unit), by Material Type 2024 & 2032
- Figure 77: Middle East and Africa Knotless Tissue Control Devices Industry Revenue Share (%), by Material Type 2024 & 2032
- Figure 78: Middle East and Africa Knotless Tissue Control Devices Industry Volume Share (%), by Material Type 2024 & 2032
- Figure 79: Middle East and Africa Knotless Tissue Control Devices Industry Revenue (Million), by Tying Type 2024 & 2032
- Figure 80: Middle East and Africa Knotless Tissue Control Devices Industry Volume (K Unit), by Tying Type 2024 & 2032
- Figure 81: Middle East and Africa Knotless Tissue Control Devices Industry Revenue Share (%), by Tying Type 2024 & 2032
- Figure 82: Middle East and Africa Knotless Tissue Control Devices Industry Volume Share (%), by Tying Type 2024 & 2032
- Figure 83: Middle East and Africa Knotless Tissue Control Devices Industry Revenue (Million), by Country 2024 & 2032
- Figure 84: Middle East and Africa Knotless Tissue Control Devices Industry Volume (K Unit), by Country 2024 & 2032
- Figure 85: Middle East and Africa Knotless Tissue Control Devices Industry Revenue Share (%), by Country 2024 & 2032
- Figure 86: Middle East and Africa Knotless Tissue Control Devices Industry Volume Share (%), by Country 2024 & 2032
- Figure 87: South America Knotless Tissue Control Devices Industry Revenue (Million), by Product Type 2024 & 2032
- Figure 88: South America Knotless Tissue Control Devices Industry Volume (K Unit), by Product Type 2024 & 2032
- Figure 89: South America Knotless Tissue Control Devices Industry Revenue Share (%), by Product Type 2024 & 2032
- Figure 90: South America Knotless Tissue Control Devices Industry Volume Share (%), by Product Type 2024 & 2032
- Figure 91: South America Knotless Tissue Control Devices Industry Revenue (Million), by Material Type 2024 & 2032
- Figure 92: South America Knotless Tissue Control Devices Industry Volume (K Unit), by Material Type 2024 & 2032
- Figure 93: South America Knotless Tissue Control Devices Industry Revenue Share (%), by Material Type 2024 & 2032
- Figure 94: South America Knotless Tissue Control Devices Industry Volume Share (%), by Material Type 2024 & 2032
- Figure 95: South America Knotless Tissue Control Devices Industry Revenue (Million), by Tying Type 2024 & 2032
- Figure 96: South America Knotless Tissue Control Devices Industry Volume (K Unit), by Tying Type 2024 & 2032
- Figure 97: South America Knotless Tissue Control Devices Industry Revenue Share (%), by Tying Type 2024 & 2032
- Figure 98: South America Knotless Tissue Control Devices Industry Volume Share (%), by Tying Type 2024 & 2032
- Figure 99: South America Knotless Tissue Control Devices Industry Revenue (Million), by Country 2024 & 2032
- Figure 100: South America Knotless Tissue Control Devices Industry Volume (K Unit), by Country 2024 & 2032
- Figure 101: South America Knotless Tissue Control Devices Industry Revenue Share (%), by Country 2024 & 2032
- Figure 102: South America Knotless Tissue Control Devices Industry Volume Share (%), by Country 2024 & 2032
List of Tables
- Table 1: Global Knotless Tissue Control Devices Industry Revenue Million Forecast, by Region 2019 & 2032
- Table 2: Global Knotless Tissue Control Devices Industry Volume K Unit Forecast, by Region 2019 & 2032
- Table 3: Global Knotless Tissue Control Devices Industry Revenue Million Forecast, by Product Type 2019 & 2032
- Table 4: Global Knotless Tissue Control Devices Industry Volume K Unit Forecast, by Product Type 2019 & 2032
- Table 5: Global Knotless Tissue Control Devices Industry Revenue Million Forecast, by Material Type 2019 & 2032
- Table 6: Global Knotless Tissue Control Devices Industry Volume K Unit Forecast, by Material Type 2019 & 2032
- Table 7: Global Knotless Tissue Control Devices Industry Revenue Million Forecast, by Tying Type 2019 & 2032
- Table 8: Global Knotless Tissue Control Devices Industry Volume K Unit Forecast, by Tying Type 2019 & 2032
- Table 9: Global Knotless Tissue Control Devices Industry Revenue Million Forecast, by Region 2019 & 2032
- Table 10: Global Knotless Tissue Control Devices Industry Volume K Unit Forecast, by Region 2019 & 2032
- Table 11: Global Knotless Tissue Control Devices Industry Revenue Million Forecast, by Country 2019 & 2032
- Table 12: Global Knotless Tissue Control Devices Industry Volume K Unit Forecast, by Country 2019 & 2032
- Table 13: United States Knotless Tissue Control Devices Industry Revenue (Million) Forecast, by Application 2019 & 2032
- Table 14: United States Knotless Tissue Control Devices Industry Volume (K Unit) Forecast, by Application 2019 & 2032
- Table 15: Canada Knotless Tissue Control Devices Industry Revenue (Million) Forecast, by Application 2019 & 2032
- Table 16: Canada Knotless Tissue Control Devices Industry Volume (K Unit) Forecast, by Application 2019 & 2032
- Table 17: Mexico Knotless Tissue Control Devices Industry Revenue (Million) Forecast, by Application 2019 & 2032
- Table 18: Mexico Knotless Tissue Control Devices Industry Volume (K Unit) Forecast, by Application 2019 & 2032
- Table 19: Global Knotless Tissue Control Devices Industry Revenue Million Forecast, by Country 2019 & 2032
- Table 20: Global Knotless Tissue Control Devices Industry Volume K Unit Forecast, by Country 2019 & 2032
- Table 21: Germany Knotless Tissue Control Devices Industry Revenue (Million) Forecast, by Application 2019 & 2032
- Table 22: Germany Knotless Tissue Control Devices Industry Volume (K Unit) Forecast, by Application 2019 & 2032
- Table 23: United Kingdom Knotless Tissue Control Devices Industry Revenue (Million) Forecast, by Application 2019 & 2032
- Table 24: United Kingdom Knotless Tissue Control Devices Industry Volume (K Unit) Forecast, by Application 2019 & 2032
- Table 25: France Knotless Tissue Control Devices Industry Revenue (Million) Forecast, by Application 2019 & 2032
- Table 26: France Knotless Tissue Control Devices Industry Volume (K Unit) Forecast, by Application 2019 & 2032
- Table 27: Italy Knotless Tissue Control Devices Industry Revenue (Million) Forecast, by Application 2019 & 2032
- Table 28: Italy Knotless Tissue Control Devices Industry Volume (K Unit) Forecast, by Application 2019 & 2032
- Table 29: Spain Knotless Tissue Control Devices Industry Revenue (Million) Forecast, by Application 2019 & 2032
- Table 30: Spain Knotless Tissue Control Devices Industry Volume (K Unit) Forecast, by Application 2019 & 2032
- Table 31: Rest of Europe Knotless Tissue Control Devices Industry Revenue (Million) Forecast, by Application 2019 & 2032
- Table 32: Rest of Europe Knotless Tissue Control Devices Industry Volume (K Unit) Forecast, by Application 2019 & 2032
- Table 33: Global Knotless Tissue Control Devices Industry Revenue Million Forecast, by Country 2019 & 2032
- Table 34: Global Knotless Tissue Control Devices Industry Volume K Unit Forecast, by Country 2019 & 2032
- Table 35: China Knotless Tissue Control Devices Industry Revenue (Million) Forecast, by Application 2019 & 2032
- Table 36: China Knotless Tissue Control Devices Industry Volume (K Unit) Forecast, by Application 2019 & 2032
- Table 37: Japan Knotless Tissue Control Devices Industry Revenue (Million) Forecast, by Application 2019 & 2032
- Table 38: Japan Knotless Tissue Control Devices Industry Volume (K Unit) Forecast, by Application 2019 & 2032
- Table 39: India Knotless Tissue Control Devices Industry Revenue (Million) Forecast, by Application 2019 & 2032
- Table 40: India Knotless Tissue Control Devices Industry Volume (K Unit) Forecast, by Application 2019 & 2032
- Table 41: Australia Knotless Tissue Control Devices Industry Revenue (Million) Forecast, by Application 2019 & 2032
- Table 42: Australia Knotless Tissue Control Devices Industry Volume (K Unit) Forecast, by Application 2019 & 2032
- Table 43: South Korea Knotless Tissue Control Devices Industry Revenue (Million) Forecast, by Application 2019 & 2032
- Table 44: South Korea Knotless Tissue Control Devices Industry Volume (K Unit) Forecast, by Application 2019 & 2032
- Table 45: Rest of Asia Pacific Knotless Tissue Control Devices Industry Revenue (Million) Forecast, by Application 2019 & 2032
- Table 46: Rest of Asia Pacific Knotless Tissue Control Devices Industry Volume (K Unit) Forecast, by Application 2019 & 2032
- Table 47: Global Knotless Tissue Control Devices Industry Revenue Million Forecast, by Country 2019 & 2032
- Table 48: Global Knotless Tissue Control Devices Industry Volume K Unit Forecast, by Country 2019 & 2032
- Table 49: GCC Knotless Tissue Control Devices Industry Revenue (Million) Forecast, by Application 2019 & 2032
- Table 50: GCC Knotless Tissue Control Devices Industry Volume (K Unit) Forecast, by Application 2019 & 2032
- Table 51: South Africa Knotless Tissue Control Devices Industry Revenue (Million) Forecast, by Application 2019 & 2032
- Table 52: South Africa Knotless Tissue Control Devices Industry Volume (K Unit) Forecast, by Application 2019 & 2032
- Table 53: Rest of Middle East and Africa Knotless Tissue Control Devices Industry Revenue (Million) Forecast, by Application 2019 & 2032
- Table 54: Rest of Middle East and Africa Knotless Tissue Control Devices Industry Volume (K Unit) Forecast, by Application 2019 & 2032
- Table 55: Global Knotless Tissue Control Devices Industry Revenue Million Forecast, by Country 2019 & 2032
- Table 56: Global Knotless Tissue Control Devices Industry Volume K Unit Forecast, by Country 2019 & 2032
- Table 57: Brazil Knotless Tissue Control Devices Industry Revenue (Million) Forecast, by Application 2019 & 2032
- Table 58: Brazil Knotless Tissue Control Devices Industry Volume (K Unit) Forecast, by Application 2019 & 2032
- Table 59: Argentina Knotless Tissue Control Devices Industry Revenue (Million) Forecast, by Application 2019 & 2032
- Table 60: Argentina Knotless Tissue Control Devices Industry Volume (K Unit) Forecast, by Application 2019 & 2032
- Table 61: Rest of South America Knotless Tissue Control Devices Industry Revenue (Million) Forecast, by Application 2019 & 2032
- Table 62: Rest of South America Knotless Tissue Control Devices Industry Volume (K Unit) Forecast, by Application 2019 & 2032
- Table 63: Global Knotless Tissue Control Devices Industry Revenue Million Forecast, by Product Type 2019 & 2032
- Table 64: Global Knotless Tissue Control Devices Industry Volume K Unit Forecast, by Product Type 2019 & 2032
- Table 65: Global Knotless Tissue Control Devices Industry Revenue Million Forecast, by Material Type 2019 & 2032
- Table 66: Global Knotless Tissue Control Devices Industry Volume K Unit Forecast, by Material Type 2019 & 2032
- Table 67: Global Knotless Tissue Control Devices Industry Revenue Million Forecast, by Tying Type 2019 & 2032
- Table 68: Global Knotless Tissue Control Devices Industry Volume K Unit Forecast, by Tying Type 2019 & 2032
- Table 69: Global Knotless Tissue Control Devices Industry Revenue Million Forecast, by Country 2019 & 2032
- Table 70: Global Knotless Tissue Control Devices Industry Volume K Unit Forecast, by Country 2019 & 2032
- Table 71: United States Knotless Tissue Control Devices Industry Revenue (Million) Forecast, by Application 2019 & 2032
- Table 72: United States Knotless Tissue Control Devices Industry Volume (K Unit) Forecast, by Application 2019 & 2032
- Table 73: Canada Knotless Tissue Control Devices Industry Revenue (Million) Forecast, by Application 2019 & 2032
- Table 74: Canada Knotless Tissue Control Devices Industry Volume (K Unit) Forecast, by Application 2019 & 2032
- Table 75: Mexico Knotless Tissue Control Devices Industry Revenue (Million) Forecast, by Application 2019 & 2032
- Table 76: Mexico Knotless Tissue Control Devices Industry Volume (K Unit) Forecast, by Application 2019 & 2032
- Table 77: Global Knotless Tissue Control Devices Industry Revenue Million Forecast, by Product Type 2019 & 2032
- Table 78: Global Knotless Tissue Control Devices Industry Volume K Unit Forecast, by Product Type 2019 & 2032
- Table 79: Global Knotless Tissue Control Devices Industry Revenue Million Forecast, by Material Type 2019 & 2032
- Table 80: Global Knotless Tissue Control Devices Industry Volume K Unit Forecast, by Material Type 2019 & 2032
- Table 81: Global Knotless Tissue Control Devices Industry Revenue Million Forecast, by Tying Type 2019 & 2032
- Table 82: Global Knotless Tissue Control Devices Industry Volume K Unit Forecast, by Tying Type 2019 & 2032
- Table 83: Global Knotless Tissue Control Devices Industry Revenue Million Forecast, by Country 2019 & 2032
- Table 84: Global Knotless Tissue Control Devices Industry Volume K Unit Forecast, by Country 2019 & 2032
- Table 85: Germany Knotless Tissue Control Devices Industry Revenue (Million) Forecast, by Application 2019 & 2032
- Table 86: Germany Knotless Tissue Control Devices Industry Volume (K Unit) Forecast, by Application 2019 & 2032
- Table 87: United Kingdom Knotless Tissue Control Devices Industry Revenue (Million) Forecast, by Application 2019 & 2032
- Table 88: United Kingdom Knotless Tissue Control Devices Industry Volume (K Unit) Forecast, by Application 2019 & 2032
- Table 89: France Knotless Tissue Control Devices Industry Revenue (Million) Forecast, by Application 2019 & 2032
- Table 90: France Knotless Tissue Control Devices Industry Volume (K Unit) Forecast, by Application 2019 & 2032
- Table 91: Italy Knotless Tissue Control Devices Industry Revenue (Million) Forecast, by Application 2019 & 2032
- Table 92: Italy Knotless Tissue Control Devices Industry Volume (K Unit) Forecast, by Application 2019 & 2032
- Table 93: Spain Knotless Tissue Control Devices Industry Revenue (Million) Forecast, by Application 2019 & 2032
- Table 94: Spain Knotless Tissue Control Devices Industry Volume (K Unit) Forecast, by Application 2019 & 2032
- Table 95: Rest of Europe Knotless Tissue Control Devices Industry Revenue (Million) Forecast, by Application 2019 & 2032
- Table 96: Rest of Europe Knotless Tissue Control Devices Industry Volume (K Unit) Forecast, by Application 2019 & 2032
- Table 97: Global Knotless Tissue Control Devices Industry Revenue Million Forecast, by Product Type 2019 & 2032
- Table 98: Global Knotless Tissue Control Devices Industry Volume K Unit Forecast, by Product Type 2019 & 2032
- Table 99: Global Knotless Tissue Control Devices Industry Revenue Million Forecast, by Material Type 2019 & 2032
- Table 100: Global Knotless Tissue Control Devices Industry Volume K Unit Forecast, by Material Type 2019 & 2032
- Table 101: Global Knotless Tissue Control Devices Industry Revenue Million Forecast, by Tying Type 2019 & 2032
- Table 102: Global Knotless Tissue Control Devices Industry Volume K Unit Forecast, by Tying Type 2019 & 2032
- Table 103: Global Knotless Tissue Control Devices Industry Revenue Million Forecast, by Country 2019 & 2032
- Table 104: Global Knotless Tissue Control Devices Industry Volume K Unit Forecast, by Country 2019 & 2032
- Table 105: China Knotless Tissue Control Devices Industry Revenue (Million) Forecast, by Application 2019 & 2032
- Table 106: China Knotless Tissue Control Devices Industry Volume (K Unit) Forecast, by Application 2019 & 2032
- Table 107: Japan Knotless Tissue Control Devices Industry Revenue (Million) Forecast, by Application 2019 & 2032
- Table 108: Japan Knotless Tissue Control Devices Industry Volume (K Unit) Forecast, by Application 2019 & 2032
- Table 109: India Knotless Tissue Control Devices Industry Revenue (Million) Forecast, by Application 2019 & 2032
- Table 110: India Knotless Tissue Control Devices Industry Volume (K Unit) Forecast, by Application 2019 & 2032
- Table 111: Australia Knotless Tissue Control Devices Industry Revenue (Million) Forecast, by Application 2019 & 2032
- Table 112: Australia Knotless Tissue Control Devices Industry Volume (K Unit) Forecast, by Application 2019 & 2032
- Table 113: South Korea Knotless Tissue Control Devices Industry Revenue (Million) Forecast, by Application 2019 & 2032
- Table 114: South Korea Knotless Tissue Control Devices Industry Volume (K Unit) Forecast, by Application 2019 & 2032
- Table 115: Rest of Asia Pacific Knotless Tissue Control Devices Industry Revenue (Million) Forecast, by Application 2019 & 2032
- Table 116: Rest of Asia Pacific Knotless Tissue Control Devices Industry Volume (K Unit) Forecast, by Application 2019 & 2032
- Table 117: Global Knotless Tissue Control Devices Industry Revenue Million Forecast, by Product Type 2019 & 2032
- Table 118: Global Knotless Tissue Control Devices Industry Volume K Unit Forecast, by Product Type 2019 & 2032
- Table 119: Global Knotless Tissue Control Devices Industry Revenue Million Forecast, by Material Type 2019 & 2032
- Table 120: Global Knotless Tissue Control Devices Industry Volume K Unit Forecast, by Material Type 2019 & 2032
- Table 121: Global Knotless Tissue Control Devices Industry Revenue Million Forecast, by Tying Type 2019 & 2032
- Table 122: Global Knotless Tissue Control Devices Industry Volume K Unit Forecast, by Tying Type 2019 & 2032
- Table 123: Global Knotless Tissue Control Devices Industry Revenue Million Forecast, by Country 2019 & 2032
- Table 124: Global Knotless Tissue Control Devices Industry Volume K Unit Forecast, by Country 2019 & 2032
- Table 125: GCC Knotless Tissue Control Devices Industry Revenue (Million) Forecast, by Application 2019 & 2032
- Table 126: GCC Knotless Tissue Control Devices Industry Volume (K Unit) Forecast, by Application 2019 & 2032
- Table 127: South Africa Knotless Tissue Control Devices Industry Revenue (Million) Forecast, by Application 2019 & 2032
- Table 128: South Africa Knotless Tissue Control Devices Industry Volume (K Unit) Forecast, by Application 2019 & 2032
- Table 129: Rest of Middle East and Africa Knotless Tissue Control Devices Industry Revenue (Million) Forecast, by Application 2019 & 2032
- Table 130: Rest of Middle East and Africa Knotless Tissue Control Devices Industry Volume (K Unit) Forecast, by Application 2019 & 2032
- Table 131: Global Knotless Tissue Control Devices Industry Revenue Million Forecast, by Product Type 2019 & 2032
- Table 132: Global Knotless Tissue Control Devices Industry Volume K Unit Forecast, by Product Type 2019 & 2032
- Table 133: Global Knotless Tissue Control Devices Industry Revenue Million Forecast, by Material Type 2019 & 2032
- Table 134: Global Knotless Tissue Control Devices Industry Volume K Unit Forecast, by Material Type 2019 & 2032
- Table 135: Global Knotless Tissue Control Devices Industry Revenue Million Forecast, by Tying Type 2019 & 2032
- Table 136: Global Knotless Tissue Control Devices Industry Volume K Unit Forecast, by Tying Type 2019 & 2032
- Table 137: Global Knotless Tissue Control Devices Industry Revenue Million Forecast, by Country 2019 & 2032
- Table 138: Global Knotless Tissue Control Devices Industry Volume K Unit Forecast, by Country 2019 & 2032
- Table 139: Brazil Knotless Tissue Control Devices Industry Revenue (Million) Forecast, by Application 2019 & 2032
- Table 140: Brazil Knotless Tissue Control Devices Industry Volume (K Unit) Forecast, by Application 2019 & 2032
- Table 141: Argentina Knotless Tissue Control Devices Industry Revenue (Million) Forecast, by Application 2019 & 2032
- Table 142: Argentina Knotless Tissue Control Devices Industry Volume (K Unit) Forecast, by Application 2019 & 2032
- Table 143: Rest of South America Knotless Tissue Control Devices Industry Revenue (Million) Forecast, by Application 2019 & 2032
- Table 144: Rest of South America Knotless Tissue Control Devices Industry Volume (K Unit) Forecast, by Application 2019 & 2032
Frequently Asked Questions
1. What is the projected Compound Annual Growth Rate (CAGR) of the Knotless Tissue Control Devices Industry?
The projected CAGR is approximately 5.50%.
2. Which companies are prominent players in the Knotless Tissue Control Devices Industry?
Key companies in the market include Arthrex Inc, Johnson and Johnson (DePuy Synthes Inc ), ConMed Corporation, Orthomed, Enovis, Parcus Medical LLC, Zimmer Biomet Holdings, Stryker Corporation, Teknimed, Smith & Nephew plc, Wright Medical, Medtronic plc.
3. What are the main segments of the Knotless Tissue Control Devices Industry?
The market segments include Product Type, Material Type, Tying Type.
4. Can you provide details about the market size?
The market size is estimated to be USD XX Million as of 2022.
5. What are some drivers contributing to market growth?
Increasing Orthopedic injuries in geriatric population; Demand for minimally-invasive surgeries; Rising Number of Sports Accidents.
6. What are the notable trends driving market growth?
Knotless Segment is Expected to Hold a Major Market Share in the Suture Anchor Devices Market.
7. Are there any restraints impacting market growth?
Varying degree of tissue reaction.
8. Can you provide examples of recent developments in the market?
N/A
9. What pricing options are available for accessing the report?
Pricing options include single-user, multi-user, and enterprise licenses priced at USD 4750, USD 5250, and USD 8750 respectively.
10. Is the market size provided in terms of value or volume?
The market size is provided in terms of value, measured in Million and volume, measured in K Unit.
11. Are there any specific market keywords associated with the report?
Yes, the market keyword associated with the report is "Knotless Tissue Control Devices Industry," which aids in identifying and referencing the specific market segment covered.
12. How do I determine which pricing option suits my needs best?
The pricing options vary based on user requirements and access needs. Individual users may opt for single-user licenses, while businesses requiring broader access may choose multi-user or enterprise licenses for cost-effective access to the report.
13. Are there any additional resources or data provided in the Knotless Tissue Control Devices Industry report?
While the report offers comprehensive insights, it's advisable to review the specific contents or supplementary materials provided to ascertain if additional resources or data are available.
14. How can I stay updated on further developments or reports in the Knotless Tissue Control Devices Industry?
To stay informed about further developments, trends, and reports in the Knotless Tissue Control Devices Industry, consider subscribing to industry newsletters, following relevant companies and organizations, or regularly checking reputable industry news sources and publications.
Methodology
Step 1 - Identification of Relevant Samples Size from Population Database


Step 2 - Approaches for Defining Global Market Size (Value, Volume* & Price*)

Note*: In applicable scenarios
Step 3 - Data Sources
Primary Research
- Web Analytics
- Survey Reports
- Research Institute
- Latest Research Reports
- Opinion Leaders
Secondary Research
- Annual Reports
- White Paper
- Latest Press Release
- Industry Association
- Paid Database
- Investor Presentations

Step 4 - Data Triangulation
Involves using different sources of information in order to increase the validity of a study
These sources are likely to be stakeholders in a program - participants, other researchers, program staff, other community members, and so on.
Then we put all data in single framework & apply various statistical tools to find out the dynamic on the market.
During the analysis stage, feedback from the stakeholder groups would be compared to determine areas of agreement as well as areas of divergence


