
Key Insights
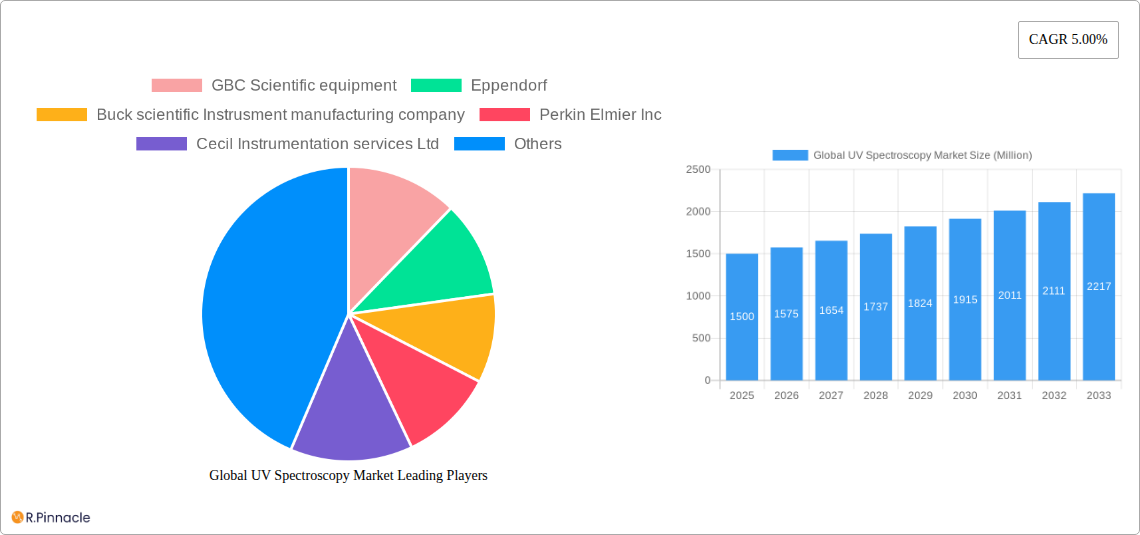
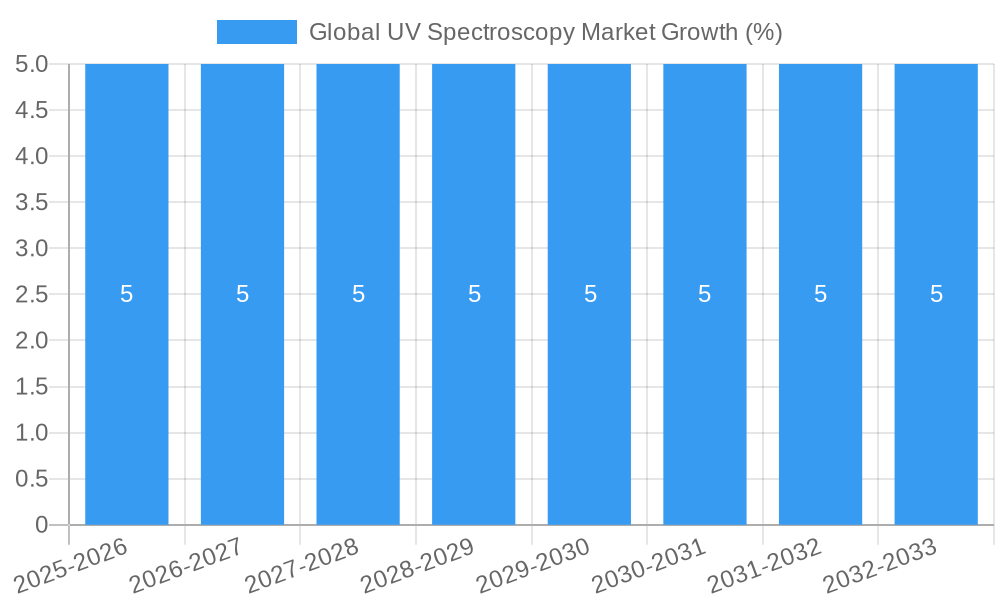
The Global UV Spectroscopy Market is poised for substantial growth, projected to reach a market size of approximately $1.5 billion by 2025, with a compound annual growth rate (CAGR) of 5.00% expected to drive it towards an estimated $2.0 billion by 2033. This robust expansion is primarily fueled by the increasing demand for precise analytical instrumentation across diverse sectors, including pharmaceutical and biotechnology industries for drug discovery and quality control, as well as academic and research institutions for advanced scientific investigations. The growing emphasis on environmental monitoring and compliance further bolsters market penetration. Key drivers include advancements in detector technology, miniaturization of instruments, and the development of software for enhanced data analysis and interpretation. The increasing R&D investments in life sciences and the burgeoning biopharmaceutical sector are creating a fertile ground for UV spectroscopy adoption.
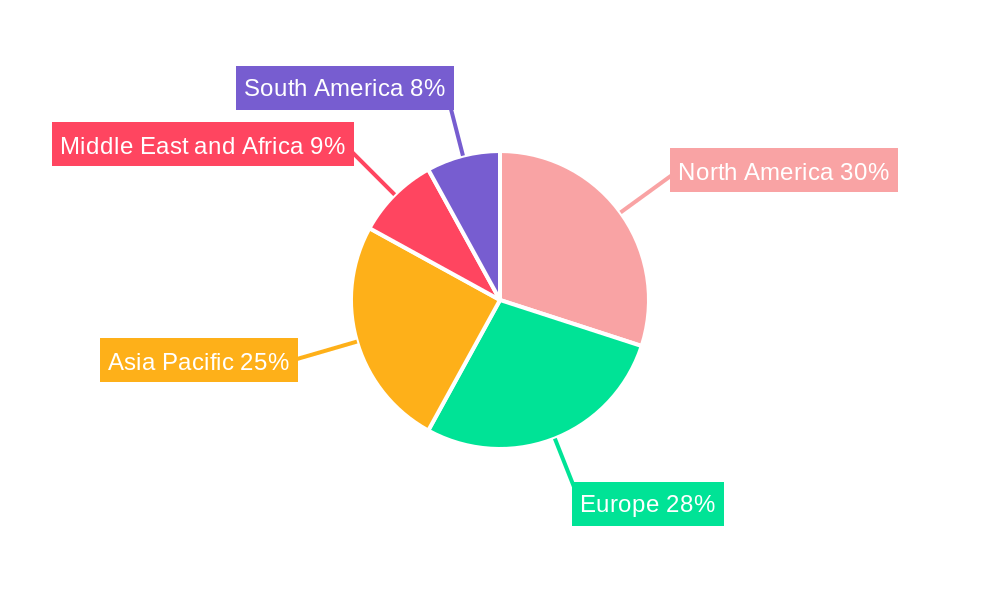
The market segmentation reveals a dynamic landscape, with dual-beam and array-based systems gaining traction due to their superior accuracy and throughput compared to single-beam instruments. In terms of applications, industrial uses, particularly in quality assurance and process monitoring, are on an upward trajectory, complementing the established significance of academic research and environmental studies. Geographically, North America and Europe currently dominate the market, owing to well-established research infrastructures and a strong presence of pharmaceutical giants. However, the Asia Pacific region, led by China and India, is emerging as a significant growth engine, driven by expanding healthcare initiatives, increasing R&D expenditure, and a rising number of research facilities. Restraints such as the high initial cost of sophisticated UV spectroscopy systems and the availability of alternative analytical techniques are being progressively overcome by technological innovations and a growing awareness of the indispensable benefits offered by UV spectroscopy in complex analytical workflows.
This in-depth report provides a definitive analysis of the Global UV Spectroscopy Market, offering critical insights into market structure, dynamics, regional dominance, product innovations, and future outlook. Leverage this essential resource to understand key trends, growth drivers, and emerging opportunities within the UV-Vis spectrophotometer market, spectroscopy instrumentation, and related analytical instrument sectors. The report covers the study period 2019–2033, with a base year of 2025, and a forecast period from 2025–2033, building on historical data from 2019–2024.
Global UV Spectroscopy Market Market Structure & Innovation Trends
The global UV spectroscopy market exhibits a moderately concentrated structure, with a mix of established giants and emerging players vying for market share. Innovation is a primary driver, fueled by advancements in spectroscopy technology, miniaturization, and improved data analysis capabilities. Regulatory frameworks, particularly within the pharmaceutical and environmental sectors, also significantly shape market development and product specifications. The market is further influenced by the availability of product substitutes, such as IR spectroscopy or Raman spectroscopy, although UV spectroscopy maintains its unique advantages for specific applications. End-user demographics are increasingly shifting towards academic and research institutions seeking cost-effective yet precise analytical tools, alongside the persistent demand from the pharmaceutical and biotechnology industries for quality control and R&D. Mergers and acquisitions (M&A) remain a strategic tool for market consolidation and technology acquisition. For instance, recent M&A activities have seen larger entities absorbing smaller innovative firms to expand their spectrophotometer portfolio and geographical reach. Market share distribution is closely watched, with key players like Thermo Fisher Scientific and Shimadzu Corporation holding significant portions. M&A deal values are anticipated to see continued growth as companies seek to enhance their competitive edge.
Global UV Spectroscopy Market Market Dynamics & Trends
The Global UV Spectroscopy Market is poised for robust growth, driven by several interconnected dynamics and evolving trends. A primary growth driver is the escalating demand for sophisticated analytical instruments in pharmaceutical and biotechnology industries for drug discovery, quality control, and manufacturing processes. The stringent regulatory landscape, demanding high levels of precision and accuracy in testing, further propels the adoption of advanced UV spectrophotometers. Technological disruptions, including the development of portable UV spectrophotometers, increased automation, and enhanced software integration, are revolutionizing laboratory workflows and broadening application areas. The shift towards miniaturized and more affordable UV-Vis spectrophotometers is also making these technologies accessible to a wider range of academic and research institutions. Consumer preferences are increasingly leaning towards user-friendly interfaces, faster analysis times, and comprehensive data management solutions that comply with FDA 21 CFR Part 11 and similar regulations. Competitive dynamics are characterized by intense innovation, strategic partnerships, and price competitiveness. Companies are investing heavily in R&D to develop next-generation instruments with improved sensitivity, resolution, and spectral range, including the UV-visible-NIR microspectrophotometer. The CAGR for the UV spectroscopy market is projected to be healthy, reflecting the sustained demand across various end-use sectors. Market penetration is steadily increasing, especially in emerging economies where investment in scientific infrastructure is on the rise. The integration of AI and machine learning for spectral interpretation is another significant trend shaping market penetration.
Dominant Regions & Segments in Global UV Spectroscopy Market
North America currently dominates the global UV spectroscopy market, driven by its robust pharmaceutical and biotechnology sectors, significant investments in research and development, and a strong presence of leading analytical instrument manufacturers. The United States, in particular, stands out due to its advanced healthcare infrastructure and stringent quality control standards.
Key Drivers of Regional Dominance:
- Economic Policies: Favorable government initiatives and funding for scientific research in North America foster innovation and adoption of advanced spectroscopy instruments.
- Infrastructure: Well-established healthcare and academic research infrastructure supports the demand for sophisticated laboratory equipment.
Dominant Segments Analysis:
Instrument: Dual Beam Dual-beam spectrophotometers are a cornerstone of the market, offering superior accuracy and stability compared to single-beam systems. Their widespread adoption in critical applications like pharmaceutical QC and research, where precise absorbance measurements are paramount, solidifies their dominant position. The Dual Beam UV Spectrophotometer market is experiencing steady growth due to its reliability in demanding environments.
Application: Pharmaceutical and Biotechnology Industries This segment represents the largest and most dynamic end-user of UV spectroscopy. The industry relies heavily on these instruments for a wide array of applications, including raw material testing, finished product analysis, stability studies, and impurity profiling. The increasing pipeline of new drugs and the growing focus on biopharmaceuticals further fuel demand.
End Users: Pharmaceutical and Biotechnology Industries The pharmaceutical and biotechnology sectors are the primary consumers, demanding high-performance UV spectrophotometers for rigorous quality assurance and groundbreaking research. Their continuous need for accurate and reliable data in drug development and manufacturing processes makes them the most significant end-user group.
The Asia-Pacific region is emerging as a high-growth market, fueled by rapid industrialization, increasing healthcare expenditure, and expanding research activities in countries like China and India. Advancements in spectroscopy instrumentation and growing adoption in environmental studies are also contributing to market expansion.
Global UV Spectroscopy Market Product Innovations
Product innovations in the global UV spectroscopy market are significantly enhancing analytical capabilities and accessibility. The introduction of advanced UV-Vis spectrophotometers with broader spectral ranges, such as the CRAIC technologies 2030 PV PRO UV-visible-NIR microspectrophotometer, allows for the non-destructive analysis of microscopic samples across deep ultraviolet to near-infrared regions. Furthermore, integration with software suites, like Agilent Technologies Inc.'s Agilent open lab software for the Cary 3500 UV-Vis spectrophotometer, streamlines data management, security, and compliance with regulatory requirements. These innovations offer competitive advantages by improving precision, enabling new analytical applications, and ensuring seamless integration into laboratory workflows, thereby driving market growth for analytical instruments.
Report Scope & Segmentation Analysis
The report encompasses a comprehensive segmentation of the Global UV Spectroscopy Market, providing detailed insights into each segment's market size, growth projections, and competitive dynamics.
Instrument: This segment is bifurcated into Single-Beam, Dual Beam, and Array-Based Systems. Dual-beam systems are expected to maintain significant market share due to their precision, while array-based systems are gaining traction for their speed and efficiency in high-throughput applications. Single-beam systems continue to be relevant for basic applications and budget-conscious users.
Application: Key applications include Academic, Industrial, and Environmental studies. The Industrial segment, driven by pharmaceutical and chemical industries, holds a substantial share. Academic research, with its focus on fundamental scientific exploration, and environmental studies, necessitating routine monitoring, also contribute significantly to market demand.
End Users: The primary end-user segments are Pharmaceutical and Biotechnology Industries and Academic and Research Institutions. The Pharmaceutical and Biotechnology Industries segment is projected for strong growth due to constant R&D and stringent quality control needs. Academic and Research Institutions represent a stable and growing market, driven by ongoing scientific advancements.
Key Drivers of Global UV Spectroscopy Market Growth
The Global UV Spectroscopy Market is propelled by several key factors:
- Technological Advancements: Continuous innovation in detector technology, optics, and software integration leads to more sensitive, accurate, and user-friendly UV spectrophotometers. The development of portable UV-Vis spectrophotometers expands accessibility.
- Increasing R&D Spending: Significant investments in pharmaceutical, biotechnology, and academic research globally necessitate advanced analytical tools for drug discovery, material science, and fundamental scientific inquiry.
- Stringent Quality Control Regulations: Regulatory bodies worldwide mandate rigorous testing and quality assurance protocols, driving the demand for reliable spectroscopy instrumentation in industries like pharmaceuticals and food & beverage.
- Growing Demand in Emerging Economies: Rapid industrialization and increasing healthcare investments in regions like Asia-Pacific are expanding the market for analytical instruments, including UV spectrometers.
Challenges in the Global UV Spectroscopy Market Sector
Despite its growth, the Global UV Spectroscopy Market faces several challenges:
- High Initial Investment Cost: Advanced UV spectrophotometers can represent a substantial capital expenditure, potentially limiting adoption by smaller institutions or businesses.
- Competition from Alternative Technologies: While UV spectroscopy is indispensable for many applications, other spectroscopic techniques like FTIR and Raman spectroscopy offer complementary or alternative solutions, creating competitive pressure.
- Skilled Workforce Requirements: Operating and maintaining sophisticated spectroscopy instrumentation requires trained personnel, which can be a barrier in regions with limited availability of skilled technicians.
- Supply Chain Disruptions: Global supply chain volatilities can impact the availability of critical components for spectrophotometer manufacturing, potentially leading to production delays and price fluctuations.
Emerging Opportunities in Global UV Spectroscopy Market
The Global UV Spectroscopy Market is ripe with emerging opportunities:
- Miniaturization and Portability: The development of compact and portable UV spectrophotometers opens up new applications in field testing, point-of-care diagnostics, and on-site quality control, expanding market reach beyond traditional laboratory settings.
- Integration with AI and Machine Learning: The application of AI for spectral data analysis promises enhanced interpretation, predictive capabilities, and automation, driving demand for intelligent UV-Vis spectrophotometers.
- Growth in Emerging Markets: The expanding healthcare and industrial sectors in developing economies present significant untapped potential for analytical instrument adoption.
- Niche Applications: Exploring and developing specialized UV spectroscopy solutions for emerging fields like personalized medicine, advanced materials, and environmental monitoring can create new market segments.
Leading Players in the Global UV Spectroscopy Market Market
- GBC Scientific equipment
- Eppendorf
- Buck scientific Instrusment manufacturing company
- Perkin Elmier Inc
- Cecil Instrumentation services Ltd
- Utech Labs
- Danher
- ThermoFisher Scientific
- Biochrom Ltd
- Cole- Parmer Instrument Company LLC
- Shimadzu Corporation
- Analaytik Jena GmbH
Key Developments in Global UV Spectroscopy Market Industry
- January 2022: CRAIC Technologies introduced the 2030 PV PRO UV-visible-NIR microspectrophotometer, designed for non-destructive analysis of microscopic samples from deep ultraviolet to near-infrared. This innovation expands capabilities for specialized material analysis.
- December 2021: Agilent Technologies Inc. announced that its Cary 3500 UV-Vis spectrophotometer is now compatible with the Agilent open lab software suite. This integration enhances secure data management and compliance with global regulatory requirements.
Future Outlook for Global UV Spectroscopy Market Market
The future outlook for the Global UV Spectroscopy Market is highly promising, driven by relentless innovation and expanding application frontiers. The continuous pursuit of higher sensitivity, greater accuracy, and enhanced user experience in UV spectrophotometers will fuel market growth. The increasing adoption of portable UV spectrophotometers and the integration of advanced data analytics, including AI, will democratize access to powerful analytical capabilities. Furthermore, the persistent demand from the pharmaceutical, biotechnology, and academic sectors, coupled with the burgeoning industrial development in emerging economies, will act as significant growth accelerators. Strategic collaborations, mergers, and acquisitions are expected to shape the competitive landscape, leading to more integrated solutions and a broader market reach for analytical instrument providers. The market is set to witness sustained expansion as it continues to play a pivotal role in scientific discovery, quality assurance, and industrial innovation.
Global UV Spectroscopy Market Segmentation
-
1. Instrument
- 1.1. Single-Beam
- 1.2. Dual Beam
- 1.3. Array- Based Systems
-
2. Application
- 2.1. Academic
- 2.2. Industrial
- 2.3. Environmental studies
-
3. End Users
- 3.1. Pharmaceutical and Biotechnology Industries
- 3.2. Academic and Research Institutions
Global UV Spectroscopy Market Segmentation By Geography
-
1. North America
- 1.1. United States
- 1.2. Canada
- 1.3. Mexico
-
2. Europe
- 2.1. Germany
- 2.2. United Kingdom
- 2.3. France
- 2.4. Italy
- 2.5. Spain
- 2.6. Rest of Europe
-
3. Asia Pacific
- 3.1. China
- 3.2. Japan
- 3.3. India
- 3.4. Australia
- 3.5. South Korea
- 3.6. Rest of Asia Pacific
-
4. Middle East and Africa
- 4.1. GCC
- 4.2. South Africa
- 4.3. Rest of Middle East and Africa
-
5. South America
- 5.1. Brazil
- 5.2. Argentina
- 5.3. Rest of South America
Global UV Spectroscopy Market REPORT HIGHLIGHTS
| Aspects | Details |
|---|---|
| Study Period | 2019-2033 |
| Base Year | 2024 |
| Estimated Year | 2025 |
| Forecast Period | 2025-2033 |
| Historical Period | 2019-2024 |
| Growth Rate | CAGR of 5.00% from 2019-2033 |
| Segmentation |
|
Table of Contents
- 1. Introduction
- 1.1. Research Scope
- 1.2. Market Segmentation
- 1.3. Research Methodology
- 1.4. Definitions and Assumptions
- 2. Executive Summary
- 2.1. Introduction
- 3. Market Dynamics
- 3.1. Introduction
- 3.2. Market Drivers
- 3.2.1. Rising application of Ultraviolet-spectroscophy in pharamecutical and biotechnology industries.; Technological advancements
- 3.3. Market Restrains
- 3.3.1. Lack of experienced professional; Longevity of Instruments
- 3.4. Market Trends
- 3.4.1. The Pharmaceutical and Biotechnology industry Segment is Expected to Hold a Major Market Share in the UV spectroscopy Market
- 4. Market Factor Analysis
- 4.1. Porters Five Forces
- 4.2. Supply/Value Chain
- 4.3. PESTEL analysis
- 4.4. Market Entropy
- 4.5. Patent/Trademark Analysis
- 5. Global UV Spectroscopy Market Analysis, Insights and Forecast, 2019-2031
- 5.1. Market Analysis, Insights and Forecast - by Instrument
- 5.1.1. Single-Beam
- 5.1.2. Dual Beam
- 5.1.3. Array- Based Systems
- 5.2. Market Analysis, Insights and Forecast - by Application
- 5.2.1. Academic
- 5.2.2. Industrial
- 5.2.3. Environmental studies
- 5.3. Market Analysis, Insights and Forecast - by End Users
- 5.3.1. Pharmaceutical and Biotechnology Industries
- 5.3.2. Academic and Research Institutions
- 5.4. Market Analysis, Insights and Forecast - by Region
- 5.4.1. North America
- 5.4.2. Europe
- 5.4.3. Asia Pacific
- 5.4.4. Middle East and Africa
- 5.4.5. South America
- 5.1. Market Analysis, Insights and Forecast - by Instrument
- 6. North America Global UV Spectroscopy Market Analysis, Insights and Forecast, 2019-2031
- 6.1. Market Analysis, Insights and Forecast - by Instrument
- 6.1.1. Single-Beam
- 6.1.2. Dual Beam
- 6.1.3. Array- Based Systems
- 6.2. Market Analysis, Insights and Forecast - by Application
- 6.2.1. Academic
- 6.2.2. Industrial
- 6.2.3. Environmental studies
- 6.3. Market Analysis, Insights and Forecast - by End Users
- 6.3.1. Pharmaceutical and Biotechnology Industries
- 6.3.2. Academic and Research Institutions
- 6.1. Market Analysis, Insights and Forecast - by Instrument
- 7. Europe Global UV Spectroscopy Market Analysis, Insights and Forecast, 2019-2031
- 7.1. Market Analysis, Insights and Forecast - by Instrument
- 7.1.1. Single-Beam
- 7.1.2. Dual Beam
- 7.1.3. Array- Based Systems
- 7.2. Market Analysis, Insights and Forecast - by Application
- 7.2.1. Academic
- 7.2.2. Industrial
- 7.2.3. Environmental studies
- 7.3. Market Analysis, Insights and Forecast - by End Users
- 7.3.1. Pharmaceutical and Biotechnology Industries
- 7.3.2. Academic and Research Institutions
- 7.1. Market Analysis, Insights and Forecast - by Instrument
- 8. Asia Pacific Global UV Spectroscopy Market Analysis, Insights and Forecast, 2019-2031
- 8.1. Market Analysis, Insights and Forecast - by Instrument
- 8.1.1. Single-Beam
- 8.1.2. Dual Beam
- 8.1.3. Array- Based Systems
- 8.2. Market Analysis, Insights and Forecast - by Application
- 8.2.1. Academic
- 8.2.2. Industrial
- 8.2.3. Environmental studies
- 8.3. Market Analysis, Insights and Forecast - by End Users
- 8.3.1. Pharmaceutical and Biotechnology Industries
- 8.3.2. Academic and Research Institutions
- 8.1. Market Analysis, Insights and Forecast - by Instrument
- 9. Middle East and Africa Global UV Spectroscopy Market Analysis, Insights and Forecast, 2019-2031
- 9.1. Market Analysis, Insights and Forecast - by Instrument
- 9.1.1. Single-Beam
- 9.1.2. Dual Beam
- 9.1.3. Array- Based Systems
- 9.2. Market Analysis, Insights and Forecast - by Application
- 9.2.1. Academic
- 9.2.2. Industrial
- 9.2.3. Environmental studies
- 9.3. Market Analysis, Insights and Forecast - by End Users
- 9.3.1. Pharmaceutical and Biotechnology Industries
- 9.3.2. Academic and Research Institutions
- 9.1. Market Analysis, Insights and Forecast - by Instrument
- 10. South America Global UV Spectroscopy Market Analysis, Insights and Forecast, 2019-2031
- 10.1. Market Analysis, Insights and Forecast - by Instrument
- 10.1.1. Single-Beam
- 10.1.2. Dual Beam
- 10.1.3. Array- Based Systems
- 10.2. Market Analysis, Insights and Forecast - by Application
- 10.2.1. Academic
- 10.2.2. Industrial
- 10.2.3. Environmental studies
- 10.3. Market Analysis, Insights and Forecast - by End Users
- 10.3.1. Pharmaceutical and Biotechnology Industries
- 10.3.2. Academic and Research Institutions
- 10.1. Market Analysis, Insights and Forecast - by Instrument
- 11. North America Global UV Spectroscopy Market Analysis, Insights and Forecast, 2019-2031
- 11.1. Market Analysis, Insights and Forecast - By Country/Sub-region
- 11.1.1 United States
- 11.1.2 Canada
- 11.1.3 Mexico
- 12. Europe Global UV Spectroscopy Market Analysis, Insights and Forecast, 2019-2031
- 12.1. Market Analysis, Insights and Forecast - By Country/Sub-region
- 12.1.1 Germany
- 12.1.2 United Kingdom
- 12.1.3 France
- 12.1.4 Italy
- 12.1.5 Spain
- 12.1.6 Rest of Europe
- 13. Asia Pacific Global UV Spectroscopy Market Analysis, Insights and Forecast, 2019-2031
- 13.1. Market Analysis, Insights and Forecast - By Country/Sub-region
- 13.1.1 China
- 13.1.2 Japan
- 13.1.3 India
- 13.1.4 Australia
- 13.1.5 South Korea
- 13.1.6 Rest of Asia Pacific
- 14. Middle East and Africa Global UV Spectroscopy Market Analysis, Insights and Forecast, 2019-2031
- 14.1. Market Analysis, Insights and Forecast - By Country/Sub-region
- 14.1.1 GCC
- 14.1.2 South Africa
- 14.1.3 Rest of Middle East and Africa
- 15. South America Global UV Spectroscopy Market Analysis, Insights and Forecast, 2019-2031
- 15.1. Market Analysis, Insights and Forecast - By Country/Sub-region
- 15.1.1 Brazil
- 15.1.2 Argentina
- 15.1.3 Rest of South America
- 16. Competitive Analysis
- 16.1. Market Share Analysis 2024
- 16.2. Company Profiles
- 16.2.1 GBC Scientific equipment
- 16.2.1.1. Overview
- 16.2.1.2. Products
- 16.2.1.3. SWOT Analysis
- 16.2.1.4. Recent Developments
- 16.2.1.5. Financials (Based on Availability)
- 16.2.2 Eppendorf
- 16.2.2.1. Overview
- 16.2.2.2. Products
- 16.2.2.3. SWOT Analysis
- 16.2.2.4. Recent Developments
- 16.2.2.5. Financials (Based on Availability)
- 16.2.3 Buck scientific Instrusment manufacturing company
- 16.2.3.1. Overview
- 16.2.3.2. Products
- 16.2.3.3. SWOT Analysis
- 16.2.3.4. Recent Developments
- 16.2.3.5. Financials (Based on Availability)
- 16.2.4 Perkin Elmier Inc
- 16.2.4.1. Overview
- 16.2.4.2. Products
- 16.2.4.3. SWOT Analysis
- 16.2.4.4. Recent Developments
- 16.2.4.5. Financials (Based on Availability)
- 16.2.5 Cecil Instrumentation services Ltd
- 16.2.5.1. Overview
- 16.2.5.2. Products
- 16.2.5.3. SWOT Analysis
- 16.2.5.4. Recent Developments
- 16.2.5.5. Financials (Based on Availability)
- 16.2.6 Utech Labs
- 16.2.6.1. Overview
- 16.2.6.2. Products
- 16.2.6.3. SWOT Analysis
- 16.2.6.4. Recent Developments
- 16.2.6.5. Financials (Based on Availability)
- 16.2.7 Danher
- 16.2.7.1. Overview
- 16.2.7.2. Products
- 16.2.7.3. SWOT Analysis
- 16.2.7.4. Recent Developments
- 16.2.7.5. Financials (Based on Availability)
- 16.2.8 ThermoFisher Scientific
- 16.2.8.1. Overview
- 16.2.8.2. Products
- 16.2.8.3. SWOT Analysis
- 16.2.8.4. Recent Developments
- 16.2.8.5. Financials (Based on Availability)
- 16.2.9 Biochrom Ltd
- 16.2.9.1. Overview
- 16.2.9.2. Products
- 16.2.9.3. SWOT Analysis
- 16.2.9.4. Recent Developments
- 16.2.9.5. Financials (Based on Availability)
- 16.2.10 Cole- Parmer instrument company LLC
- 16.2.10.1. Overview
- 16.2.10.2. Products
- 16.2.10.3. SWOT Analysis
- 16.2.10.4. Recent Developments
- 16.2.10.5. Financials (Based on Availability)
- 16.2.11 Shimadzu Corporation
- 16.2.11.1. Overview
- 16.2.11.2. Products
- 16.2.11.3. SWOT Analysis
- 16.2.11.4. Recent Developments
- 16.2.11.5. Financials (Based on Availability)
- 16.2.12 Analaytik Jena GmbH
- 16.2.12.1. Overview
- 16.2.12.2. Products
- 16.2.12.3. SWOT Analysis
- 16.2.12.4. Recent Developments
- 16.2.12.5. Financials (Based on Availability)
- 16.2.1 GBC Scientific equipment
List of Figures
- Figure 1: Global Global UV Spectroscopy Market Revenue Breakdown (Million, %) by Region 2024 & 2032
- Figure 2: Global Global UV Spectroscopy Market Volume Breakdown (K Unit, %) by Region 2024 & 2032
- Figure 3: North America Global UV Spectroscopy Market Revenue (Million), by Country 2024 & 2032
- Figure 4: North America Global UV Spectroscopy Market Volume (K Unit), by Country 2024 & 2032
- Figure 5: North America Global UV Spectroscopy Market Revenue Share (%), by Country 2024 & 2032
- Figure 6: North America Global UV Spectroscopy Market Volume Share (%), by Country 2024 & 2032
- Figure 7: Europe Global UV Spectroscopy Market Revenue (Million), by Country 2024 & 2032
- Figure 8: Europe Global UV Spectroscopy Market Volume (K Unit), by Country 2024 & 2032
- Figure 9: Europe Global UV Spectroscopy Market Revenue Share (%), by Country 2024 & 2032
- Figure 10: Europe Global UV Spectroscopy Market Volume Share (%), by Country 2024 & 2032
- Figure 11: Asia Pacific Global UV Spectroscopy Market Revenue (Million), by Country 2024 & 2032
- Figure 12: Asia Pacific Global UV Spectroscopy Market Volume (K Unit), by Country 2024 & 2032
- Figure 13: Asia Pacific Global UV Spectroscopy Market Revenue Share (%), by Country 2024 & 2032
- Figure 14: Asia Pacific Global UV Spectroscopy Market Volume Share (%), by Country 2024 & 2032
- Figure 15: Middle East and Africa Global UV Spectroscopy Market Revenue (Million), by Country 2024 & 2032
- Figure 16: Middle East and Africa Global UV Spectroscopy Market Volume (K Unit), by Country 2024 & 2032
- Figure 17: Middle East and Africa Global UV Spectroscopy Market Revenue Share (%), by Country 2024 & 2032
- Figure 18: Middle East and Africa Global UV Spectroscopy Market Volume Share (%), by Country 2024 & 2032
- Figure 19: South America Global UV Spectroscopy Market Revenue (Million), by Country 2024 & 2032
- Figure 20: South America Global UV Spectroscopy Market Volume (K Unit), by Country 2024 & 2032
- Figure 21: South America Global UV Spectroscopy Market Revenue Share (%), by Country 2024 & 2032
- Figure 22: South America Global UV Spectroscopy Market Volume Share (%), by Country 2024 & 2032
- Figure 23: North America Global UV Spectroscopy Market Revenue (Million), by Instrument 2024 & 2032
- Figure 24: North America Global UV Spectroscopy Market Volume (K Unit), by Instrument 2024 & 2032
- Figure 25: North America Global UV Spectroscopy Market Revenue Share (%), by Instrument 2024 & 2032
- Figure 26: North America Global UV Spectroscopy Market Volume Share (%), by Instrument 2024 & 2032
- Figure 27: North America Global UV Spectroscopy Market Revenue (Million), by Application 2024 & 2032
- Figure 28: North America Global UV Spectroscopy Market Volume (K Unit), by Application 2024 & 2032
- Figure 29: North America Global UV Spectroscopy Market Revenue Share (%), by Application 2024 & 2032
- Figure 30: North America Global UV Spectroscopy Market Volume Share (%), by Application 2024 & 2032
- Figure 31: North America Global UV Spectroscopy Market Revenue (Million), by End Users 2024 & 2032
- Figure 32: North America Global UV Spectroscopy Market Volume (K Unit), by End Users 2024 & 2032
- Figure 33: North America Global UV Spectroscopy Market Revenue Share (%), by End Users 2024 & 2032
- Figure 34: North America Global UV Spectroscopy Market Volume Share (%), by End Users 2024 & 2032
- Figure 35: North America Global UV Spectroscopy Market Revenue (Million), by Country 2024 & 2032
- Figure 36: North America Global UV Spectroscopy Market Volume (K Unit), by Country 2024 & 2032
- Figure 37: North America Global UV Spectroscopy Market Revenue Share (%), by Country 2024 & 2032
- Figure 38: North America Global UV Spectroscopy Market Volume Share (%), by Country 2024 & 2032
- Figure 39: Europe Global UV Spectroscopy Market Revenue (Million), by Instrument 2024 & 2032
- Figure 40: Europe Global UV Spectroscopy Market Volume (K Unit), by Instrument 2024 & 2032
- Figure 41: Europe Global UV Spectroscopy Market Revenue Share (%), by Instrument 2024 & 2032
- Figure 42: Europe Global UV Spectroscopy Market Volume Share (%), by Instrument 2024 & 2032
- Figure 43: Europe Global UV Spectroscopy Market Revenue (Million), by Application 2024 & 2032
- Figure 44: Europe Global UV Spectroscopy Market Volume (K Unit), by Application 2024 & 2032
- Figure 45: Europe Global UV Spectroscopy Market Revenue Share (%), by Application 2024 & 2032
- Figure 46: Europe Global UV Spectroscopy Market Volume Share (%), by Application 2024 & 2032
- Figure 47: Europe Global UV Spectroscopy Market Revenue (Million), by End Users 2024 & 2032
- Figure 48: Europe Global UV Spectroscopy Market Volume (K Unit), by End Users 2024 & 2032
- Figure 49: Europe Global UV Spectroscopy Market Revenue Share (%), by End Users 2024 & 2032
- Figure 50: Europe Global UV Spectroscopy Market Volume Share (%), by End Users 2024 & 2032
- Figure 51: Europe Global UV Spectroscopy Market Revenue (Million), by Country 2024 & 2032
- Figure 52: Europe Global UV Spectroscopy Market Volume (K Unit), by Country 2024 & 2032
- Figure 53: Europe Global UV Spectroscopy Market Revenue Share (%), by Country 2024 & 2032
- Figure 54: Europe Global UV Spectroscopy Market Volume Share (%), by Country 2024 & 2032
- Figure 55: Asia Pacific Global UV Spectroscopy Market Revenue (Million), by Instrument 2024 & 2032
- Figure 56: Asia Pacific Global UV Spectroscopy Market Volume (K Unit), by Instrument 2024 & 2032
- Figure 57: Asia Pacific Global UV Spectroscopy Market Revenue Share (%), by Instrument 2024 & 2032
- Figure 58: Asia Pacific Global UV Spectroscopy Market Volume Share (%), by Instrument 2024 & 2032
- Figure 59: Asia Pacific Global UV Spectroscopy Market Revenue (Million), by Application 2024 & 2032
- Figure 60: Asia Pacific Global UV Spectroscopy Market Volume (K Unit), by Application 2024 & 2032
- Figure 61: Asia Pacific Global UV Spectroscopy Market Revenue Share (%), by Application 2024 & 2032
- Figure 62: Asia Pacific Global UV Spectroscopy Market Volume Share (%), by Application 2024 & 2032
- Figure 63: Asia Pacific Global UV Spectroscopy Market Revenue (Million), by End Users 2024 & 2032
- Figure 64: Asia Pacific Global UV Spectroscopy Market Volume (K Unit), by End Users 2024 & 2032
- Figure 65: Asia Pacific Global UV Spectroscopy Market Revenue Share (%), by End Users 2024 & 2032
- Figure 66: Asia Pacific Global UV Spectroscopy Market Volume Share (%), by End Users 2024 & 2032
- Figure 67: Asia Pacific Global UV Spectroscopy Market Revenue (Million), by Country 2024 & 2032
- Figure 68: Asia Pacific Global UV Spectroscopy Market Volume (K Unit), by Country 2024 & 2032
- Figure 69: Asia Pacific Global UV Spectroscopy Market Revenue Share (%), by Country 2024 & 2032
- Figure 70: Asia Pacific Global UV Spectroscopy Market Volume Share (%), by Country 2024 & 2032
- Figure 71: Middle East and Africa Global UV Spectroscopy Market Revenue (Million), by Instrument 2024 & 2032
- Figure 72: Middle East and Africa Global UV Spectroscopy Market Volume (K Unit), by Instrument 2024 & 2032
- Figure 73: Middle East and Africa Global UV Spectroscopy Market Revenue Share (%), by Instrument 2024 & 2032
- Figure 74: Middle East and Africa Global UV Spectroscopy Market Volume Share (%), by Instrument 2024 & 2032
- Figure 75: Middle East and Africa Global UV Spectroscopy Market Revenue (Million), by Application 2024 & 2032
- Figure 76: Middle East and Africa Global UV Spectroscopy Market Volume (K Unit), by Application 2024 & 2032
- Figure 77: Middle East and Africa Global UV Spectroscopy Market Revenue Share (%), by Application 2024 & 2032
- Figure 78: Middle East and Africa Global UV Spectroscopy Market Volume Share (%), by Application 2024 & 2032
- Figure 79: Middle East and Africa Global UV Spectroscopy Market Revenue (Million), by End Users 2024 & 2032
- Figure 80: Middle East and Africa Global UV Spectroscopy Market Volume (K Unit), by End Users 2024 & 2032
- Figure 81: Middle East and Africa Global UV Spectroscopy Market Revenue Share (%), by End Users 2024 & 2032
- Figure 82: Middle East and Africa Global UV Spectroscopy Market Volume Share (%), by End Users 2024 & 2032
- Figure 83: Middle East and Africa Global UV Spectroscopy Market Revenue (Million), by Country 2024 & 2032
- Figure 84: Middle East and Africa Global UV Spectroscopy Market Volume (K Unit), by Country 2024 & 2032
- Figure 85: Middle East and Africa Global UV Spectroscopy Market Revenue Share (%), by Country 2024 & 2032
- Figure 86: Middle East and Africa Global UV Spectroscopy Market Volume Share (%), by Country 2024 & 2032
- Figure 87: South America Global UV Spectroscopy Market Revenue (Million), by Instrument 2024 & 2032
- Figure 88: South America Global UV Spectroscopy Market Volume (K Unit), by Instrument 2024 & 2032
- Figure 89: South America Global UV Spectroscopy Market Revenue Share (%), by Instrument 2024 & 2032
- Figure 90: South America Global UV Spectroscopy Market Volume Share (%), by Instrument 2024 & 2032
- Figure 91: South America Global UV Spectroscopy Market Revenue (Million), by Application 2024 & 2032
- Figure 92: South America Global UV Spectroscopy Market Volume (K Unit), by Application 2024 & 2032
- Figure 93: South America Global UV Spectroscopy Market Revenue Share (%), by Application 2024 & 2032
- Figure 94: South America Global UV Spectroscopy Market Volume Share (%), by Application 2024 & 2032
- Figure 95: South America Global UV Spectroscopy Market Revenue (Million), by End Users 2024 & 2032
- Figure 96: South America Global UV Spectroscopy Market Volume (K Unit), by End Users 2024 & 2032
- Figure 97: South America Global UV Spectroscopy Market Revenue Share (%), by End Users 2024 & 2032
- Figure 98: South America Global UV Spectroscopy Market Volume Share (%), by End Users 2024 & 2032
- Figure 99: South America Global UV Spectroscopy Market Revenue (Million), by Country 2024 & 2032
- Figure 100: South America Global UV Spectroscopy Market Volume (K Unit), by Country 2024 & 2032
- Figure 101: South America Global UV Spectroscopy Market Revenue Share (%), by Country 2024 & 2032
- Figure 102: South America Global UV Spectroscopy Market Volume Share (%), by Country 2024 & 2032
List of Tables
- Table 1: Global UV Spectroscopy Market Revenue Million Forecast, by Region 2019 & 2032
- Table 2: Global UV Spectroscopy Market Volume K Unit Forecast, by Region 2019 & 2032
- Table 3: Global UV Spectroscopy Market Revenue Million Forecast, by Instrument 2019 & 2032
- Table 4: Global UV Spectroscopy Market Volume K Unit Forecast, by Instrument 2019 & 2032
- Table 5: Global UV Spectroscopy Market Revenue Million Forecast, by Application 2019 & 2032
- Table 6: Global UV Spectroscopy Market Volume K Unit Forecast, by Application 2019 & 2032
- Table 7: Global UV Spectroscopy Market Revenue Million Forecast, by End Users 2019 & 2032
- Table 8: Global UV Spectroscopy Market Volume K Unit Forecast, by End Users 2019 & 2032
- Table 9: Global UV Spectroscopy Market Revenue Million Forecast, by Region 2019 & 2032
- Table 10: Global UV Spectroscopy Market Volume K Unit Forecast, by Region 2019 & 2032
- Table 11: Global UV Spectroscopy Market Revenue Million Forecast, by Country 2019 & 2032
- Table 12: Global UV Spectroscopy Market Volume K Unit Forecast, by Country 2019 & 2032
- Table 13: United States Global UV Spectroscopy Market Revenue (Million) Forecast, by Application 2019 & 2032
- Table 14: United States Global UV Spectroscopy Market Volume (K Unit) Forecast, by Application 2019 & 2032
- Table 15: Canada Global UV Spectroscopy Market Revenue (Million) Forecast, by Application 2019 & 2032
- Table 16: Canada Global UV Spectroscopy Market Volume (K Unit) Forecast, by Application 2019 & 2032
- Table 17: Mexico Global UV Spectroscopy Market Revenue (Million) Forecast, by Application 2019 & 2032
- Table 18: Mexico Global UV Spectroscopy Market Volume (K Unit) Forecast, by Application 2019 & 2032
- Table 19: Global UV Spectroscopy Market Revenue Million Forecast, by Country 2019 & 2032
- Table 20: Global UV Spectroscopy Market Volume K Unit Forecast, by Country 2019 & 2032
- Table 21: Germany Global UV Spectroscopy Market Revenue (Million) Forecast, by Application 2019 & 2032
- Table 22: Germany Global UV Spectroscopy Market Volume (K Unit) Forecast, by Application 2019 & 2032
- Table 23: United Kingdom Global UV Spectroscopy Market Revenue (Million) Forecast, by Application 2019 & 2032
- Table 24: United Kingdom Global UV Spectroscopy Market Volume (K Unit) Forecast, by Application 2019 & 2032
- Table 25: France Global UV Spectroscopy Market Revenue (Million) Forecast, by Application 2019 & 2032
- Table 26: France Global UV Spectroscopy Market Volume (K Unit) Forecast, by Application 2019 & 2032
- Table 27: Italy Global UV Spectroscopy Market Revenue (Million) Forecast, by Application 2019 & 2032
- Table 28: Italy Global UV Spectroscopy Market Volume (K Unit) Forecast, by Application 2019 & 2032
- Table 29: Spain Global UV Spectroscopy Market Revenue (Million) Forecast, by Application 2019 & 2032
- Table 30: Spain Global UV Spectroscopy Market Volume (K Unit) Forecast, by Application 2019 & 2032
- Table 31: Rest of Europe Global UV Spectroscopy Market Revenue (Million) Forecast, by Application 2019 & 2032
- Table 32: Rest of Europe Global UV Spectroscopy Market Volume (K Unit) Forecast, by Application 2019 & 2032
- Table 33: Global UV Spectroscopy Market Revenue Million Forecast, by Country 2019 & 2032
- Table 34: Global UV Spectroscopy Market Volume K Unit Forecast, by Country 2019 & 2032
- Table 35: China Global UV Spectroscopy Market Revenue (Million) Forecast, by Application 2019 & 2032
- Table 36: China Global UV Spectroscopy Market Volume (K Unit) Forecast, by Application 2019 & 2032
- Table 37: Japan Global UV Spectroscopy Market Revenue (Million) Forecast, by Application 2019 & 2032
- Table 38: Japan Global UV Spectroscopy Market Volume (K Unit) Forecast, by Application 2019 & 2032
- Table 39: India Global UV Spectroscopy Market Revenue (Million) Forecast, by Application 2019 & 2032
- Table 40: India Global UV Spectroscopy Market Volume (K Unit) Forecast, by Application 2019 & 2032
- Table 41: Australia Global UV Spectroscopy Market Revenue (Million) Forecast, by Application 2019 & 2032
- Table 42: Australia Global UV Spectroscopy Market Volume (K Unit) Forecast, by Application 2019 & 2032
- Table 43: South Korea Global UV Spectroscopy Market Revenue (Million) Forecast, by Application 2019 & 2032
- Table 44: South Korea Global UV Spectroscopy Market Volume (K Unit) Forecast, by Application 2019 & 2032
- Table 45: Rest of Asia Pacific Global UV Spectroscopy Market Revenue (Million) Forecast, by Application 2019 & 2032
- Table 46: Rest of Asia Pacific Global UV Spectroscopy Market Volume (K Unit) Forecast, by Application 2019 & 2032
- Table 47: Global UV Spectroscopy Market Revenue Million Forecast, by Country 2019 & 2032
- Table 48: Global UV Spectroscopy Market Volume K Unit Forecast, by Country 2019 & 2032
- Table 49: GCC Global UV Spectroscopy Market Revenue (Million) Forecast, by Application 2019 & 2032
- Table 50: GCC Global UV Spectroscopy Market Volume (K Unit) Forecast, by Application 2019 & 2032
- Table 51: South Africa Global UV Spectroscopy Market Revenue (Million) Forecast, by Application 2019 & 2032
- Table 52: South Africa Global UV Spectroscopy Market Volume (K Unit) Forecast, by Application 2019 & 2032
- Table 53: Rest of Middle East and Africa Global UV Spectroscopy Market Revenue (Million) Forecast, by Application 2019 & 2032
- Table 54: Rest of Middle East and Africa Global UV Spectroscopy Market Volume (K Unit) Forecast, by Application 2019 & 2032
- Table 55: Global UV Spectroscopy Market Revenue Million Forecast, by Country 2019 & 2032
- Table 56: Global UV Spectroscopy Market Volume K Unit Forecast, by Country 2019 & 2032
- Table 57: Brazil Global UV Spectroscopy Market Revenue (Million) Forecast, by Application 2019 & 2032
- Table 58: Brazil Global UV Spectroscopy Market Volume (K Unit) Forecast, by Application 2019 & 2032
- Table 59: Argentina Global UV Spectroscopy Market Revenue (Million) Forecast, by Application 2019 & 2032
- Table 60: Argentina Global UV Spectroscopy Market Volume (K Unit) Forecast, by Application 2019 & 2032
- Table 61: Rest of South America Global UV Spectroscopy Market Revenue (Million) Forecast, by Application 2019 & 2032
- Table 62: Rest of South America Global UV Spectroscopy Market Volume (K Unit) Forecast, by Application 2019 & 2032
- Table 63: Global UV Spectroscopy Market Revenue Million Forecast, by Instrument 2019 & 2032
- Table 64: Global UV Spectroscopy Market Volume K Unit Forecast, by Instrument 2019 & 2032
- Table 65: Global UV Spectroscopy Market Revenue Million Forecast, by Application 2019 & 2032
- Table 66: Global UV Spectroscopy Market Volume K Unit Forecast, by Application 2019 & 2032
- Table 67: Global UV Spectroscopy Market Revenue Million Forecast, by End Users 2019 & 2032
- Table 68: Global UV Spectroscopy Market Volume K Unit Forecast, by End Users 2019 & 2032
- Table 69: Global UV Spectroscopy Market Revenue Million Forecast, by Country 2019 & 2032
- Table 70: Global UV Spectroscopy Market Volume K Unit Forecast, by Country 2019 & 2032
- Table 71: United States Global UV Spectroscopy Market Revenue (Million) Forecast, by Application 2019 & 2032
- Table 72: United States Global UV Spectroscopy Market Volume (K Unit) Forecast, by Application 2019 & 2032
- Table 73: Canada Global UV Spectroscopy Market Revenue (Million) Forecast, by Application 2019 & 2032
- Table 74: Canada Global UV Spectroscopy Market Volume (K Unit) Forecast, by Application 2019 & 2032
- Table 75: Mexico Global UV Spectroscopy Market Revenue (Million) Forecast, by Application 2019 & 2032
- Table 76: Mexico Global UV Spectroscopy Market Volume (K Unit) Forecast, by Application 2019 & 2032
- Table 77: Global UV Spectroscopy Market Revenue Million Forecast, by Instrument 2019 & 2032
- Table 78: Global UV Spectroscopy Market Volume K Unit Forecast, by Instrument 2019 & 2032
- Table 79: Global UV Spectroscopy Market Revenue Million Forecast, by Application 2019 & 2032
- Table 80: Global UV Spectroscopy Market Volume K Unit Forecast, by Application 2019 & 2032
- Table 81: Global UV Spectroscopy Market Revenue Million Forecast, by End Users 2019 & 2032
- Table 82: Global UV Spectroscopy Market Volume K Unit Forecast, by End Users 2019 & 2032
- Table 83: Global UV Spectroscopy Market Revenue Million Forecast, by Country 2019 & 2032
- Table 84: Global UV Spectroscopy Market Volume K Unit Forecast, by Country 2019 & 2032
- Table 85: Germany Global UV Spectroscopy Market Revenue (Million) Forecast, by Application 2019 & 2032
- Table 86: Germany Global UV Spectroscopy Market Volume (K Unit) Forecast, by Application 2019 & 2032
- Table 87: United Kingdom Global UV Spectroscopy Market Revenue (Million) Forecast, by Application 2019 & 2032
- Table 88: United Kingdom Global UV Spectroscopy Market Volume (K Unit) Forecast, by Application 2019 & 2032
- Table 89: France Global UV Spectroscopy Market Revenue (Million) Forecast, by Application 2019 & 2032
- Table 90: France Global UV Spectroscopy Market Volume (K Unit) Forecast, by Application 2019 & 2032
- Table 91: Italy Global UV Spectroscopy Market Revenue (Million) Forecast, by Application 2019 & 2032
- Table 92: Italy Global UV Spectroscopy Market Volume (K Unit) Forecast, by Application 2019 & 2032
- Table 93: Spain Global UV Spectroscopy Market Revenue (Million) Forecast, by Application 2019 & 2032
- Table 94: Spain Global UV Spectroscopy Market Volume (K Unit) Forecast, by Application 2019 & 2032
- Table 95: Rest of Europe Global UV Spectroscopy Market Revenue (Million) Forecast, by Application 2019 & 2032
- Table 96: Rest of Europe Global UV Spectroscopy Market Volume (K Unit) Forecast, by Application 2019 & 2032
- Table 97: Global UV Spectroscopy Market Revenue Million Forecast, by Instrument 2019 & 2032
- Table 98: Global UV Spectroscopy Market Volume K Unit Forecast, by Instrument 2019 & 2032
- Table 99: Global UV Spectroscopy Market Revenue Million Forecast, by Application 2019 & 2032
- Table 100: Global UV Spectroscopy Market Volume K Unit Forecast, by Application 2019 & 2032
- Table 101: Global UV Spectroscopy Market Revenue Million Forecast, by End Users 2019 & 2032
- Table 102: Global UV Spectroscopy Market Volume K Unit Forecast, by End Users 2019 & 2032
- Table 103: Global UV Spectroscopy Market Revenue Million Forecast, by Country 2019 & 2032
- Table 104: Global UV Spectroscopy Market Volume K Unit Forecast, by Country 2019 & 2032
- Table 105: China Global UV Spectroscopy Market Revenue (Million) Forecast, by Application 2019 & 2032
- Table 106: China Global UV Spectroscopy Market Volume (K Unit) Forecast, by Application 2019 & 2032
- Table 107: Japan Global UV Spectroscopy Market Revenue (Million) Forecast, by Application 2019 & 2032
- Table 108: Japan Global UV Spectroscopy Market Volume (K Unit) Forecast, by Application 2019 & 2032
- Table 109: India Global UV Spectroscopy Market Revenue (Million) Forecast, by Application 2019 & 2032
- Table 110: India Global UV Spectroscopy Market Volume (K Unit) Forecast, by Application 2019 & 2032
- Table 111: Australia Global UV Spectroscopy Market Revenue (Million) Forecast, by Application 2019 & 2032
- Table 112: Australia Global UV Spectroscopy Market Volume (K Unit) Forecast, by Application 2019 & 2032
- Table 113: South Korea Global UV Spectroscopy Market Revenue (Million) Forecast, by Application 2019 & 2032
- Table 114: South Korea Global UV Spectroscopy Market Volume (K Unit) Forecast, by Application 2019 & 2032
- Table 115: Rest of Asia Pacific Global UV Spectroscopy Market Revenue (Million) Forecast, by Application 2019 & 2032
- Table 116: Rest of Asia Pacific Global UV Spectroscopy Market Volume (K Unit) Forecast, by Application 2019 & 2032
- Table 117: Global UV Spectroscopy Market Revenue Million Forecast, by Instrument 2019 & 2032
- Table 118: Global UV Spectroscopy Market Volume K Unit Forecast, by Instrument 2019 & 2032
- Table 119: Global UV Spectroscopy Market Revenue Million Forecast, by Application 2019 & 2032
- Table 120: Global UV Spectroscopy Market Volume K Unit Forecast, by Application 2019 & 2032
- Table 121: Global UV Spectroscopy Market Revenue Million Forecast, by End Users 2019 & 2032
- Table 122: Global UV Spectroscopy Market Volume K Unit Forecast, by End Users 2019 & 2032
- Table 123: Global UV Spectroscopy Market Revenue Million Forecast, by Country 2019 & 2032
- Table 124: Global UV Spectroscopy Market Volume K Unit Forecast, by Country 2019 & 2032
- Table 125: GCC Global UV Spectroscopy Market Revenue (Million) Forecast, by Application 2019 & 2032
- Table 126: GCC Global UV Spectroscopy Market Volume (K Unit) Forecast, by Application 2019 & 2032
- Table 127: South Africa Global UV Spectroscopy Market Revenue (Million) Forecast, by Application 2019 & 2032
- Table 128: South Africa Global UV Spectroscopy Market Volume (K Unit) Forecast, by Application 2019 & 2032
- Table 129: Rest of Middle East and Africa Global UV Spectroscopy Market Revenue (Million) Forecast, by Application 2019 & 2032
- Table 130: Rest of Middle East and Africa Global UV Spectroscopy Market Volume (K Unit) Forecast, by Application 2019 & 2032
- Table 131: Global UV Spectroscopy Market Revenue Million Forecast, by Instrument 2019 & 2032
- Table 132: Global UV Spectroscopy Market Volume K Unit Forecast, by Instrument 2019 & 2032
- Table 133: Global UV Spectroscopy Market Revenue Million Forecast, by Application 2019 & 2032
- Table 134: Global UV Spectroscopy Market Volume K Unit Forecast, by Application 2019 & 2032
- Table 135: Global UV Spectroscopy Market Revenue Million Forecast, by End Users 2019 & 2032
- Table 136: Global UV Spectroscopy Market Volume K Unit Forecast, by End Users 2019 & 2032
- Table 137: Global UV Spectroscopy Market Revenue Million Forecast, by Country 2019 & 2032
- Table 138: Global UV Spectroscopy Market Volume K Unit Forecast, by Country 2019 & 2032
- Table 139: Brazil Global UV Spectroscopy Market Revenue (Million) Forecast, by Application 2019 & 2032
- Table 140: Brazil Global UV Spectroscopy Market Volume (K Unit) Forecast, by Application 2019 & 2032
- Table 141: Argentina Global UV Spectroscopy Market Revenue (Million) Forecast, by Application 2019 & 2032
- Table 142: Argentina Global UV Spectroscopy Market Volume (K Unit) Forecast, by Application 2019 & 2032
- Table 143: Rest of South America Global UV Spectroscopy Market Revenue (Million) Forecast, by Application 2019 & 2032
- Table 144: Rest of South America Global UV Spectroscopy Market Volume (K Unit) Forecast, by Application 2019 & 2032
Frequently Asked Questions
1. What is the projected Compound Annual Growth Rate (CAGR) of the Global UV Spectroscopy Market?
The projected CAGR is approximately 5.00%.
2. Which companies are prominent players in the Global UV Spectroscopy Market?
Key companies in the market include GBC Scientific equipment, Eppendorf, Buck scientific Instrusment manufacturing company, Perkin Elmier Inc, Cecil Instrumentation services Ltd, Utech Labs, Danher, ThermoFisher Scientific, Biochrom Ltd, Cole- Parmer instrument company LLC, Shimadzu Corporation, Analaytik Jena GmbH.
3. What are the main segments of the Global UV Spectroscopy Market?
The market segments include Instrument, Application, End Users.
4. Can you provide details about the market size?
The market size is estimated to be USD XX Million as of 2022.
5. What are some drivers contributing to market growth?
Rising application of Ultraviolet-spectroscophy in pharamecutical and biotechnology industries.; Technological advancements.
6. What are the notable trends driving market growth?
The Pharmaceutical and Biotechnology industry Segment is Expected to Hold a Major Market Share in the UV spectroscopy Market.
7. Are there any restraints impacting market growth?
Lack of experienced professional; Longevity of Instruments.
8. Can you provide examples of recent developments in the market?
In January 2022, CRAIC technologies introduced the 2030 PV PRO UV-visible- NIR microspectrophotometer. The latest microspectrophotometer is designed to non-destructively analyze many types of microscopic samples from the deep ultraviolet to near-infrared.
9. What pricing options are available for accessing the report?
Pricing options include single-user, multi-user, and enterprise licenses priced at USD 4750, USD 5250, and USD 8750 respectively.
10. Is the market size provided in terms of value or volume?
The market size is provided in terms of value, measured in Million and volume, measured in K Unit.
11. Are there any specific market keywords associated with the report?
Yes, the market keyword associated with the report is "Global UV Spectroscopy Market," which aids in identifying and referencing the specific market segment covered.
12. How do I determine which pricing option suits my needs best?
The pricing options vary based on user requirements and access needs. Individual users may opt for single-user licenses, while businesses requiring broader access may choose multi-user or enterprise licenses for cost-effective access to the report.
13. Are there any additional resources or data provided in the Global UV Spectroscopy Market report?
While the report offers comprehensive insights, it's advisable to review the specific contents or supplementary materials provided to ascertain if additional resources or data are available.
14. How can I stay updated on further developments or reports in the Global UV Spectroscopy Market?
To stay informed about further developments, trends, and reports in the Global UV Spectroscopy Market, consider subscribing to industry newsletters, following relevant companies and organizations, or regularly checking reputable industry news sources and publications.
Methodology
Step 1 - Identification of Relevant Samples Size from Population Database


Step 2 - Approaches for Defining Global Market Size (Value, Volume* & Price*)

Note*: In applicable scenarios
Step 3 - Data Sources
Primary Research
- Web Analytics
- Survey Reports
- Research Institute
- Latest Research Reports
- Opinion Leaders
Secondary Research
- Annual Reports
- White Paper
- Latest Press Release
- Industry Association
- Paid Database
- Investor Presentations

Step 4 - Data Triangulation
Involves using different sources of information in order to increase the validity of a study
These sources are likely to be stakeholders in a program - participants, other researchers, program staff, other community members, and so on.
Then we put all data in single framework & apply various statistical tools to find out the dynamic on the market.
During the analysis stage, feedback from the stakeholder groups would be compared to determine areas of agreement as well as areas of divergence


