Key Insights
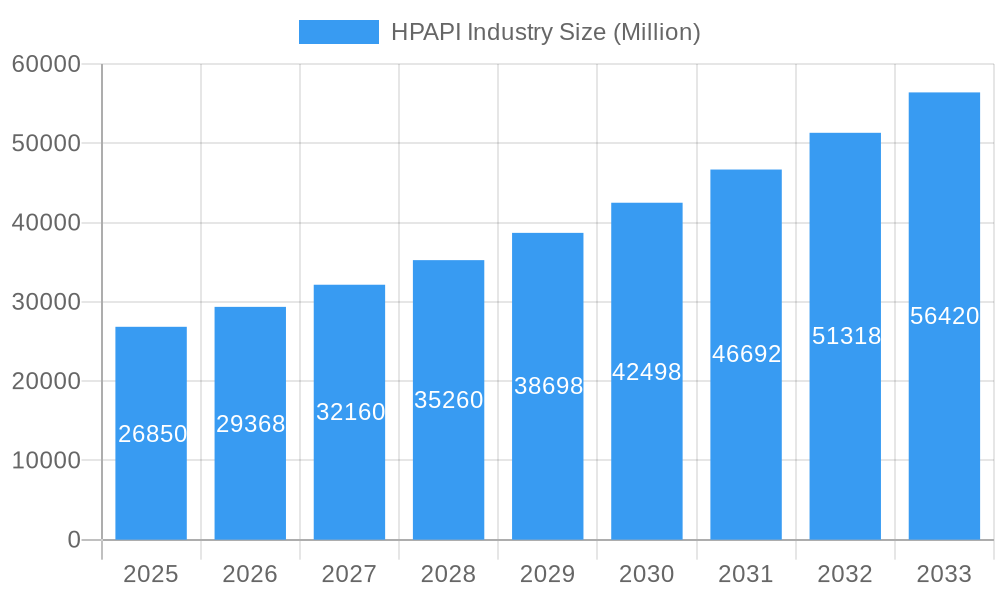
The High-Potency Active Pharmaceutical Ingredients (HPAPI) market is experiencing robust growth, projected to reach \$26.85 billion in 2025 and maintain a Compound Annual Growth Rate (CAGR) of 9.27% from 2025 to 2033. This expansion is driven by several key factors. The increasing prevalence of chronic diseases like cancer and hormonal imbalances fuels demand for innovative HPAPIs in oncology and related therapeutic areas. Furthermore, advancements in drug delivery systems and the rising adoption of personalized medicine are creating new opportunities for the development and utilization of HPAPIs. The market is segmented by manufacturer type (captive and merchant), product type (innovative and generic), application (oncology, hormonal imbalance, glaucoma, and others), and synthesis method (synthetic and biotech). The robust pipeline of novel HPAPI-based drugs across various therapeutic areas further strengthens the market outlook. North America and Europe currently dominate the market, driven by established pharmaceutical industries and strong regulatory frameworks. However, Asia Pacific is anticipated to witness significant growth in the coming years, fueled by rising healthcare expenditure and increasing generic drug manufacturing capabilities in regions like India and China.
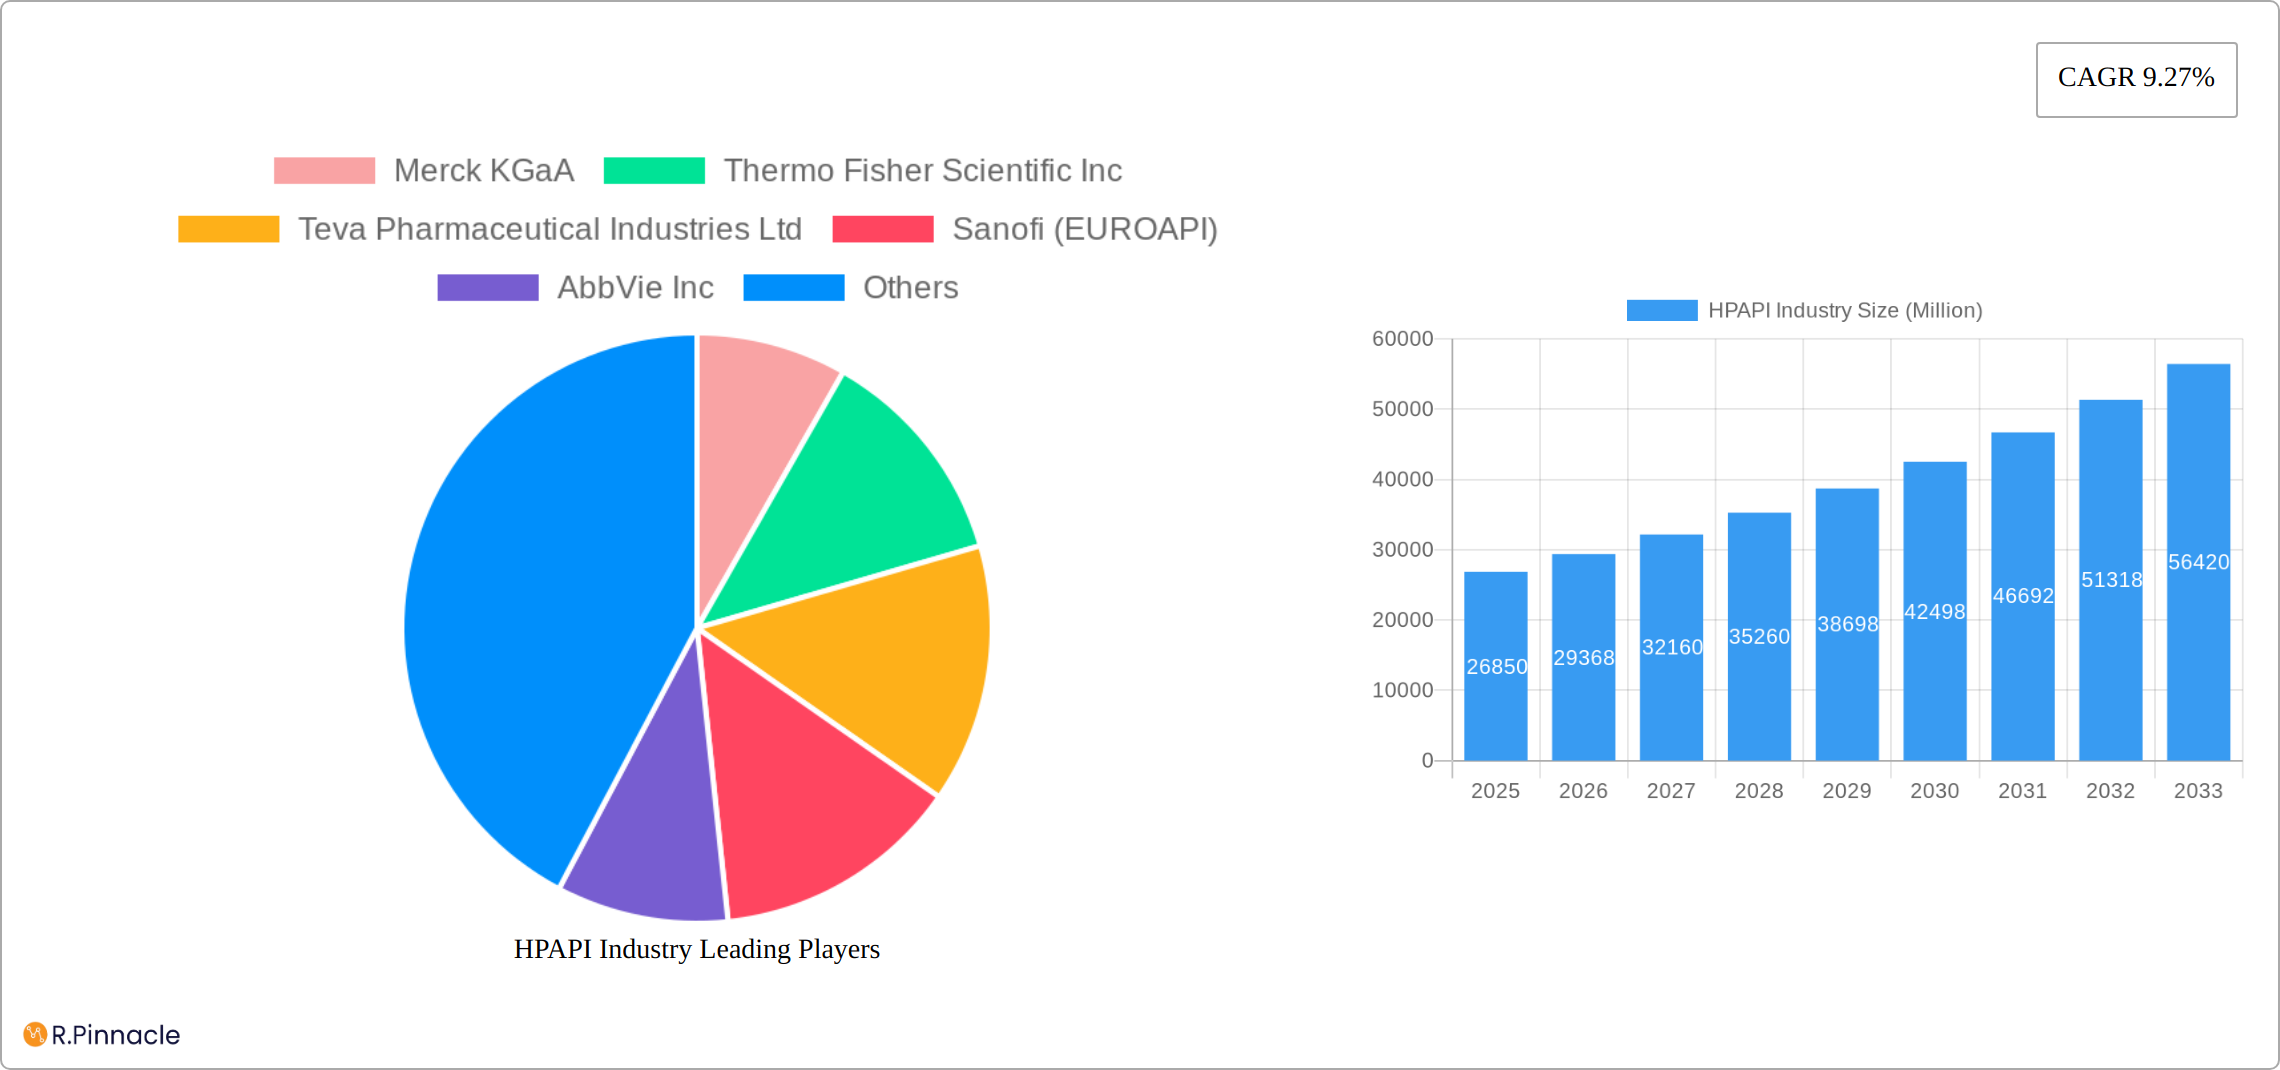
HPAPI Industry Market Size (In Billion)
The competitive landscape is characterized by a mix of large multinational pharmaceutical companies such as Merck KGaA, Thermo Fisher Scientific, and Pfizer, alongside specialized contract manufacturers like Corden Pharma International. These companies are actively engaged in strategic collaborations, acquisitions, and capacity expansions to meet the growing demand for HPAPIs. Regulatory hurdles associated with handling highly potent compounds and the need for stringent safety protocols present some challenges. However, ongoing technological advancements in synthesis and handling techniques are mitigating these restraints and paving the way for further market growth. The shift towards outsourcing HPAPI manufacturing by pharmaceutical companies is also creating significant opportunities for contract research organizations (CROs) and CDMOs (Contract Development and Manufacturing Organizations). The market's future growth trajectory hinges on continuous innovation in drug development, regulatory approvals for novel HPAPIs, and the strategic investments made by key players in enhancing manufacturing capabilities and tackling the complexities of handling these potent compounds.
HPAPI Industry Company Market Share
High-Potency Active Pharmaceutical Ingredients (HPAPI) Industry Report: 2019-2033
This comprehensive report provides a detailed analysis of the High-Potency Active Pharmaceutical Ingredients (HPAPI) industry, covering market size, growth drivers, key players, and future trends from 2019 to 2033. The study period spans from 2019-2024 (historical period), with 2025 serving as the base and estimated year. The report projects market trends from 2025 to 2033 (forecast period). This in-depth analysis will equip industry professionals with actionable insights to navigate the dynamic HPAPI landscape. The market is expected to reach xx Million by 2033.
HPAPI Industry Market Structure & Innovation Trends
The HPAPI market exhibits a moderately concentrated structure, dominated by key players such as Merck KGaA, Thermo Fisher Scientific Inc, Teva Pharmaceutical Industries Ltd, Sanofi (EUROAPI), AbbVie Inc, Corden Pharma International, Viatris Inc, Sun Pharmaceutical Industries Ltd, SK Biotek, and Pfizer Inc. While precise 2025 market share figures are proprietary, Merck KGaA historically holds a leading position, followed by Thermo Fisher Scientific Inc and Teva Pharmaceutical Industries Ltd. This landscape is, however, dynamic and highly competitive. The period from 2019-2024 witnessed significant M&A activity, with a total deal value of approximately [Insert Actual Value] Million USD, reflecting strategic acquisitions aimed at expanding manufacturing capabilities and diversifying product portfolios. This consolidation trend is anticipated to continue.
- Innovation Drivers: The burgeoning demand for advanced cancer therapies and other high-potency drugs fuels significant innovation. Advancements in synthetic chemistry, process chemistry, and biotechnology are continuously generating new HPAPI molecules and more efficient, scalable manufacturing processes. This includes exploring continuous manufacturing and other process intensification techniques to improve yields and reduce waste.
- Regulatory Frameworks: Stringent regulatory requirements governing HPAPI manufacturing and handling pose challenges while simultaneously driving investment in cutting-edge safety technologies and quality control systems. Compliance with Good Manufacturing Practices (GMP) and other regulatory standards is paramount, impacting market access and influencing operational strategies.
- Product Substitutes: Although direct substitutes for HPAPIs are limited due to their unique properties and therapeutic targets, the emergence of alternative treatment modalities and biosimilars could influence market demand in specific therapeutic areas.
- End-User Demographics: The global market is significantly impacted by the aging population and the increasing prevalence of chronic diseases requiring HPAPI-based treatments, notably in oncology and other specialized therapeutic areas. Growth in emerging markets is also a significant contributing factor.
- M&A Activity: Further consolidation is expected, with larger pharmaceutical companies strategically acquiring smaller, specialized HPAPI manufacturers to gain access to novel technologies, bolster their product pipelines, and secure a competitive edge within the market.
HPAPI Industry Market Dynamics & Trends
The HPAPI market is experiencing robust growth, driven by the increasing demand for novel therapies across oncology, hormonal imbalance treatments, and glaucoma management. The projected Compound Annual Growth Rate (CAGR) for the forecast period (2025-2033) is estimated to be [Insert Actual CAGR]% . This growth is fueled by several key factors: technological advancements enhancing synthetic and biotechnological HPAPI production, substantial R&D investments focused on process optimization and new molecular entities, and growing awareness among healthcare professionals and patients regarding the benefits of HPAPI-based treatments. Market penetration is expected to reach [Insert Actual Percentage]% by 2033, largely due to the continuous approval of new HPAPI-based drugs. The competitive landscape remains highly dynamic, with leading companies prioritizing innovation, capacity expansion, strategic partnerships, and efficient pricing strategies to maintain a competitive advantage. The adoption of advanced manufacturing technologies will further shape market dynamics.
Dominant Regions & Segments in HPAPI Industry
North America currently holds the largest market share in the HPAPI industry, driven by substantial R&D investments, a robust and well-established regulatory framework, and a sizable patient population. Europe closely follows, while the Asia-Pacific region is experiencing rapid growth due to increasing healthcare expenditure, a rising prevalence of chronic diseases, and a growing number of contract manufacturing organizations (CMOs).
- Dominant Manufacturer Segments: Both captive and merchant HPAPI manufacturers play significant roles, with captive manufacturers potentially holding a larger share due to the substantial in-house needs of large pharmaceutical companies. The increasing outsourcing trend may shift this balance in the future.
- Dominant Product Type: Innovative High-Potency Active Pharmaceutical Ingredients (HPAPIs) constitute the larger market segment due to their higher price points and the growing demand for novel therapies. Generic HPAPIs represent a significant but potentially slower-growing segment.
- Dominant Application: The Oncology segment currently dominates due to the high demand for effective cancer treatments and a robust pipeline of new HPAPI-based therapies.
- Dominant Synthesis: Synthetic High-potency Active Pharmaceutical Ingredients (HPAPIs) currently hold a larger market share due to their versatility and scalability for large-scale production. Biotechnological approaches are showing strong potential for niche applications and are expected to see increasing adoption.
Key Drivers for Dominant Regions/Segments:
- North America: Robust regulatory framework, high R&D spending, well-established healthcare infrastructure, and a strong intellectual property protection system.
- Europe: Significant investments in pharmaceutical innovation and manufacturing, presence of strong regulatory agencies, and a skilled workforce.
- Asia-Pacific: Growing healthcare expenditure, rising prevalence of chronic diseases, increasing number of contract manufacturing organizations (CMOs), and a cost-competitive manufacturing landscape.
- Oncology Applications: Increasing prevalence of cancer globally and a strong pipeline of new HPAPI-based cancer therapies targeting unmet medical needs.
HPAPI Industry Product Innovations
Recent product developments focus on improving the safety, efficacy, and manufacturing processes of HPAPIs. This includes the introduction of novel synthetic routes, the application of continuous manufacturing technologies, and the development of safer handling methods to address the inherent risks associated with HPAPI manufacturing. The emphasis is on developing more potent and efficient drugs, alongside safer and more cost-effective manufacturing processes. Market fit is driven by unmet medical needs and improving the efficiency of existing drugs, often for chronic diseases and cancers.
Report Scope & Segmentation Analysis
This report offers a comprehensive analysis of the HPAPI industry, segmented by manufacturer (Captive and Merchant), product type (Innovative and Generic HPAPIs), application (Oncology, Hormonal Imbalance, Glaucoma, Other), and synthesis (Synthetic and Biotech). Detailed growth projections for each segment are provided up to 2033, encompassing market size estimations and competitive landscape assessments. Specific insights are offered into the projected robust growth of the Oncology application segment and the anticipated faster growth of the Biotech synthesis segment, driven by its inherent potential for increased efficiency and the development of novel production methods. The report also analyzes emerging trends such as continuous manufacturing and process intensification.
Key Drivers of HPAPI Industry Growth
Several factors fuel the HPAPI industry's expansion. Firstly, technological advances in synthesis and purification methods enable the development of more potent and targeted drugs. Secondly, the increasing prevalence of chronic diseases like cancer, creating high demand for innovative HPAPI-based therapies. Finally, supportive regulatory frameworks encourage investment in research and development, driving the creation of new and improved HPAPIs.
Challenges in the HPAPI Industry Sector
The HPAPI industry faces several challenges. Stringent regulatory requirements for HPAPI manufacturing and handling increase development and production costs. Supply chain complexities in procuring specialized raw materials and equipment can lead to production delays and cost escalation. Intense competition amongst established players and emerging companies necessitates continuous innovation and process optimization to maintain a competitive edge. The estimated cost of regulatory compliance adds approximately xx Million annually to the overall industry expenses.
Emerging Opportunities in HPAPI Industry
Emerging opportunities lie in the development of novel drug delivery systems for HPAPIs, improving patient compliance and reducing side effects. The rise of personalized medicine is creating demand for tailor-made HPAPI-based therapies. The exploration of innovative manufacturing technologies (continuous manufacturing) aims to reduce costs and increase production efficiency. Finally, expansion into emerging markets presents substantial growth potential.
Leading Players in the HPAPI Industry Market
Key Developments in HPAPI Industry
- January 2023: Sai Life Sciences completed a new HPAPI manufacturing facility, boosting its capacity and accelerating NCE development.
- February 2023: Piramal Pharma Solutions opened a new US-based API and HPAPI manufacturing plant, enhancing production capabilities.
Future Outlook for HPAPI Industry Market
The HPAPI market is poised for continued growth, driven by increasing demand for novel therapies, technological advancements, and ongoing investments in R&D. Strategic collaborations, acquisitions, and the adoption of advanced manufacturing technologies will play a pivotal role in shaping the future of the industry. The focus will be on cost optimization, enhanced safety measures, and the development of more targeted and effective HPAPI-based treatments.
HPAPI Industry Segmentation
-
1. Poduct Type
- 1.1. Innovati
- 1.2. Generic
-
2. Application
- 2.1. Oncology
- 2.2. Hormonal Imbalance
- 2.3. Glaucoma
- 2.4. Other Applications
-
3. Synthesis
- 3.1. Syntheti
- 3.2. Biotech
-
4. Manufacturer
- 4.1. Captive HPAPI Manufacturers
- 4.2. Merchant HPAPI Manufacturers
HPAPI Industry Segmentation By Geography
-
1. North America
- 1.1. United States
- 1.2. Canada
- 1.3. Mexico
-
2. Europe
- 2.1. Germany
- 2.2. United Kingdom
- 2.3. France
- 2.4. Italy
- 2.5. Spain
- 2.6. Rest of Europe
-
3. Asia Pacific
- 3.1. China
- 3.2. Japan
- 3.3. India
- 3.4. Australia
- 3.5. South Korea
- 3.6. Rest of Asia Pacific
-
4. Middle East and Africa
- 4.1. GCC
- 4.2. South Africa
- 4.3. Rest of Middle East and Africa
-
5. South America
- 5.1. Brazil
- 5.2. Argentina
- 5.3. Rest of South America
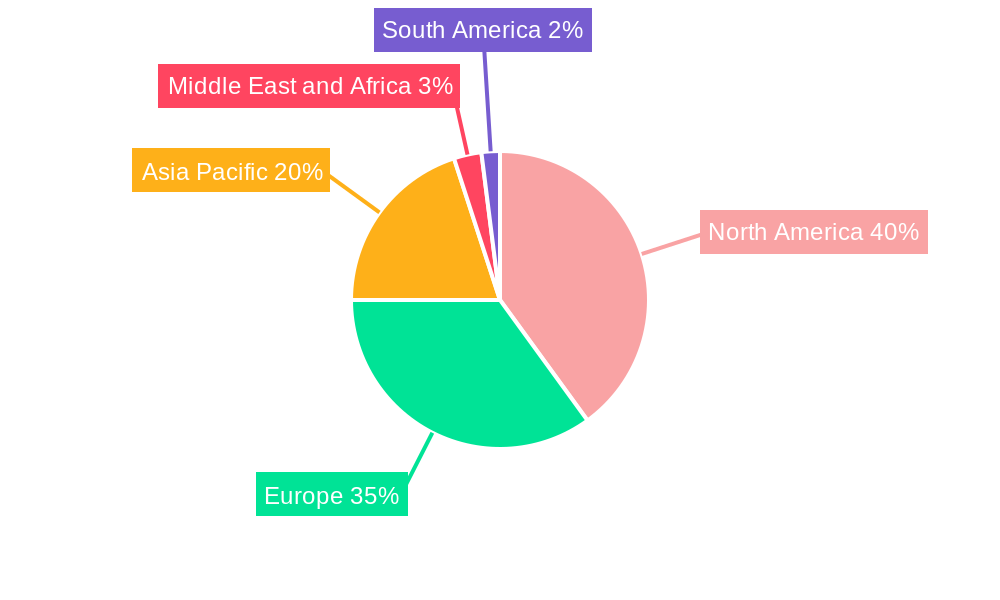
HPAPI Industry Regional Market Share
Geographic Coverage of HPAPI Industry
HPAPI Industry REPORT HIGHLIGHTS
| Aspects | Details |
|---|---|
| Study Period | 2020-2034 |
| Base Year | 2025 |
| Estimated Year | 2026 |
| Forecast Period | 2026-2034 |
| Historical Period | 2020-2025 |
| Growth Rate | CAGR of 9.27% from 2020-2034 |
| Segmentation |
|
Table of Contents
- 1. Introduction
- 1.1. Research Scope
- 1.2. Market Segmentation
- 1.3. Research Methodology
- 1.4. Definitions and Assumptions
- 2. Executive Summary
- 2.1. Introduction
- 3. Market Dynamics
- 3.1. Introduction
- 3.2. Market Drivers
- 3.2.1. Increasing Demand for Pharmaceutical Drugs; Increasing Focus on Precision Medicine and High-potency APIs; Technological Advancements in High-potency API Manufacturing
- 3.3. Market Restrains
- 3.3.1. Huge Capital Investment; Ever Changing Industry Standards and Guidelines
- 3.4. Market Trends
- 3.4.1. Generic High-potency Active Pharmaceutical Ingredients Segment is Expected to Record Significant Growth
- 4. Market Factor Analysis
- 4.1. Porters Five Forces
- 4.2. Supply/Value Chain
- 4.3. PESTEL analysis
- 4.4. Market Entropy
- 4.5. Patent/Trademark Analysis
- 5. Global HPAPI Industry Analysis, Insights and Forecast, 2020-2032
- 5.1. Market Analysis, Insights and Forecast - by Poduct Type
- 5.1.1. Innovati
- 5.1.2. Generic
- 5.2. Market Analysis, Insights and Forecast - by Application
- 5.2.1. Oncology
- 5.2.2. Hormonal Imbalance
- 5.2.3. Glaucoma
- 5.2.4. Other Applications
- 5.3. Market Analysis, Insights and Forecast - by Synthesis
- 5.3.1. Syntheti
- 5.3.2. Biotech
- 5.4. Market Analysis, Insights and Forecast - by Manufacturer
- 5.4.1. Captive HPAPI Manufacturers
- 5.4.2. Merchant HPAPI Manufacturers
- 5.5. Market Analysis, Insights and Forecast - by Region
- 5.5.1. North America
- 5.5.2. Europe
- 5.5.3. Asia Pacific
- 5.5.4. Middle East and Africa
- 5.5.5. South America
- 5.1. Market Analysis, Insights and Forecast - by Poduct Type
- 6. North America HPAPI Industry Analysis, Insights and Forecast, 2020-2032
- 6.1. Market Analysis, Insights and Forecast - by Poduct Type
- 6.1.1. Innovati
- 6.1.2. Generic
- 6.2. Market Analysis, Insights and Forecast - by Application
- 6.2.1. Oncology
- 6.2.2. Hormonal Imbalance
- 6.2.3. Glaucoma
- 6.2.4. Other Applications
- 6.3. Market Analysis, Insights and Forecast - by Synthesis
- 6.3.1. Syntheti
- 6.3.2. Biotech
- 6.4. Market Analysis, Insights and Forecast - by Manufacturer
- 6.4.1. Captive HPAPI Manufacturers
- 6.4.2. Merchant HPAPI Manufacturers
- 6.1. Market Analysis, Insights and Forecast - by Poduct Type
- 7. Europe HPAPI Industry Analysis, Insights and Forecast, 2020-2032
- 7.1. Market Analysis, Insights and Forecast - by Poduct Type
- 7.1.1. Innovati
- 7.1.2. Generic
- 7.2. Market Analysis, Insights and Forecast - by Application
- 7.2.1. Oncology
- 7.2.2. Hormonal Imbalance
- 7.2.3. Glaucoma
- 7.2.4. Other Applications
- 7.3. Market Analysis, Insights and Forecast - by Synthesis
- 7.3.1. Syntheti
- 7.3.2. Biotech
- 7.4. Market Analysis, Insights and Forecast - by Manufacturer
- 7.4.1. Captive HPAPI Manufacturers
- 7.4.2. Merchant HPAPI Manufacturers
- 7.1. Market Analysis, Insights and Forecast - by Poduct Type
- 8. Asia Pacific HPAPI Industry Analysis, Insights and Forecast, 2020-2032
- 8.1. Market Analysis, Insights and Forecast - by Poduct Type
- 8.1.1. Innovati
- 8.1.2. Generic
- 8.2. Market Analysis, Insights and Forecast - by Application
- 8.2.1. Oncology
- 8.2.2. Hormonal Imbalance
- 8.2.3. Glaucoma
- 8.2.4. Other Applications
- 8.3. Market Analysis, Insights and Forecast - by Synthesis
- 8.3.1. Syntheti
- 8.3.2. Biotech
- 8.4. Market Analysis, Insights and Forecast - by Manufacturer
- 8.4.1. Captive HPAPI Manufacturers
- 8.4.2. Merchant HPAPI Manufacturers
- 8.1. Market Analysis, Insights and Forecast - by Poduct Type
- 9. Middle East and Africa HPAPI Industry Analysis, Insights and Forecast, 2020-2032
- 9.1. Market Analysis, Insights and Forecast - by Poduct Type
- 9.1.1. Innovati
- 9.1.2. Generic
- 9.2. Market Analysis, Insights and Forecast - by Application
- 9.2.1. Oncology
- 9.2.2. Hormonal Imbalance
- 9.2.3. Glaucoma
- 9.2.4. Other Applications
- 9.3. Market Analysis, Insights and Forecast - by Synthesis
- 9.3.1. Syntheti
- 9.3.2. Biotech
- 9.4. Market Analysis, Insights and Forecast - by Manufacturer
- 9.4.1. Captive HPAPI Manufacturers
- 9.4.2. Merchant HPAPI Manufacturers
- 9.1. Market Analysis, Insights and Forecast - by Poduct Type
- 10. South America HPAPI Industry Analysis, Insights and Forecast, 2020-2032
- 10.1. Market Analysis, Insights and Forecast - by Poduct Type
- 10.1.1. Innovati
- 10.1.2. Generic
- 10.2. Market Analysis, Insights and Forecast - by Application
- 10.2.1. Oncology
- 10.2.2. Hormonal Imbalance
- 10.2.3. Glaucoma
- 10.2.4. Other Applications
- 10.3. Market Analysis, Insights and Forecast - by Synthesis
- 10.3.1. Syntheti
- 10.3.2. Biotech
- 10.4. Market Analysis, Insights and Forecast - by Manufacturer
- 10.4.1. Captive HPAPI Manufacturers
- 10.4.2. Merchant HPAPI Manufacturers
- 10.1. Market Analysis, Insights and Forecast - by Poduct Type
- 11. Competitive Analysis
- 11.1. Global Market Share Analysis 2025
- 11.2. Company Profiles
- 11.2.1 Merck KGaA
- 11.2.1.1. Overview
- 11.2.1.2. Products
- 11.2.1.3. SWOT Analysis
- 11.2.1.4. Recent Developments
- 11.2.1.5. Financials (Based on Availability)
- 11.2.2 Thermo Fisher Scientific Inc
- 11.2.2.1. Overview
- 11.2.2.2. Products
- 11.2.2.3. SWOT Analysis
- 11.2.2.4. Recent Developments
- 11.2.2.5. Financials (Based on Availability)
- 11.2.3 Teva Pharmaceutical Industries Ltd
- 11.2.3.1. Overview
- 11.2.3.2. Products
- 11.2.3.3. SWOT Analysis
- 11.2.3.4. Recent Developments
- 11.2.3.5. Financials (Based on Availability)
- 11.2.4 Sanofi (EUROAPI)
- 11.2.4.1. Overview
- 11.2.4.2. Products
- 11.2.4.3. SWOT Analysis
- 11.2.4.4. Recent Developments
- 11.2.4.5. Financials (Based on Availability)
- 11.2.5 AbbVie Inc
- 11.2.5.1. Overview
- 11.2.5.2. Products
- 11.2.5.3. SWOT Analysis
- 11.2.5.4. Recent Developments
- 11.2.5.5. Financials (Based on Availability)
- 11.2.6 Corden Pharma International
- 11.2.6.1. Overview
- 11.2.6.2. Products
- 11.2.6.3. SWOT Analysis
- 11.2.6.4. Recent Developments
- 11.2.6.5. Financials (Based on Availability)
- 11.2.7 Viatris Inc
- 11.2.7.1. Overview
- 11.2.7.2. Products
- 11.2.7.3. SWOT Analysis
- 11.2.7.4. Recent Developments
- 11.2.7.5. Financials (Based on Availability)
- 11.2.8 Sun Pharmaceutical Industries Ltd
- 11.2.8.1. Overview
- 11.2.8.2. Products
- 11.2.8.3. SWOT Analysis
- 11.2.8.4. Recent Developments
- 11.2.8.5. Financials (Based on Availability)
- 11.2.9 SK Biotek
- 11.2.9.1. Overview
- 11.2.9.2. Products
- 11.2.9.3. SWOT Analysis
- 11.2.9.4. Recent Developments
- 11.2.9.5. Financials (Based on Availability)
- 11.2.10 Pfizer Inc
- 11.2.10.1. Overview
- 11.2.10.2. Products
- 11.2.10.3. SWOT Analysis
- 11.2.10.4. Recent Developments
- 11.2.10.5. Financials (Based on Availability)
- 11.2.1 Merck KGaA
List of Figures
- Figure 1: Global HPAPI Industry Revenue Breakdown (Million, %) by Region 2025 & 2033
- Figure 2: Global HPAPI Industry Volume Breakdown (K Unit, %) by Region 2025 & 2033
- Figure 3: North America HPAPI Industry Revenue (Million), by Poduct Type 2025 & 2033
- Figure 4: North America HPAPI Industry Volume (K Unit), by Poduct Type 2025 & 2033
- Figure 5: North America HPAPI Industry Revenue Share (%), by Poduct Type 2025 & 2033
- Figure 6: North America HPAPI Industry Volume Share (%), by Poduct Type 2025 & 2033
- Figure 7: North America HPAPI Industry Revenue (Million), by Application 2025 & 2033
- Figure 8: North America HPAPI Industry Volume (K Unit), by Application 2025 & 2033
- Figure 9: North America HPAPI Industry Revenue Share (%), by Application 2025 & 2033
- Figure 10: North America HPAPI Industry Volume Share (%), by Application 2025 & 2033
- Figure 11: North America HPAPI Industry Revenue (Million), by Synthesis 2025 & 2033
- Figure 12: North America HPAPI Industry Volume (K Unit), by Synthesis 2025 & 2033
- Figure 13: North America HPAPI Industry Revenue Share (%), by Synthesis 2025 & 2033
- Figure 14: North America HPAPI Industry Volume Share (%), by Synthesis 2025 & 2033
- Figure 15: North America HPAPI Industry Revenue (Million), by Manufacturer 2025 & 2033
- Figure 16: North America HPAPI Industry Volume (K Unit), by Manufacturer 2025 & 2033
- Figure 17: North America HPAPI Industry Revenue Share (%), by Manufacturer 2025 & 2033
- Figure 18: North America HPAPI Industry Volume Share (%), by Manufacturer 2025 & 2033
- Figure 19: North America HPAPI Industry Revenue (Million), by Country 2025 & 2033
- Figure 20: North America HPAPI Industry Volume (K Unit), by Country 2025 & 2033
- Figure 21: North America HPAPI Industry Revenue Share (%), by Country 2025 & 2033
- Figure 22: North America HPAPI Industry Volume Share (%), by Country 2025 & 2033
- Figure 23: Europe HPAPI Industry Revenue (Million), by Poduct Type 2025 & 2033
- Figure 24: Europe HPAPI Industry Volume (K Unit), by Poduct Type 2025 & 2033
- Figure 25: Europe HPAPI Industry Revenue Share (%), by Poduct Type 2025 & 2033
- Figure 26: Europe HPAPI Industry Volume Share (%), by Poduct Type 2025 & 2033
- Figure 27: Europe HPAPI Industry Revenue (Million), by Application 2025 & 2033
- Figure 28: Europe HPAPI Industry Volume (K Unit), by Application 2025 & 2033
- Figure 29: Europe HPAPI Industry Revenue Share (%), by Application 2025 & 2033
- Figure 30: Europe HPAPI Industry Volume Share (%), by Application 2025 & 2033
- Figure 31: Europe HPAPI Industry Revenue (Million), by Synthesis 2025 & 2033
- Figure 32: Europe HPAPI Industry Volume (K Unit), by Synthesis 2025 & 2033
- Figure 33: Europe HPAPI Industry Revenue Share (%), by Synthesis 2025 & 2033
- Figure 34: Europe HPAPI Industry Volume Share (%), by Synthesis 2025 & 2033
- Figure 35: Europe HPAPI Industry Revenue (Million), by Manufacturer 2025 & 2033
- Figure 36: Europe HPAPI Industry Volume (K Unit), by Manufacturer 2025 & 2033
- Figure 37: Europe HPAPI Industry Revenue Share (%), by Manufacturer 2025 & 2033
- Figure 38: Europe HPAPI Industry Volume Share (%), by Manufacturer 2025 & 2033
- Figure 39: Europe HPAPI Industry Revenue (Million), by Country 2025 & 2033
- Figure 40: Europe HPAPI Industry Volume (K Unit), by Country 2025 & 2033
- Figure 41: Europe HPAPI Industry Revenue Share (%), by Country 2025 & 2033
- Figure 42: Europe HPAPI Industry Volume Share (%), by Country 2025 & 2033
- Figure 43: Asia Pacific HPAPI Industry Revenue (Million), by Poduct Type 2025 & 2033
- Figure 44: Asia Pacific HPAPI Industry Volume (K Unit), by Poduct Type 2025 & 2033
- Figure 45: Asia Pacific HPAPI Industry Revenue Share (%), by Poduct Type 2025 & 2033
- Figure 46: Asia Pacific HPAPI Industry Volume Share (%), by Poduct Type 2025 & 2033
- Figure 47: Asia Pacific HPAPI Industry Revenue (Million), by Application 2025 & 2033
- Figure 48: Asia Pacific HPAPI Industry Volume (K Unit), by Application 2025 & 2033
- Figure 49: Asia Pacific HPAPI Industry Revenue Share (%), by Application 2025 & 2033
- Figure 50: Asia Pacific HPAPI Industry Volume Share (%), by Application 2025 & 2033
- Figure 51: Asia Pacific HPAPI Industry Revenue (Million), by Synthesis 2025 & 2033
- Figure 52: Asia Pacific HPAPI Industry Volume (K Unit), by Synthesis 2025 & 2033
- Figure 53: Asia Pacific HPAPI Industry Revenue Share (%), by Synthesis 2025 & 2033
- Figure 54: Asia Pacific HPAPI Industry Volume Share (%), by Synthesis 2025 & 2033
- Figure 55: Asia Pacific HPAPI Industry Revenue (Million), by Manufacturer 2025 & 2033
- Figure 56: Asia Pacific HPAPI Industry Volume (K Unit), by Manufacturer 2025 & 2033
- Figure 57: Asia Pacific HPAPI Industry Revenue Share (%), by Manufacturer 2025 & 2033
- Figure 58: Asia Pacific HPAPI Industry Volume Share (%), by Manufacturer 2025 & 2033
- Figure 59: Asia Pacific HPAPI Industry Revenue (Million), by Country 2025 & 2033
- Figure 60: Asia Pacific HPAPI Industry Volume (K Unit), by Country 2025 & 2033
- Figure 61: Asia Pacific HPAPI Industry Revenue Share (%), by Country 2025 & 2033
- Figure 62: Asia Pacific HPAPI Industry Volume Share (%), by Country 2025 & 2033
- Figure 63: Middle East and Africa HPAPI Industry Revenue (Million), by Poduct Type 2025 & 2033
- Figure 64: Middle East and Africa HPAPI Industry Volume (K Unit), by Poduct Type 2025 & 2033
- Figure 65: Middle East and Africa HPAPI Industry Revenue Share (%), by Poduct Type 2025 & 2033
- Figure 66: Middle East and Africa HPAPI Industry Volume Share (%), by Poduct Type 2025 & 2033
- Figure 67: Middle East and Africa HPAPI Industry Revenue (Million), by Application 2025 & 2033
- Figure 68: Middle East and Africa HPAPI Industry Volume (K Unit), by Application 2025 & 2033
- Figure 69: Middle East and Africa HPAPI Industry Revenue Share (%), by Application 2025 & 2033
- Figure 70: Middle East and Africa HPAPI Industry Volume Share (%), by Application 2025 & 2033
- Figure 71: Middle East and Africa HPAPI Industry Revenue (Million), by Synthesis 2025 & 2033
- Figure 72: Middle East and Africa HPAPI Industry Volume (K Unit), by Synthesis 2025 & 2033
- Figure 73: Middle East and Africa HPAPI Industry Revenue Share (%), by Synthesis 2025 & 2033
- Figure 74: Middle East and Africa HPAPI Industry Volume Share (%), by Synthesis 2025 & 2033
- Figure 75: Middle East and Africa HPAPI Industry Revenue (Million), by Manufacturer 2025 & 2033
- Figure 76: Middle East and Africa HPAPI Industry Volume (K Unit), by Manufacturer 2025 & 2033
- Figure 77: Middle East and Africa HPAPI Industry Revenue Share (%), by Manufacturer 2025 & 2033
- Figure 78: Middle East and Africa HPAPI Industry Volume Share (%), by Manufacturer 2025 & 2033
- Figure 79: Middle East and Africa HPAPI Industry Revenue (Million), by Country 2025 & 2033
- Figure 80: Middle East and Africa HPAPI Industry Volume (K Unit), by Country 2025 & 2033
- Figure 81: Middle East and Africa HPAPI Industry Revenue Share (%), by Country 2025 & 2033
- Figure 82: Middle East and Africa HPAPI Industry Volume Share (%), by Country 2025 & 2033
- Figure 83: South America HPAPI Industry Revenue (Million), by Poduct Type 2025 & 2033
- Figure 84: South America HPAPI Industry Volume (K Unit), by Poduct Type 2025 & 2033
- Figure 85: South America HPAPI Industry Revenue Share (%), by Poduct Type 2025 & 2033
- Figure 86: South America HPAPI Industry Volume Share (%), by Poduct Type 2025 & 2033
- Figure 87: South America HPAPI Industry Revenue (Million), by Application 2025 & 2033
- Figure 88: South America HPAPI Industry Volume (K Unit), by Application 2025 & 2033
- Figure 89: South America HPAPI Industry Revenue Share (%), by Application 2025 & 2033
- Figure 90: South America HPAPI Industry Volume Share (%), by Application 2025 & 2033
- Figure 91: South America HPAPI Industry Revenue (Million), by Synthesis 2025 & 2033
- Figure 92: South America HPAPI Industry Volume (K Unit), by Synthesis 2025 & 2033
- Figure 93: South America HPAPI Industry Revenue Share (%), by Synthesis 2025 & 2033
- Figure 94: South America HPAPI Industry Volume Share (%), by Synthesis 2025 & 2033
- Figure 95: South America HPAPI Industry Revenue (Million), by Manufacturer 2025 & 2033
- Figure 96: South America HPAPI Industry Volume (K Unit), by Manufacturer 2025 & 2033
- Figure 97: South America HPAPI Industry Revenue Share (%), by Manufacturer 2025 & 2033
- Figure 98: South America HPAPI Industry Volume Share (%), by Manufacturer 2025 & 2033
- Figure 99: South America HPAPI Industry Revenue (Million), by Country 2025 & 2033
- Figure 100: South America HPAPI Industry Volume (K Unit), by Country 2025 & 2033
- Figure 101: South America HPAPI Industry Revenue Share (%), by Country 2025 & 2033
- Figure 102: South America HPAPI Industry Volume Share (%), by Country 2025 & 2033
List of Tables
- Table 1: Global HPAPI Industry Revenue Million Forecast, by Poduct Type 2020 & 2033
- Table 2: Global HPAPI Industry Volume K Unit Forecast, by Poduct Type 2020 & 2033
- Table 3: Global HPAPI Industry Revenue Million Forecast, by Application 2020 & 2033
- Table 4: Global HPAPI Industry Volume K Unit Forecast, by Application 2020 & 2033
- Table 5: Global HPAPI Industry Revenue Million Forecast, by Synthesis 2020 & 2033
- Table 6: Global HPAPI Industry Volume K Unit Forecast, by Synthesis 2020 & 2033
- Table 7: Global HPAPI Industry Revenue Million Forecast, by Manufacturer 2020 & 2033
- Table 8: Global HPAPI Industry Volume K Unit Forecast, by Manufacturer 2020 & 2033
- Table 9: Global HPAPI Industry Revenue Million Forecast, by Region 2020 & 2033
- Table 10: Global HPAPI Industry Volume K Unit Forecast, by Region 2020 & 2033
- Table 11: Global HPAPI Industry Revenue Million Forecast, by Poduct Type 2020 & 2033
- Table 12: Global HPAPI Industry Volume K Unit Forecast, by Poduct Type 2020 & 2033
- Table 13: Global HPAPI Industry Revenue Million Forecast, by Application 2020 & 2033
- Table 14: Global HPAPI Industry Volume K Unit Forecast, by Application 2020 & 2033
- Table 15: Global HPAPI Industry Revenue Million Forecast, by Synthesis 2020 & 2033
- Table 16: Global HPAPI Industry Volume K Unit Forecast, by Synthesis 2020 & 2033
- Table 17: Global HPAPI Industry Revenue Million Forecast, by Manufacturer 2020 & 2033
- Table 18: Global HPAPI Industry Volume K Unit Forecast, by Manufacturer 2020 & 2033
- Table 19: Global HPAPI Industry Revenue Million Forecast, by Country 2020 & 2033
- Table 20: Global HPAPI Industry Volume K Unit Forecast, by Country 2020 & 2033
- Table 21: United States HPAPI Industry Revenue (Million) Forecast, by Application 2020 & 2033
- Table 22: United States HPAPI Industry Volume (K Unit) Forecast, by Application 2020 & 2033
- Table 23: Canada HPAPI Industry Revenue (Million) Forecast, by Application 2020 & 2033
- Table 24: Canada HPAPI Industry Volume (K Unit) Forecast, by Application 2020 & 2033
- Table 25: Mexico HPAPI Industry Revenue (Million) Forecast, by Application 2020 & 2033
- Table 26: Mexico HPAPI Industry Volume (K Unit) Forecast, by Application 2020 & 2033
- Table 27: Global HPAPI Industry Revenue Million Forecast, by Poduct Type 2020 & 2033
- Table 28: Global HPAPI Industry Volume K Unit Forecast, by Poduct Type 2020 & 2033
- Table 29: Global HPAPI Industry Revenue Million Forecast, by Application 2020 & 2033
- Table 30: Global HPAPI Industry Volume K Unit Forecast, by Application 2020 & 2033
- Table 31: Global HPAPI Industry Revenue Million Forecast, by Synthesis 2020 & 2033
- Table 32: Global HPAPI Industry Volume K Unit Forecast, by Synthesis 2020 & 2033
- Table 33: Global HPAPI Industry Revenue Million Forecast, by Manufacturer 2020 & 2033
- Table 34: Global HPAPI Industry Volume K Unit Forecast, by Manufacturer 2020 & 2033
- Table 35: Global HPAPI Industry Revenue Million Forecast, by Country 2020 & 2033
- Table 36: Global HPAPI Industry Volume K Unit Forecast, by Country 2020 & 2033
- Table 37: Germany HPAPI Industry Revenue (Million) Forecast, by Application 2020 & 2033
- Table 38: Germany HPAPI Industry Volume (K Unit) Forecast, by Application 2020 & 2033
- Table 39: United Kingdom HPAPI Industry Revenue (Million) Forecast, by Application 2020 & 2033
- Table 40: United Kingdom HPAPI Industry Volume (K Unit) Forecast, by Application 2020 & 2033
- Table 41: France HPAPI Industry Revenue (Million) Forecast, by Application 2020 & 2033
- Table 42: France HPAPI Industry Volume (K Unit) Forecast, by Application 2020 & 2033
- Table 43: Italy HPAPI Industry Revenue (Million) Forecast, by Application 2020 & 2033
- Table 44: Italy HPAPI Industry Volume (K Unit) Forecast, by Application 2020 & 2033
- Table 45: Spain HPAPI Industry Revenue (Million) Forecast, by Application 2020 & 2033
- Table 46: Spain HPAPI Industry Volume (K Unit) Forecast, by Application 2020 & 2033
- Table 47: Rest of Europe HPAPI Industry Revenue (Million) Forecast, by Application 2020 & 2033
- Table 48: Rest of Europe HPAPI Industry Volume (K Unit) Forecast, by Application 2020 & 2033
- Table 49: Global HPAPI Industry Revenue Million Forecast, by Poduct Type 2020 & 2033
- Table 50: Global HPAPI Industry Volume K Unit Forecast, by Poduct Type 2020 & 2033
- Table 51: Global HPAPI Industry Revenue Million Forecast, by Application 2020 & 2033
- Table 52: Global HPAPI Industry Volume K Unit Forecast, by Application 2020 & 2033
- Table 53: Global HPAPI Industry Revenue Million Forecast, by Synthesis 2020 & 2033
- Table 54: Global HPAPI Industry Volume K Unit Forecast, by Synthesis 2020 & 2033
- Table 55: Global HPAPI Industry Revenue Million Forecast, by Manufacturer 2020 & 2033
- Table 56: Global HPAPI Industry Volume K Unit Forecast, by Manufacturer 2020 & 2033
- Table 57: Global HPAPI Industry Revenue Million Forecast, by Country 2020 & 2033
- Table 58: Global HPAPI Industry Volume K Unit Forecast, by Country 2020 & 2033
- Table 59: China HPAPI Industry Revenue (Million) Forecast, by Application 2020 & 2033
- Table 60: China HPAPI Industry Volume (K Unit) Forecast, by Application 2020 & 2033
- Table 61: Japan HPAPI Industry Revenue (Million) Forecast, by Application 2020 & 2033
- Table 62: Japan HPAPI Industry Volume (K Unit) Forecast, by Application 2020 & 2033
- Table 63: India HPAPI Industry Revenue (Million) Forecast, by Application 2020 & 2033
- Table 64: India HPAPI Industry Volume (K Unit) Forecast, by Application 2020 & 2033
- Table 65: Australia HPAPI Industry Revenue (Million) Forecast, by Application 2020 & 2033
- Table 66: Australia HPAPI Industry Volume (K Unit) Forecast, by Application 2020 & 2033
- Table 67: South Korea HPAPI Industry Revenue (Million) Forecast, by Application 2020 & 2033
- Table 68: South Korea HPAPI Industry Volume (K Unit) Forecast, by Application 2020 & 2033
- Table 69: Rest of Asia Pacific HPAPI Industry Revenue (Million) Forecast, by Application 2020 & 2033
- Table 70: Rest of Asia Pacific HPAPI Industry Volume (K Unit) Forecast, by Application 2020 & 2033
- Table 71: Global HPAPI Industry Revenue Million Forecast, by Poduct Type 2020 & 2033
- Table 72: Global HPAPI Industry Volume K Unit Forecast, by Poduct Type 2020 & 2033
- Table 73: Global HPAPI Industry Revenue Million Forecast, by Application 2020 & 2033
- Table 74: Global HPAPI Industry Volume K Unit Forecast, by Application 2020 & 2033
- Table 75: Global HPAPI Industry Revenue Million Forecast, by Synthesis 2020 & 2033
- Table 76: Global HPAPI Industry Volume K Unit Forecast, by Synthesis 2020 & 2033
- Table 77: Global HPAPI Industry Revenue Million Forecast, by Manufacturer 2020 & 2033
- Table 78: Global HPAPI Industry Volume K Unit Forecast, by Manufacturer 2020 & 2033
- Table 79: Global HPAPI Industry Revenue Million Forecast, by Country 2020 & 2033
- Table 80: Global HPAPI Industry Volume K Unit Forecast, by Country 2020 & 2033
- Table 81: GCC HPAPI Industry Revenue (Million) Forecast, by Application 2020 & 2033
- Table 82: GCC HPAPI Industry Volume (K Unit) Forecast, by Application 2020 & 2033
- Table 83: South Africa HPAPI Industry Revenue (Million) Forecast, by Application 2020 & 2033
- Table 84: South Africa HPAPI Industry Volume (K Unit) Forecast, by Application 2020 & 2033
- Table 85: Rest of Middle East and Africa HPAPI Industry Revenue (Million) Forecast, by Application 2020 & 2033
- Table 86: Rest of Middle East and Africa HPAPI Industry Volume (K Unit) Forecast, by Application 2020 & 2033
- Table 87: Global HPAPI Industry Revenue Million Forecast, by Poduct Type 2020 & 2033
- Table 88: Global HPAPI Industry Volume K Unit Forecast, by Poduct Type 2020 & 2033
- Table 89: Global HPAPI Industry Revenue Million Forecast, by Application 2020 & 2033
- Table 90: Global HPAPI Industry Volume K Unit Forecast, by Application 2020 & 2033
- Table 91: Global HPAPI Industry Revenue Million Forecast, by Synthesis 2020 & 2033
- Table 92: Global HPAPI Industry Volume K Unit Forecast, by Synthesis 2020 & 2033
- Table 93: Global HPAPI Industry Revenue Million Forecast, by Manufacturer 2020 & 2033
- Table 94: Global HPAPI Industry Volume K Unit Forecast, by Manufacturer 2020 & 2033
- Table 95: Global HPAPI Industry Revenue Million Forecast, by Country 2020 & 2033
- Table 96: Global HPAPI Industry Volume K Unit Forecast, by Country 2020 & 2033
- Table 97: Brazil HPAPI Industry Revenue (Million) Forecast, by Application 2020 & 2033
- Table 98: Brazil HPAPI Industry Volume (K Unit) Forecast, by Application 2020 & 2033
- Table 99: Argentina HPAPI Industry Revenue (Million) Forecast, by Application 2020 & 2033
- Table 100: Argentina HPAPI Industry Volume (K Unit) Forecast, by Application 2020 & 2033
- Table 101: Rest of South America HPAPI Industry Revenue (Million) Forecast, by Application 2020 & 2033
- Table 102: Rest of South America HPAPI Industry Volume (K Unit) Forecast, by Application 2020 & 2033
Frequently Asked Questions
1. What is the projected Compound Annual Growth Rate (CAGR) of the HPAPI Industry?
The projected CAGR is approximately 9.27%.
2. Which companies are prominent players in the HPAPI Industry?
Key companies in the market include Merck KGaA, Thermo Fisher Scientific Inc, Teva Pharmaceutical Industries Ltd, Sanofi (EUROAPI), AbbVie Inc, Corden Pharma International, Viatris Inc , Sun Pharmaceutical Industries Ltd, SK Biotek, Pfizer Inc.
3. What are the main segments of the HPAPI Industry?
The market segments include Poduct Type, Application, Synthesis, Manufacturer.
4. Can you provide details about the market size?
The market size is estimated to be USD 26.85 Million as of 2022.
5. What are some drivers contributing to market growth?
Increasing Demand for Pharmaceutical Drugs; Increasing Focus on Precision Medicine and High-potency APIs; Technological Advancements in High-potency API Manufacturing.
6. What are the notable trends driving market growth?
Generic High-potency Active Pharmaceutical Ingredients Segment is Expected to Record Significant Growth.
7. Are there any restraints impacting market growth?
Huge Capital Investment; Ever Changing Industry Standards and Guidelines.
8. Can you provide examples of recent developments in the market?
January 2023: Sai Life Sciences completed the construction of a new High-Potency API (HPAPI) manufacturing facility at its cGMP API Manufacturing site in Bidar, India. This addition significantly enhances the company's expertise in HPAPI development and production, providing customers with an expedited route for New Chemical Entity (NCE) development.
9. What pricing options are available for accessing the report?
Pricing options include single-user, multi-user, and enterprise licenses priced at USD 4750, USD 5250, and USD 8750 respectively.
10. Is the market size provided in terms of value or volume?
The market size is provided in terms of value, measured in Million and volume, measured in K Unit.
11. Are there any specific market keywords associated with the report?
Yes, the market keyword associated with the report is "HPAPI Industry," which aids in identifying and referencing the specific market segment covered.
12. How do I determine which pricing option suits my needs best?
The pricing options vary based on user requirements and access needs. Individual users may opt for single-user licenses, while businesses requiring broader access may choose multi-user or enterprise licenses for cost-effective access to the report.
13. Are there any additional resources or data provided in the HPAPI Industry report?
While the report offers comprehensive insights, it's advisable to review the specific contents or supplementary materials provided to ascertain if additional resources or data are available.
14. How can I stay updated on further developments or reports in the HPAPI Industry?
To stay informed about further developments, trends, and reports in the HPAPI Industry, consider subscribing to industry newsletters, following relevant companies and organizations, or regularly checking reputable industry news sources and publications.
Methodology
Step 1 - Identification of Relevant Samples Size from Population Database


Step 2 - Approaches for Defining Global Market Size (Value, Volume* & Price*)

Note*: In applicable scenarios
Step 3 - Data Sources
Primary Research
- Web Analytics
- Survey Reports
- Research Institute
- Latest Research Reports
- Opinion Leaders
Secondary Research
- Annual Reports
- White Paper
- Latest Press Release
- Industry Association
- Paid Database
- Investor Presentations

Step 4 - Data Triangulation
Involves using different sources of information in order to increase the validity of a study
These sources are likely to be stakeholders in a program - participants, other researchers, program staff, other community members, and so on.
Then we put all data in single framework & apply various statistical tools to find out the dynamic on the market.
During the analysis stage, feedback from the stakeholder groups would be compared to determine areas of agreement as well as areas of divergence

