
Key Insights
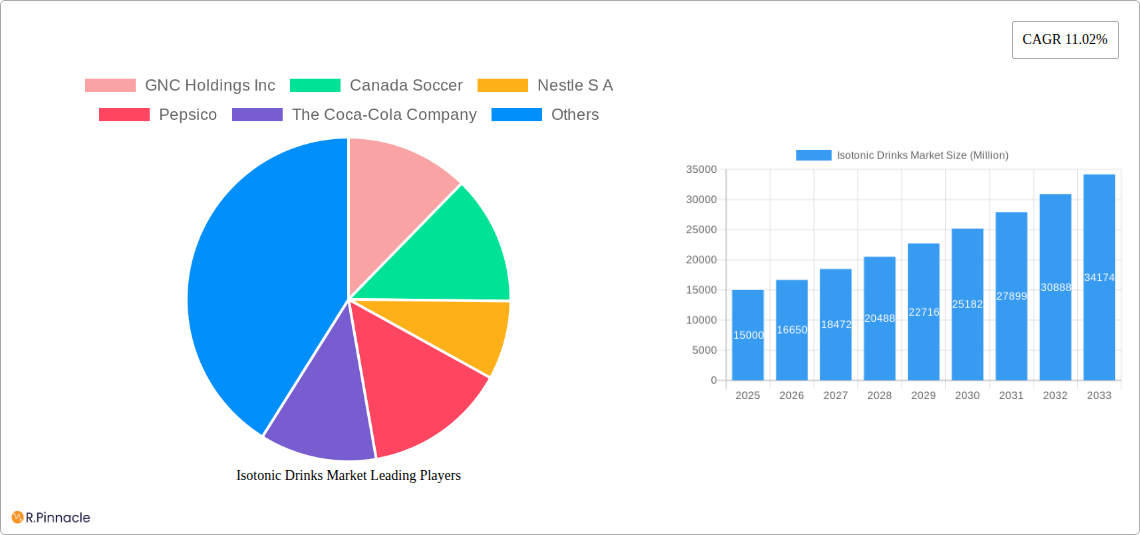
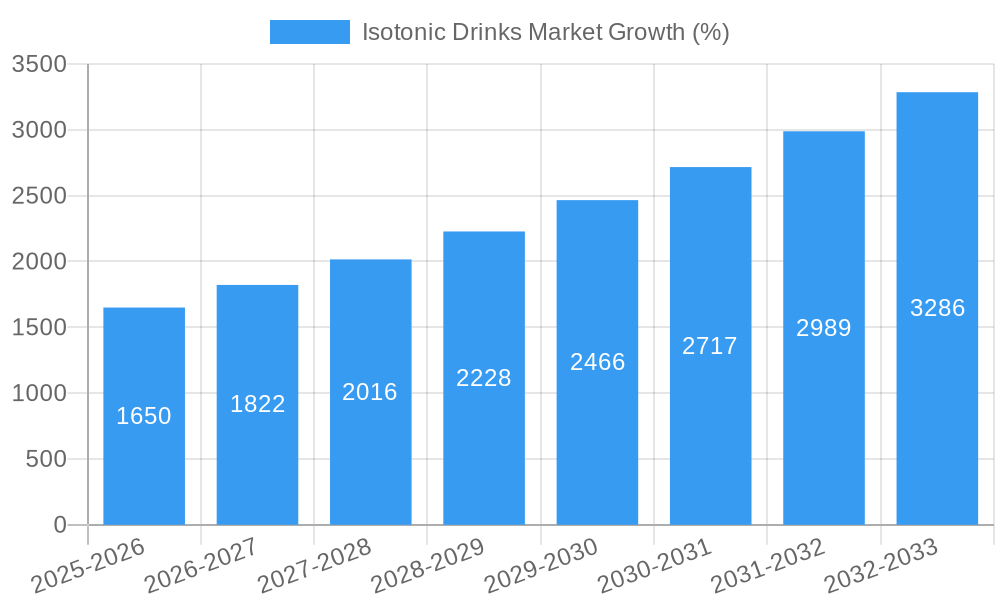
The global isotonic drinks market is experiencing robust growth, projected to reach a substantial value by 2033, driven by a compound annual growth rate (CAGR) of 11.02% from 2025 to 2033. This expansion is fueled by several key factors. Increasing health consciousness among consumers, particularly athletes and fitness enthusiasts, is a primary driver, as isotonic drinks effectively replenish electrolytes lost through sweat during physical activity. The rising prevalence of sports and fitness activities globally further contributes to market growth. Furthermore, the growing popularity of convenient, ready-to-drink formats and the increasing availability of isotonic drinks through diverse distribution channels, including online retailers and specialized sports nutrition stores, are significantly boosting market penetration. Product diversification, with options like liquid, powder, and others catering to diverse consumer preferences, enhances market appeal. However, challenges remain, including the potential for negative health consequences associated with excessive consumption and concerns regarding artificial sweeteners and added sugars found in some brands. These factors influence consumer choices and create opportunities for brands offering healthier, naturally sweetened alternatives.
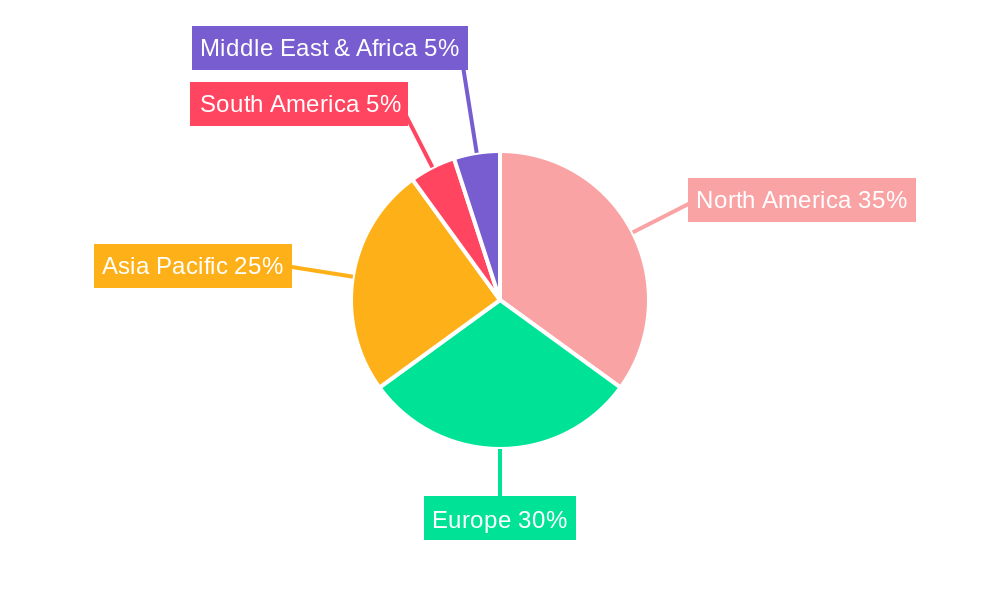
The market segmentation reveals a dynamic landscape. The liquid format dominates the product type segment, benefiting from its ease of consumption and immediate hydration. Online distribution channels are witnessing rapid growth, driven by the increasing e-commerce penetration and consumer preference for convenient home delivery. North America and Europe currently represent significant market shares, driven by high levels of sports participation and health awareness. However, Asia-Pacific is emerging as a high-growth region, fueled by rising disposable incomes and a burgeoning fitness culture. Leading brands, including GNC Holdings Inc., Nestle S.A., and PepsiCo, are actively innovating and expanding their product portfolios to capitalize on the market's potential. Competitive pressures are shaping the market dynamics, with brands emphasizing product differentiation through unique formulations, flavors, and health benefits. Strategic partnerships, new product launches, and geographic expansion initiatives are key strategies employed by companies to secure a stronger foothold within this expanding market.
Isotonic Drinks Market Report: 2019-2033
This comprehensive report provides a detailed analysis of the Isotonic Drinks Market, offering actionable insights for industry professionals and strategic decision-makers. Covering the period from 2019 to 2033, with a focus on 2025, this report meticulously examines market dynamics, competitive landscapes, and future growth potential. The report is segmented by product type (liquid, powder, others) and distribution channel (online, offline), providing a granular understanding of this dynamic market. The global market size is projected to reach xx Million by 2033.
Isotonic Drinks Market Structure & Innovation Trends
This section analyzes the market structure, highlighting key players, market concentration, and innovation trends. We examine the competitive landscape through metrics like market share and the impact of mergers and acquisitions (M&A) activities, with deal values analyzed where data is available. Regulatory frameworks influencing the market are also discussed, alongside a review of substitute products and end-user demographics. The analysis covers the historical period (2019-2024), the base year (2025), and the forecast period (2025-2033).
- Market Concentration: The market exhibits a [Describe Market Concentration: e.g., moderately concentrated structure] with [Number] major players holding approximately [Percentage]% of the market share in 2024.
- Innovation Drivers: Key drivers include the rising demand for functional beverages, advancements in formulation technology (e.g., enhanced electrolyte profiles and natural flavorings), and increasing health and wellness awareness among consumers.
- Regulatory Frameworks: Regulations concerning labeling, ingredient claims, and food safety significantly impact product development and market entry.
- Product Substitutes: Competition comes from other hydration drinks, sports drinks, and electrolyte supplements.
- End-User Demographics: The primary end-users are athletes, fitness enthusiasts, and individuals seeking enhanced hydration.
- M&A Activities: The market has witnessed [Number] significant M&A deals during the study period, with a total estimated value of xx Million. Examples include [mention any specific M&A example, if data is available].
Isotonic Drinks Market Dynamics & Trends
This section delves into the market dynamics, exploring growth drivers, technological disruptions, consumer preferences, and competitive dynamics. We examine the Compound Annual Growth Rate (CAGR) and market penetration for key segments.
[Insert 600 words here analyzing market growth drivers (e.g., rising health consciousness, increasing participation in sports and fitness activities), technological disruptions (e.g., advancements in packaging and formulation), evolving consumer preferences (e.g., demand for natural and organic ingredients), and competitive dynamics (e.g., pricing strategies, product differentiation, brand loyalty). Include specific metrics like CAGR and market penetration rates where available.]
Dominant Regions & Segments in Isotonic Drinks Market
This section identifies the leading regions and segments within the Isotonic Drinks Market based on product type (Liquid, Powder, Others) and distribution channel (Online, Offline).
By Product Type:
- Liquid: The liquid segment dominates due to its convenience and immediate hydration benefits.
- Powder: This segment is experiencing growth driven by [reasons for growth].
- Others: This category includes [specify other forms, e.g., gels, tablets], with [growth factors].
By Distribution Channel:
- Offline: Offline channels (retail stores, supermarkets) remain the dominant distribution channel due to [reasons for dominance].
- Online: The online segment is experiencing significant growth, driven by the expansion of e-commerce platforms and increased online shopping.
[Insert detailed dominance analysis, including key drivers such as economic policies and infrastructure development, for each region and segment (approximately 600 words total). Include bullet points outlining specific factors.]
Isotonic Drinks Market Product Innovations
Recent product developments have focused on enhanced electrolyte formulations, natural ingredients, and convenient packaging. Technological advancements, such as improved flavor profiles and shelf-life extension, are enhancing product appeal. These innovations are contributing to increased market penetration and heightened competition.
Report Scope & Segmentation Analysis
This report segments the Isotonic Drinks Market by product type (liquid, powder, others) and distribution channel (online, offline). Each segment's growth projections, market size, and competitive dynamics are analyzed, providing a comprehensive overview of the market's structure. The analysis spans the historical period (2019-2024), the base year (2025), and the forecast period (2025-2033).
[Insert 100-150 words detailing each segment (product type and distribution channel), including growth projections, market sizes, and competitive dynamics.]
Key Drivers of Isotonic Drinks Market Growth
The Isotonic Drinks Market's growth is fueled by several key drivers:
- Rising Health and Wellness Awareness: Consumers are increasingly prioritizing health and wellness, leading to higher demand for functional beverages.
- Increased Participation in Sports and Fitness Activities: The growing popularity of sports and fitness activities fuels the demand for effective hydration solutions.
- Technological Advancements: Innovations in formulation and packaging are enhancing product appeal and convenience.
Challenges in the Isotonic Drinks Market Sector
Challenges include:
- Intense Competition: The market is highly competitive, with many established and emerging players vying for market share.
- Regulatory Hurdles: Stricter regulations on labeling, ingredients, and health claims can increase product development costs.
- Supply Chain Disruptions: Global supply chain disruptions can impact the availability of raw materials and packaging.
Emerging Opportunities in Isotonic Drinks Market
Emerging opportunities include:
- Expansion into New Markets: Untapped markets in developing economies offer significant growth potential.
- Development of Innovative Products: Formulations targeting specific consumer needs (e.g., low-sugar, organic, specialized electrolyte blends) hold strong promise.
- Strategic Partnerships and Collaborations: Partnerships with athletes, fitness influencers, and health organizations can enhance brand visibility and market penetration.
Leading Players in the Isotonic Drinks Market Market
- GNC Holdings Inc
- Canada Soccer
- Nestle S A
- Pepsico
- The Coca-Cola Company
- Lyteline LLC
- Monster Beverage Corp
- Vitalyte Sports Nutrition Inc
- HIGH5 Sports Nutrition
- Bright Life Care Private Limited
- *List Not Exhaustive
Key Developments in Isotonic Drinks Market Industry
- March 2022: Canada Soccer and Gatorade® Canada announced a multi-year partnership, establishing Gatorade as the official isotonic and sports nutrition partner. This significantly boosts Gatorade's brand visibility and market share within the Canadian sports market.
- 2022: HIGH5 Sports Nutrition launched two new products: Isotonic Hydration and Energy Gel Electrolyte, expanding its product portfolio and targeting diverse consumer needs. This strengthens their competitive position by offering a wider range of products.
- March 2021: IPRO partnered with Scarlets Rugby, potentially increasing their market reach and reinforcing their brand image within the sports sector. This partnership could lead to increased sales and brand recognition.
Future Outlook for Isotonic Drinks Market Market
The Isotonic Drinks Market is poised for continued growth, driven by increasing health consciousness, rising disposable incomes in emerging economies, and ongoing product innovation. Strategic partnerships, expansion into new geographic markets, and the development of specialized products targeting niche segments will play a key role in shaping the market's future trajectory. The market is expected to witness significant growth in the forecast period, driven by these factors and sustained demand from health-conscious consumers.
Isotonic Drinks Market Segmentation
-
1. Product Type
- 1.1. Liquid
- 1.2. Powder
- 1.3. Other Product Types
-
2. Distribution Channel
- 2.1. Online
- 2.2. Offline
Isotonic Drinks Market Segmentation By Geography
-
1. North America
- 1.1. United States
- 1.2. Canada
- 1.3. Mexico
- 1.4. Rest of North America
-
2. Europe
- 2.1. United Kingdom
- 2.2. Germany
- 2.3. Spain
- 2.4. France
- 2.5. Italy
- 2.6. Russia
- 2.7. Rest of Europe
-
3. Asia Pacific
- 3.1. China
- 3.2. Japan
- 3.3. India
- 3.4. Australia
- 3.5. Rest of Asia Pacific
-
4. South America
- 4.1. Brazil
- 4.2. Argentina
- 4.3. Rest of South America
-
5. Middle East and Africa
- 5.1. Saudi Arabia
- 5.2. South Africa
- 5.3. Rest of Middle East and Africa
Isotonic Drinks Market REPORT HIGHLIGHTS
| Aspects | Details |
|---|---|
| Study Period | 2019-2033 |
| Base Year | 2024 |
| Estimated Year | 2025 |
| Forecast Period | 2025-2033 |
| Historical Period | 2019-2024 |
| Growth Rate | CAGR of 11.02% from 2019-2033 |
| Segmentation |
|
Table of Contents
- 1. Introduction
- 1.1. Research Scope
- 1.2. Market Segmentation
- 1.3. Research Methodology
- 1.4. Definitions and Assumptions
- 2. Executive Summary
- 2.1. Introduction
- 3. Market Dynamics
- 3.1. Introduction
- 3.2. Market Drivers
- 3.2.1. Government Initiatives and E-commerce Penetration
- 3.3. Market Restrains
- 3.3.1. Detrimental Health Impact of Caffeine Intake
- 3.4. Market Trends
- 3.4.1. Product Differentiation as a Key Strategy
- 4. Market Factor Analysis
- 4.1. Porters Five Forces
- 4.2. Supply/Value Chain
- 4.3. PESTEL analysis
- 4.4. Market Entropy
- 4.5. Patent/Trademark Analysis
- 5. Global Isotonic Drinks Market Analysis, Insights and Forecast, 2019-2031
- 5.1. Market Analysis, Insights and Forecast - by Product Type
- 5.1.1. Liquid
- 5.1.2. Powder
- 5.1.3. Other Product Types
- 5.2. Market Analysis, Insights and Forecast - by Distribution Channel
- 5.2.1. Online
- 5.2.2. Offline
- 5.3. Market Analysis, Insights and Forecast - by Region
- 5.3.1. North America
- 5.3.2. Europe
- 5.3.3. Asia Pacific
- 5.3.4. South America
- 5.3.5. Middle East and Africa
- 5.1. Market Analysis, Insights and Forecast - by Product Type
- 6. North America Isotonic Drinks Market Analysis, Insights and Forecast, 2019-2031
- 6.1. Market Analysis, Insights and Forecast - by Product Type
- 6.1.1. Liquid
- 6.1.2. Powder
- 6.1.3. Other Product Types
- 6.2. Market Analysis, Insights and Forecast - by Distribution Channel
- 6.2.1. Online
- 6.2.2. Offline
- 6.1. Market Analysis, Insights and Forecast - by Product Type
- 7. Europe Isotonic Drinks Market Analysis, Insights and Forecast, 2019-2031
- 7.1. Market Analysis, Insights and Forecast - by Product Type
- 7.1.1. Liquid
- 7.1.2. Powder
- 7.1.3. Other Product Types
- 7.2. Market Analysis, Insights and Forecast - by Distribution Channel
- 7.2.1. Online
- 7.2.2. Offline
- 7.1. Market Analysis, Insights and Forecast - by Product Type
- 8. Asia Pacific Isotonic Drinks Market Analysis, Insights and Forecast, 2019-2031
- 8.1. Market Analysis, Insights and Forecast - by Product Type
- 8.1.1. Liquid
- 8.1.2. Powder
- 8.1.3. Other Product Types
- 8.2. Market Analysis, Insights and Forecast - by Distribution Channel
- 8.2.1. Online
- 8.2.2. Offline
- 8.1. Market Analysis, Insights and Forecast - by Product Type
- 9. South America Isotonic Drinks Market Analysis, Insights and Forecast, 2019-2031
- 9.1. Market Analysis, Insights and Forecast - by Product Type
- 9.1.1. Liquid
- 9.1.2. Powder
- 9.1.3. Other Product Types
- 9.2. Market Analysis, Insights and Forecast - by Distribution Channel
- 9.2.1. Online
- 9.2.2. Offline
- 9.1. Market Analysis, Insights and Forecast - by Product Type
- 10. Middle East and Africa Isotonic Drinks Market Analysis, Insights and Forecast, 2019-2031
- 10.1. Market Analysis, Insights and Forecast - by Product Type
- 10.1.1. Liquid
- 10.1.2. Powder
- 10.1.3. Other Product Types
- 10.2. Market Analysis, Insights and Forecast - by Distribution Channel
- 10.2.1. Online
- 10.2.2. Offline
- 10.1. Market Analysis, Insights and Forecast - by Product Type
- 11. North America Isotonic Drinks Market Analysis, Insights and Forecast, 2019-2031
- 11.1. Market Analysis, Insights and Forecast - By Country/Sub-region
- 11.1.1 United States
- 11.1.2 Canada
- 11.1.3 Mexico
- 11.1.4 Rest of North America
- 12. Europe Isotonic Drinks Market Analysis, Insights and Forecast, 2019-2031
- 12.1. Market Analysis, Insights and Forecast - By Country/Sub-region
- 12.1.1 United Kingdom
- 12.1.2 Germany
- 12.1.3 Spain
- 12.1.4 France
- 12.1.5 Italy
- 12.1.6 Russia
- 12.1.7 Rest of Europe
- 13. Asia Pacific Isotonic Drinks Market Analysis, Insights and Forecast, 2019-2031
- 13.1. Market Analysis, Insights and Forecast - By Country/Sub-region
- 13.1.1 China
- 13.1.2 Japan
- 13.1.3 India
- 13.1.4 Australia
- 13.1.5 Rest of Asia Pacific
- 14. South America Isotonic Drinks Market Analysis, Insights and Forecast, 2019-2031
- 14.1. Market Analysis, Insights and Forecast - By Country/Sub-region
- 14.1.1 Brazil
- 14.1.2 Argentina
- 14.1.3 Rest of South America
- 15. Middle East & Africa Isotonic Drinks Market Analysis, Insights and Forecast, 2019-2031
- 15.1. Market Analysis, Insights and Forecast - By Country/Sub-region
- 15.1.1 UAE
- 15.1.2 South Africa
- 15.1.3 Saudi Arabia
- 15.1.4 Rest of MEA
- 16. Competitive Analysis
- 16.1. Global Market Share Analysis 2024
- 16.2. Company Profiles
- 16.2.1 GNC Holdings Inc
- 16.2.1.1. Overview
- 16.2.1.2. Products
- 16.2.1.3. SWOT Analysis
- 16.2.1.4. Recent Developments
- 16.2.1.5. Financials (Based on Availability)
- 16.2.2 Canada Soccer
- 16.2.2.1. Overview
- 16.2.2.2. Products
- 16.2.2.3. SWOT Analysis
- 16.2.2.4. Recent Developments
- 16.2.2.5. Financials (Based on Availability)
- 16.2.3 Nestle S A
- 16.2.3.1. Overview
- 16.2.3.2. Products
- 16.2.3.3. SWOT Analysis
- 16.2.3.4. Recent Developments
- 16.2.3.5. Financials (Based on Availability)
- 16.2.4 Pepsico
- 16.2.4.1. Overview
- 16.2.4.2. Products
- 16.2.4.3. SWOT Analysis
- 16.2.4.4. Recent Developments
- 16.2.4.5. Financials (Based on Availability)
- 16.2.5 The Coca-Cola Company
- 16.2.5.1. Overview
- 16.2.5.2. Products
- 16.2.5.3. SWOT Analysis
- 16.2.5.4. Recent Developments
- 16.2.5.5. Financials (Based on Availability)
- 16.2.6 Lyteline LLC
- 16.2.6.1. Overview
- 16.2.6.2. Products
- 16.2.6.3. SWOT Analysis
- 16.2.6.4. Recent Developments
- 16.2.6.5. Financials (Based on Availability)
- 16.2.7 Monster Beverage Corp
- 16.2.7.1. Overview
- 16.2.7.2. Products
- 16.2.7.3. SWOT Analysis
- 16.2.7.4. Recent Developments
- 16.2.7.5. Financials (Based on Availability)
- 16.2.8 Vitalyte Sports Nutrition Inc
- 16.2.8.1. Overview
- 16.2.8.2. Products
- 16.2.8.3. SWOT Analysis
- 16.2.8.4. Recent Developments
- 16.2.8.5. Financials (Based on Availability)
- 16.2.9 HIGH5 Sports Nutrition
- 16.2.9.1. Overview
- 16.2.9.2. Products
- 16.2.9.3. SWOT Analysis
- 16.2.9.4. Recent Developments
- 16.2.9.5. Financials (Based on Availability)
- 16.2.10 Bright Life Care Private Limited*List Not Exhaustive
- 16.2.10.1. Overview
- 16.2.10.2. Products
- 16.2.10.3. SWOT Analysis
- 16.2.10.4. Recent Developments
- 16.2.10.5. Financials (Based on Availability)
- 16.2.1 GNC Holdings Inc
List of Figures
- Figure 1: Global Isotonic Drinks Market Revenue Breakdown (Million, %) by Region 2024 & 2032
- Figure 2: North America Isotonic Drinks Market Revenue (Million), by Country 2024 & 2032
- Figure 3: North America Isotonic Drinks Market Revenue Share (%), by Country 2024 & 2032
- Figure 4: Europe Isotonic Drinks Market Revenue (Million), by Country 2024 & 2032
- Figure 5: Europe Isotonic Drinks Market Revenue Share (%), by Country 2024 & 2032
- Figure 6: Asia Pacific Isotonic Drinks Market Revenue (Million), by Country 2024 & 2032
- Figure 7: Asia Pacific Isotonic Drinks Market Revenue Share (%), by Country 2024 & 2032
- Figure 8: South America Isotonic Drinks Market Revenue (Million), by Country 2024 & 2032
- Figure 9: South America Isotonic Drinks Market Revenue Share (%), by Country 2024 & 2032
- Figure 10: Middle East & Africa Isotonic Drinks Market Revenue (Million), by Country 2024 & 2032
- Figure 11: Middle East & Africa Isotonic Drinks Market Revenue Share (%), by Country 2024 & 2032
- Figure 12: North America Isotonic Drinks Market Revenue (Million), by Product Type 2024 & 2032
- Figure 13: North America Isotonic Drinks Market Revenue Share (%), by Product Type 2024 & 2032
- Figure 14: North America Isotonic Drinks Market Revenue (Million), by Distribution Channel 2024 & 2032
- Figure 15: North America Isotonic Drinks Market Revenue Share (%), by Distribution Channel 2024 & 2032
- Figure 16: North America Isotonic Drinks Market Revenue (Million), by Country 2024 & 2032
- Figure 17: North America Isotonic Drinks Market Revenue Share (%), by Country 2024 & 2032
- Figure 18: Europe Isotonic Drinks Market Revenue (Million), by Product Type 2024 & 2032
- Figure 19: Europe Isotonic Drinks Market Revenue Share (%), by Product Type 2024 & 2032
- Figure 20: Europe Isotonic Drinks Market Revenue (Million), by Distribution Channel 2024 & 2032
- Figure 21: Europe Isotonic Drinks Market Revenue Share (%), by Distribution Channel 2024 & 2032
- Figure 22: Europe Isotonic Drinks Market Revenue (Million), by Country 2024 & 2032
- Figure 23: Europe Isotonic Drinks Market Revenue Share (%), by Country 2024 & 2032
- Figure 24: Asia Pacific Isotonic Drinks Market Revenue (Million), by Product Type 2024 & 2032
- Figure 25: Asia Pacific Isotonic Drinks Market Revenue Share (%), by Product Type 2024 & 2032
- Figure 26: Asia Pacific Isotonic Drinks Market Revenue (Million), by Distribution Channel 2024 & 2032
- Figure 27: Asia Pacific Isotonic Drinks Market Revenue Share (%), by Distribution Channel 2024 & 2032
- Figure 28: Asia Pacific Isotonic Drinks Market Revenue (Million), by Country 2024 & 2032
- Figure 29: Asia Pacific Isotonic Drinks Market Revenue Share (%), by Country 2024 & 2032
- Figure 30: South America Isotonic Drinks Market Revenue (Million), by Product Type 2024 & 2032
- Figure 31: South America Isotonic Drinks Market Revenue Share (%), by Product Type 2024 & 2032
- Figure 32: South America Isotonic Drinks Market Revenue (Million), by Distribution Channel 2024 & 2032
- Figure 33: South America Isotonic Drinks Market Revenue Share (%), by Distribution Channel 2024 & 2032
- Figure 34: South America Isotonic Drinks Market Revenue (Million), by Country 2024 & 2032
- Figure 35: South America Isotonic Drinks Market Revenue Share (%), by Country 2024 & 2032
- Figure 36: Middle East and Africa Isotonic Drinks Market Revenue (Million), by Product Type 2024 & 2032
- Figure 37: Middle East and Africa Isotonic Drinks Market Revenue Share (%), by Product Type 2024 & 2032
- Figure 38: Middle East and Africa Isotonic Drinks Market Revenue (Million), by Distribution Channel 2024 & 2032
- Figure 39: Middle East and Africa Isotonic Drinks Market Revenue Share (%), by Distribution Channel 2024 & 2032
- Figure 40: Middle East and Africa Isotonic Drinks Market Revenue (Million), by Country 2024 & 2032
- Figure 41: Middle East and Africa Isotonic Drinks Market Revenue Share (%), by Country 2024 & 2032
List of Tables
- Table 1: Global Isotonic Drinks Market Revenue Million Forecast, by Region 2019 & 2032
- Table 2: Global Isotonic Drinks Market Revenue Million Forecast, by Product Type 2019 & 2032
- Table 3: Global Isotonic Drinks Market Revenue Million Forecast, by Distribution Channel 2019 & 2032
- Table 4: Global Isotonic Drinks Market Revenue Million Forecast, by Region 2019 & 2032
- Table 5: Global Isotonic Drinks Market Revenue Million Forecast, by Country 2019 & 2032
- Table 6: United States Isotonic Drinks Market Revenue (Million) Forecast, by Application 2019 & 2032
- Table 7: Canada Isotonic Drinks Market Revenue (Million) Forecast, by Application 2019 & 2032
- Table 8: Mexico Isotonic Drinks Market Revenue (Million) Forecast, by Application 2019 & 2032
- Table 9: Rest of North America Isotonic Drinks Market Revenue (Million) Forecast, by Application 2019 & 2032
- Table 10: Global Isotonic Drinks Market Revenue Million Forecast, by Country 2019 & 2032
- Table 11: United Kingdom Isotonic Drinks Market Revenue (Million) Forecast, by Application 2019 & 2032
- Table 12: Germany Isotonic Drinks Market Revenue (Million) Forecast, by Application 2019 & 2032
- Table 13: Spain Isotonic Drinks Market Revenue (Million) Forecast, by Application 2019 & 2032
- Table 14: France Isotonic Drinks Market Revenue (Million) Forecast, by Application 2019 & 2032
- Table 15: Italy Isotonic Drinks Market Revenue (Million) Forecast, by Application 2019 & 2032
- Table 16: Russia Isotonic Drinks Market Revenue (Million) Forecast, by Application 2019 & 2032
- Table 17: Rest of Europe Isotonic Drinks Market Revenue (Million) Forecast, by Application 2019 & 2032
- Table 18: Global Isotonic Drinks Market Revenue Million Forecast, by Country 2019 & 2032
- Table 19: China Isotonic Drinks Market Revenue (Million) Forecast, by Application 2019 & 2032
- Table 20: Japan Isotonic Drinks Market Revenue (Million) Forecast, by Application 2019 & 2032
- Table 21: India Isotonic Drinks Market Revenue (Million) Forecast, by Application 2019 & 2032
- Table 22: Australia Isotonic Drinks Market Revenue (Million) Forecast, by Application 2019 & 2032
- Table 23: Rest of Asia Pacific Isotonic Drinks Market Revenue (Million) Forecast, by Application 2019 & 2032
- Table 24: Global Isotonic Drinks Market Revenue Million Forecast, by Country 2019 & 2032
- Table 25: Brazil Isotonic Drinks Market Revenue (Million) Forecast, by Application 2019 & 2032
- Table 26: Argentina Isotonic Drinks Market Revenue (Million) Forecast, by Application 2019 & 2032
- Table 27: Rest of South America Isotonic Drinks Market Revenue (Million) Forecast, by Application 2019 & 2032
- Table 28: Global Isotonic Drinks Market Revenue Million Forecast, by Country 2019 & 2032
- Table 29: UAE Isotonic Drinks Market Revenue (Million) Forecast, by Application 2019 & 2032
- Table 30: South Africa Isotonic Drinks Market Revenue (Million) Forecast, by Application 2019 & 2032
- Table 31: Saudi Arabia Isotonic Drinks Market Revenue (Million) Forecast, by Application 2019 & 2032
- Table 32: Rest of MEA Isotonic Drinks Market Revenue (Million) Forecast, by Application 2019 & 2032
- Table 33: Global Isotonic Drinks Market Revenue Million Forecast, by Product Type 2019 & 2032
- Table 34: Global Isotonic Drinks Market Revenue Million Forecast, by Distribution Channel 2019 & 2032
- Table 35: Global Isotonic Drinks Market Revenue Million Forecast, by Country 2019 & 2032
- Table 36: United States Isotonic Drinks Market Revenue (Million) Forecast, by Application 2019 & 2032
- Table 37: Canada Isotonic Drinks Market Revenue (Million) Forecast, by Application 2019 & 2032
- Table 38: Mexico Isotonic Drinks Market Revenue (Million) Forecast, by Application 2019 & 2032
- Table 39: Rest of North America Isotonic Drinks Market Revenue (Million) Forecast, by Application 2019 & 2032
- Table 40: Global Isotonic Drinks Market Revenue Million Forecast, by Product Type 2019 & 2032
- Table 41: Global Isotonic Drinks Market Revenue Million Forecast, by Distribution Channel 2019 & 2032
- Table 42: Global Isotonic Drinks Market Revenue Million Forecast, by Country 2019 & 2032
- Table 43: United Kingdom Isotonic Drinks Market Revenue (Million) Forecast, by Application 2019 & 2032
- Table 44: Germany Isotonic Drinks Market Revenue (Million) Forecast, by Application 2019 & 2032
- Table 45: Spain Isotonic Drinks Market Revenue (Million) Forecast, by Application 2019 & 2032
- Table 46: France Isotonic Drinks Market Revenue (Million) Forecast, by Application 2019 & 2032
- Table 47: Italy Isotonic Drinks Market Revenue (Million) Forecast, by Application 2019 & 2032
- Table 48: Russia Isotonic Drinks Market Revenue (Million) Forecast, by Application 2019 & 2032
- Table 49: Rest of Europe Isotonic Drinks Market Revenue (Million) Forecast, by Application 2019 & 2032
- Table 50: Global Isotonic Drinks Market Revenue Million Forecast, by Product Type 2019 & 2032
- Table 51: Global Isotonic Drinks Market Revenue Million Forecast, by Distribution Channel 2019 & 2032
- Table 52: Global Isotonic Drinks Market Revenue Million Forecast, by Country 2019 & 2032
- Table 53: China Isotonic Drinks Market Revenue (Million) Forecast, by Application 2019 & 2032
- Table 54: Japan Isotonic Drinks Market Revenue (Million) Forecast, by Application 2019 & 2032
- Table 55: India Isotonic Drinks Market Revenue (Million) Forecast, by Application 2019 & 2032
- Table 56: Australia Isotonic Drinks Market Revenue (Million) Forecast, by Application 2019 & 2032
- Table 57: Rest of Asia Pacific Isotonic Drinks Market Revenue (Million) Forecast, by Application 2019 & 2032
- Table 58: Global Isotonic Drinks Market Revenue Million Forecast, by Product Type 2019 & 2032
- Table 59: Global Isotonic Drinks Market Revenue Million Forecast, by Distribution Channel 2019 & 2032
- Table 60: Global Isotonic Drinks Market Revenue Million Forecast, by Country 2019 & 2032
- Table 61: Brazil Isotonic Drinks Market Revenue (Million) Forecast, by Application 2019 & 2032
- Table 62: Argentina Isotonic Drinks Market Revenue (Million) Forecast, by Application 2019 & 2032
- Table 63: Rest of South America Isotonic Drinks Market Revenue (Million) Forecast, by Application 2019 & 2032
- Table 64: Global Isotonic Drinks Market Revenue Million Forecast, by Product Type 2019 & 2032
- Table 65: Global Isotonic Drinks Market Revenue Million Forecast, by Distribution Channel 2019 & 2032
- Table 66: Global Isotonic Drinks Market Revenue Million Forecast, by Country 2019 & 2032
- Table 67: Saudi Arabia Isotonic Drinks Market Revenue (Million) Forecast, by Application 2019 & 2032
- Table 68: South Africa Isotonic Drinks Market Revenue (Million) Forecast, by Application 2019 & 2032
- Table 69: Rest of Middle East and Africa Isotonic Drinks Market Revenue (Million) Forecast, by Application 2019 & 2032
Frequently Asked Questions
1. What is the projected Compound Annual Growth Rate (CAGR) of the Isotonic Drinks Market?
The projected CAGR is approximately 11.02%.
2. Which companies are prominent players in the Isotonic Drinks Market?
Key companies in the market include GNC Holdings Inc, Canada Soccer, Nestle S A, Pepsico, The Coca-Cola Company, Lyteline LLC, Monster Beverage Corp, Vitalyte Sports Nutrition Inc, HIGH5 Sports Nutrition, Bright Life Care Private Limited*List Not Exhaustive.
3. What are the main segments of the Isotonic Drinks Market?
The market segments include Product Type, Distribution Channel.
4. Can you provide details about the market size?
The market size is estimated to be USD XX Million as of 2022.
5. What are some drivers contributing to market growth?
Government Initiatives and E-commerce Penetration.
6. What are the notable trends driving market growth?
Product Differentiation as a Key Strategy.
7. Are there any restraints impacting market growth?
Detrimental Health Impact of Caffeine Intake.
8. Can you provide examples of recent developments in the market?
In March 2022, Canada Soccer and Gatorade® Canada announced a new multi-year partnership that established Gatorade Canada as the official Isotonic and Sports Nutrition partner of Canada Soccer.
9. What pricing options are available for accessing the report?
Pricing options include single-user, multi-user, and enterprise licenses priced at USD 4750, USD 5250, and USD 8750 respectively.
10. Is the market size provided in terms of value or volume?
The market size is provided in terms of value, measured in Million.
11. Are there any specific market keywords associated with the report?
Yes, the market keyword associated with the report is "Isotonic Drinks Market," which aids in identifying and referencing the specific market segment covered.
12. How do I determine which pricing option suits my needs best?
The pricing options vary based on user requirements and access needs. Individual users may opt for single-user licenses, while businesses requiring broader access may choose multi-user or enterprise licenses for cost-effective access to the report.
13. Are there any additional resources or data provided in the Isotonic Drinks Market report?
While the report offers comprehensive insights, it's advisable to review the specific contents or supplementary materials provided to ascertain if additional resources or data are available.
14. How can I stay updated on further developments or reports in the Isotonic Drinks Market?
To stay informed about further developments, trends, and reports in the Isotonic Drinks Market, consider subscribing to industry newsletters, following relevant companies and organizations, or regularly checking reputable industry news sources and publications.
Methodology
Step 1 - Identification of Relevant Samples Size from Population Database


Step 2 - Approaches for Defining Global Market Size (Value, Volume* & Price*)

Note*: In applicable scenarios
Step 3 - Data Sources
Primary Research
- Web Analytics
- Survey Reports
- Research Institute
- Latest Research Reports
- Opinion Leaders
Secondary Research
- Annual Reports
- White Paper
- Latest Press Release
- Industry Association
- Paid Database
- Investor Presentations

Step 4 - Data Triangulation
Involves using different sources of information in order to increase the validity of a study
These sources are likely to be stakeholders in a program - participants, other researchers, program staff, other community members, and so on.
Then we put all data in single framework & apply various statistical tools to find out the dynamic on the market.
During the analysis stage, feedback from the stakeholder groups would be compared to determine areas of agreement as well as areas of divergence


