
Key Insights
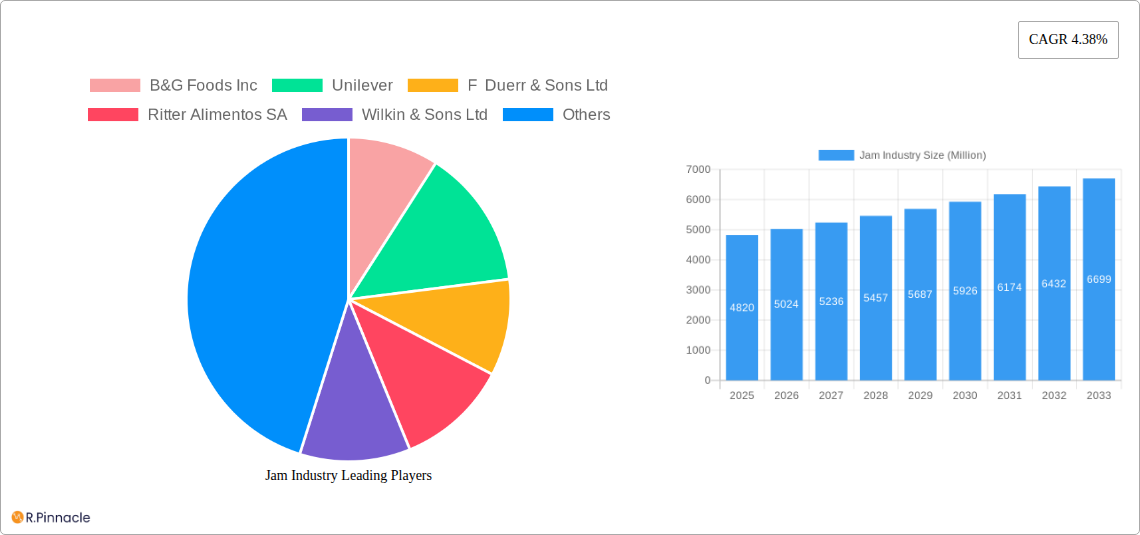
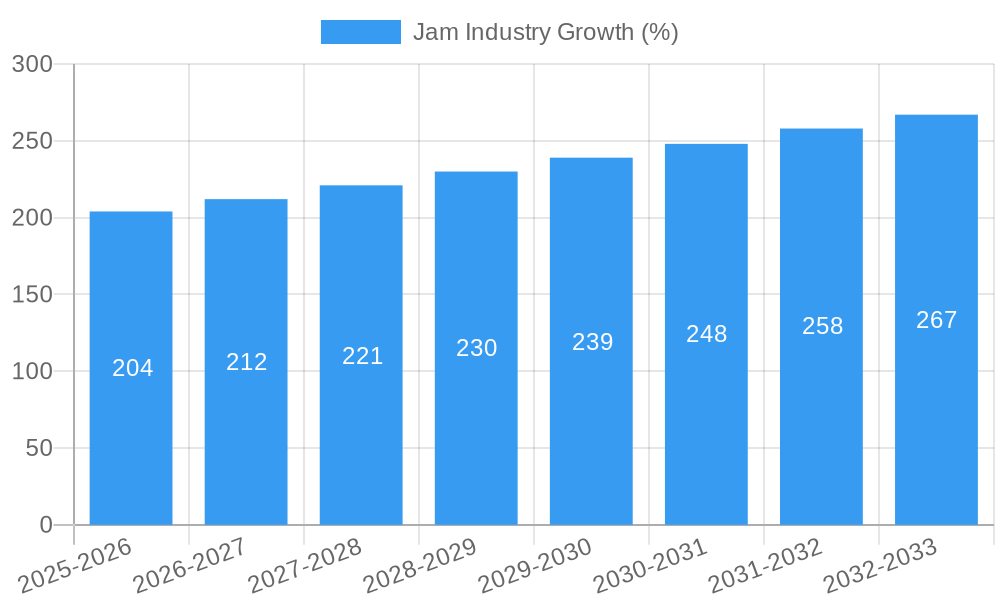
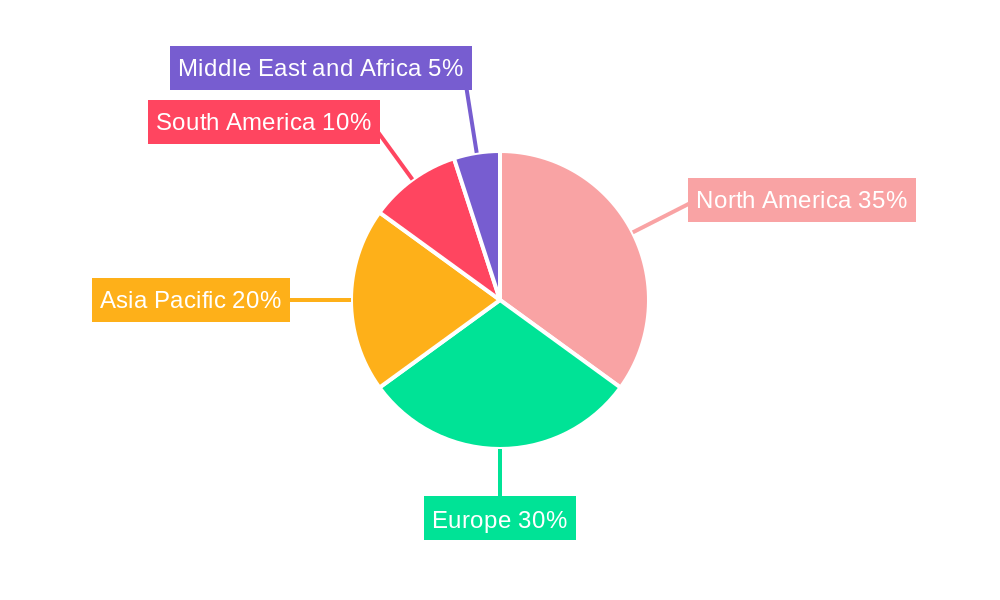
The global jam industry, valued at $4.82 billion in 2025, is projected to experience steady growth, driven by several key factors. Increased consumer demand for convenient breakfast options and the rising popularity of artisanal and gourmet jams are contributing to market expansion. Health-conscious consumers are also driving growth, with a focus on low-sugar and organic options. The market is segmented by product type (jams, jellies, marmalades, preserves) and distribution channels (supermarkets/hypermarkets, convenience stores, online retail, and others). Supermarkets and hypermarkets currently hold the largest market share, but online retail is experiencing rapid growth, fueled by increased e-commerce penetration and the convenience of home delivery. Geographic distribution shows strong performance in North America and Europe, with developing markets in Asia-Pacific exhibiting promising potential for future growth. Leading companies such as J.M. Smucker, Unilever, and Orkla ASA are investing in product innovation and expanding their distribution networks to maintain their market positions. While price fluctuations in raw materials pose a challenge, the industry's overall outlook remains positive, with a projected CAGR of 4.38% from 2025 to 2033. This growth trajectory is supported by ongoing product diversification, including the introduction of new flavors, functional ingredients, and sustainable packaging options.
The competitive landscape is characterized by a mix of large multinational corporations and smaller regional players. Major players are focused on strategic acquisitions, brand building, and global expansion to secure market share. The industry faces challenges such as fluctuating fruit prices and increasing consumer preference for healthier, natural alternatives. However, innovation in product formulation and packaging, along with strategic marketing efforts emphasizing the convenience and versatility of jams, will likely mitigate these challenges. The emergence of premium and specialty jams targeting discerning consumers further contributes to the market's positive growth outlook. Future growth will be influenced by factors such as changing consumer preferences, evolving distribution channels, and the impact of global economic conditions.
Jam Industry Market Report: 2019-2033
This comprehensive report provides an in-depth analysis of the global jam industry, offering invaluable insights for industry professionals, investors, and strategic decision-makers. With a study period spanning 2019-2033, a base year of 2025, and a forecast period of 2025-2033, this report delivers a complete picture of market trends, competitive dynamics, and future growth potential. The report’s analysis encompasses a market valued at Millions, covering key segments and prominent players.
Jam Industry Market Structure & Innovation Trends
This section analyzes the competitive landscape of the jam industry, examining market concentration, innovation drivers, regulatory influences, and market dynamics. We delve into mergers and acquisitions (M&A) activities, providing insights into deal values and their impact on market share. The report assesses the impact of product substitutes and evolving end-user demographics on market growth.
- Market Concentration: The global jam market exhibits a moderately concentrated structure, with a handful of major players holding significant market share. Precise market share data for each company (B&G Foods Inc, Unilever, F Duerr & Sons Ltd, Ritter Alimentos SA, Wilkin & Sons Ltd, Orkla ASA, The J M Smucker Company, Andros Group, Crofters Food Ltd, GD Foods) will be provided within the full report. xx Million is estimated to be the overall market value in 2025.
- Innovation Drivers: Health and wellness trends, particularly the demand for low-sugar, organic, and vegan options, are key drivers of innovation. Product diversification and premiumization strategies are also prevalent.
- Regulatory Framework: Food safety regulations and labeling requirements significantly impact the jam industry. Compliance costs and changing regulations pose both challenges and opportunities.
- M&A Activity: The report includes an analysis of significant M&A transactions in the jam industry during the historical period (2019-2024), detailing deal values and their strategic implications. xx Million is estimated to be the total value of M&A deals during this period.
Jam Industry Market Dynamics & Trends
This section explores the key factors driving market growth, including evolving consumer preferences, technological disruptions, and competitive dynamics. The report uses a comprehensive approach, analyzing various metrics such as Compound Annual Growth Rate (CAGR) and market penetration across various segments. The analysis focuses on the period from 2019 to 2033, projecting future market trends based on historical data and current market conditions. We will detail specific factors like the impact of changing consumer health consciousness, the rise of e-commerce, and the influence of global economic conditions on market demand. A detailed analysis of the CAGR and market penetration across different segments will be presented.
Dominant Regions & Segments in Jam Industry
This section identifies the leading geographical regions and product segments within the jam market. A detailed analysis considers both By Product Type (Jams and Jellies, Marmalade, Preserves) and By Distribution Channel (Supermarkets/Hypermarkets, Convenience Stores, Online Retail, Other Distribution Channels).
Dominant Regions: [Detailed analysis of dominant regions will be presented in the full report, including factors like economic growth, consumer preferences, and infrastructure.]
Dominant Segments: [Detailed analysis of dominant segments will be presented in the full report, including factors driving segment-specific growth.]
Key Drivers (By Region/Segment):
- Economic policies and consumer spending power.
- Infrastructure supporting efficient distribution.
- Local consumer preferences and dietary habits.
- Regulatory environment.
Jam Industry Product Innovations
This section summarizes recent product developments in the jam industry, highlighting innovative applications and their competitive advantages. The analysis focuses on technological trends influencing product design, production methods, and packaging solutions. The report analyzes the market fit of new products and their impact on consumer preferences.
Report Scope & Segmentation Analysis
This report provides a comprehensive segmentation analysis of the jam industry.
By Product Type:
- Jams and Jellies: [Growth projections, market size, and competitive dynamics for jams and jellies will be provided.]
- Marmalade: [Growth projections, market size, and competitive dynamics for marmalade will be provided.]
- Preserves: [Growth projections, market size, and competitive dynamics for preserves will be provided.]
By Distribution Channel:
- Supermarkets/Hypermarkets: [Growth projections, market size, and competitive dynamics for supermarket/hypermarket distribution will be provided.]
- Convenience Stores: [Growth projections, market size, and competitive dynamics for convenience store distribution will be provided.]
- Online Retail: [Growth projections, market size, and competitive dynamics for online retail distribution will be provided.]
- Other Distribution Channels: [Growth projections, market size, and competitive dynamics for other distribution channels will be provided.]
Key Drivers of Jam Industry Growth
The growth of the jam industry is driven by several factors:
- Health and Wellness Trends: The increasing demand for low-sugar, organic, and vegan options fuels innovation and market expansion.
- Economic Growth: Rising disposable incomes in emerging markets contribute to increased consumption of jam products.
- Favorable Regulatory Environment: Supportive government policies can promote the growth of the jam industry.
Challenges in the Jam Industry Sector
Several challenges hinder the growth of the jam industry:
- Fluctuating Raw Material Prices: Changes in the price of fruits and sugar can impact profitability.
- Intense Competition: The presence of numerous players creates competitive pressure.
- Stricter Regulations: Compliance with food safety and labeling regulations adds to operational costs.
Emerging Opportunities in Jam Industry
The jam industry presents several emerging opportunities:
- Premiumization: Offering high-quality, specialty jams caters to discerning consumers.
- E-commerce Expansion: Leveraging online platforms increases market reach.
- New Product Development: Innovation in flavors and functional ingredients attracts new consumers.
Leading Players in the Jam Industry Market
- B&G Foods Inc
- Unilever
- F Duerr & Sons Ltd
- Ritter Alimentos SA
- Wilkin & Sons Ltd
- Orkla ASA
- The J M Smucker Company
- Andros Group
- Crofters Food Ltd
- GD Foods
Key Developments in Jam Industry
- 2020: Jumel Jams launched a sugar-free jam range with stevia sweetener, gluten-free, and low-in-salt features, through online stores.
- 2020: The Skinny Food Co. expanded its #NotGuilty Jam range with two new low-calorie, low-sugar flavors (Orange Marmalade and Black Cherry).
Future Outlook for Jam Industry Market
The jam industry is poised for continued growth driven by health-conscious consumers seeking natural and functional products. Strategic investments in research and development, along with expansion into new markets and distribution channels, will be crucial for success. The market's future outlook is positive, with significant potential for expansion in both established and emerging markets.
Jam Industry Segmentation
-
1. Product Type
- 1.1. Jams and Jellies
- 1.2. Marmalade
- 1.3. Preserves
-
2. Distribution Channel
- 2.1. Supermarkets/Hypermarkets
- 2.2. Convenience Stores
- 2.3. Online Retail
- 2.4. Other Distribution Channels
Jam Industry Segmentation By Geography
-
1. North America
- 1.1. United States
- 1.2. Canada
- 1.3. Mexico
- 1.4. Rest of North America
-
2. Europe
- 2.1. United Kingdom
- 2.2. Germany
- 2.3. France
- 2.4. Spain
- 2.5. Italy
- 2.6. Russia
- 2.7. Rest of Europe
-
3. Asia Pacific
- 3.1. China
- 3.2. Japan
- 3.3. India
- 3.4. Australia
- 3.5. Rest of Asia Pacific
-
4. South America
- 4.1. Brazil
- 4.2. Argentina
- 4.3. Rest of South America
-
5. Middle East and Africa
- 5.1. Saudi Arabia
- 5.2. South Africa
- 5.3. Rest of Middle East and Africa
Jam Industry REPORT HIGHLIGHTS
| Aspects | Details |
|---|---|
| Study Period | 2019-2033 |
| Base Year | 2024 |
| Estimated Year | 2025 |
| Forecast Period | 2025-2033 |
| Historical Period | 2019-2024 |
| Growth Rate | CAGR of 4.38% from 2019-2033 |
| Segmentation |
|
Table of Contents
- 1. Introduction
- 1.1. Research Scope
- 1.2. Market Segmentation
- 1.3. Research Methodology
- 1.4. Definitions and Assumptions
- 2. Executive Summary
- 2.1. Introduction
- 3. Market Dynamics
- 3.1. Introduction
- 3.2. Market Drivers
- 3.2.1. Prevalence of Lactose Intolerance Driving the Market; Growing Influence of Healthy Lifestyle Trends and Rising Non-Traditional Users
- 3.3. Market Restrains
- 3.3.1. Wide Availability of Alternative Protein Sources
- 3.4. Market Trends
- 3.4.1. Demand for Clean-label and Reduced Sugar/Fat Spreads
- 4. Market Factor Analysis
- 4.1. Porters Five Forces
- 4.2. Supply/Value Chain
- 4.3. PESTEL analysis
- 4.4. Market Entropy
- 4.5. Patent/Trademark Analysis
- 5. Global Jam Industry Analysis, Insights and Forecast, 2019-2031
- 5.1. Market Analysis, Insights and Forecast - by Product Type
- 5.1.1. Jams and Jellies
- 5.1.2. Marmalade
- 5.1.3. Preserves
- 5.2. Market Analysis, Insights and Forecast - by Distribution Channel
- 5.2.1. Supermarkets/Hypermarkets
- 5.2.2. Convenience Stores
- 5.2.3. Online Retail
- 5.2.4. Other Distribution Channels
- 5.3. Market Analysis, Insights and Forecast - by Region
- 5.3.1. North America
- 5.3.2. Europe
- 5.3.3. Asia Pacific
- 5.3.4. South America
- 5.3.5. Middle East and Africa
- 5.1. Market Analysis, Insights and Forecast - by Product Type
- 6. North America Jam Industry Analysis, Insights and Forecast, 2019-2031
- 6.1. Market Analysis, Insights and Forecast - by Product Type
- 6.1.1. Jams and Jellies
- 6.1.2. Marmalade
- 6.1.3. Preserves
- 6.2. Market Analysis, Insights and Forecast - by Distribution Channel
- 6.2.1. Supermarkets/Hypermarkets
- 6.2.2. Convenience Stores
- 6.2.3. Online Retail
- 6.2.4. Other Distribution Channels
- 6.1. Market Analysis, Insights and Forecast - by Product Type
- 7. Europe Jam Industry Analysis, Insights and Forecast, 2019-2031
- 7.1. Market Analysis, Insights and Forecast - by Product Type
- 7.1.1. Jams and Jellies
- 7.1.2. Marmalade
- 7.1.3. Preserves
- 7.2. Market Analysis, Insights and Forecast - by Distribution Channel
- 7.2.1. Supermarkets/Hypermarkets
- 7.2.2. Convenience Stores
- 7.2.3. Online Retail
- 7.2.4. Other Distribution Channels
- 7.1. Market Analysis, Insights and Forecast - by Product Type
- 8. Asia Pacific Jam Industry Analysis, Insights and Forecast, 2019-2031
- 8.1. Market Analysis, Insights and Forecast - by Product Type
- 8.1.1. Jams and Jellies
- 8.1.2. Marmalade
- 8.1.3. Preserves
- 8.2. Market Analysis, Insights and Forecast - by Distribution Channel
- 8.2.1. Supermarkets/Hypermarkets
- 8.2.2. Convenience Stores
- 8.2.3. Online Retail
- 8.2.4. Other Distribution Channels
- 8.1. Market Analysis, Insights and Forecast - by Product Type
- 9. South America Jam Industry Analysis, Insights and Forecast, 2019-2031
- 9.1. Market Analysis, Insights and Forecast - by Product Type
- 9.1.1. Jams and Jellies
- 9.1.2. Marmalade
- 9.1.3. Preserves
- 9.2. Market Analysis, Insights and Forecast - by Distribution Channel
- 9.2.1. Supermarkets/Hypermarkets
- 9.2.2. Convenience Stores
- 9.2.3. Online Retail
- 9.2.4. Other Distribution Channels
- 9.1. Market Analysis, Insights and Forecast - by Product Type
- 10. Middle East and Africa Jam Industry Analysis, Insights and Forecast, 2019-2031
- 10.1. Market Analysis, Insights and Forecast - by Product Type
- 10.1.1. Jams and Jellies
- 10.1.2. Marmalade
- 10.1.3. Preserves
- 10.2. Market Analysis, Insights and Forecast - by Distribution Channel
- 10.2.1. Supermarkets/Hypermarkets
- 10.2.2. Convenience Stores
- 10.2.3. Online Retail
- 10.2.4. Other Distribution Channels
- 10.1. Market Analysis, Insights and Forecast - by Product Type
- 11. North America Jam Industry Analysis, Insights and Forecast, 2019-2031
- 11.1. Market Analysis, Insights and Forecast - By Country/Sub-region
- 11.1.1 United States
- 11.1.2 Canada
- 11.1.3 Mexico
- 11.1.4 Rest of North America
- 12. Europe Jam Industry Analysis, Insights and Forecast, 2019-2031
- 12.1. Market Analysis, Insights and Forecast - By Country/Sub-region
- 12.1.1 United Kingdom
- 12.1.2 Germany
- 12.1.3 France
- 12.1.4 Spain
- 12.1.5 Italy
- 12.1.6 Russia
- 12.1.7 Rest of Europe
- 13. Asia Pacific Jam Industry Analysis, Insights and Forecast, 2019-2031
- 13.1. Market Analysis, Insights and Forecast - By Country/Sub-region
- 13.1.1 China
- 13.1.2 Japan
- 13.1.3 India
- 13.1.4 Australia
- 13.1.5 Rest of Asia Pacific
- 14. South America Jam Industry Analysis, Insights and Forecast, 2019-2031
- 14.1. Market Analysis, Insights and Forecast - By Country/Sub-region
- 14.1.1 Brazil
- 14.1.2 Argentina
- 14.1.3 Rest of South America
- 15. Middle East and Africa Jam Industry Analysis, Insights and Forecast, 2019-2031
- 15.1. Market Analysis, Insights and Forecast - By Country/Sub-region
- 15.1.1 Saudi Arabia
- 15.1.2 South Africa
- 15.1.3 Rest of Middle East and Africa
- 16. Competitive Analysis
- 16.1. Global Market Share Analysis 2024
- 16.2. Company Profiles
- 16.2.1 B&G Foods Inc
- 16.2.1.1. Overview
- 16.2.1.2. Products
- 16.2.1.3. SWOT Analysis
- 16.2.1.4. Recent Developments
- 16.2.1.5. Financials (Based on Availability)
- 16.2.2 Unilever
- 16.2.2.1. Overview
- 16.2.2.2. Products
- 16.2.2.3. SWOT Analysis
- 16.2.2.4. Recent Developments
- 16.2.2.5. Financials (Based on Availability)
- 16.2.3 F Duerr & Sons Ltd
- 16.2.3.1. Overview
- 16.2.3.2. Products
- 16.2.3.3. SWOT Analysis
- 16.2.3.4. Recent Developments
- 16.2.3.5. Financials (Based on Availability)
- 16.2.4 Ritter Alimentos SA
- 16.2.4.1. Overview
- 16.2.4.2. Products
- 16.2.4.3. SWOT Analysis
- 16.2.4.4. Recent Developments
- 16.2.4.5. Financials (Based on Availability)
- 16.2.5 Wilkin & Sons Ltd
- 16.2.5.1. Overview
- 16.2.5.2. Products
- 16.2.5.3. SWOT Analysis
- 16.2.5.4. Recent Developments
- 16.2.5.5. Financials (Based on Availability)
- 16.2.6 Orkla ASA
- 16.2.6.1. Overview
- 16.2.6.2. Products
- 16.2.6.3. SWOT Analysis
- 16.2.6.4. Recent Developments
- 16.2.6.5. Financials (Based on Availability)
- 16.2.7 The J M Smucker Company
- 16.2.7.1. Overview
- 16.2.7.2. Products
- 16.2.7.3. SWOT Analysis
- 16.2.7.4. Recent Developments
- 16.2.7.5. Financials (Based on Availability)
- 16.2.8 Andros Group
- 16.2.8.1. Overview
- 16.2.8.2. Products
- 16.2.8.3. SWOT Analysis
- 16.2.8.4. Recent Developments
- 16.2.8.5. Financials (Based on Availability)
- 16.2.9 Crofters Food Ltd
- 16.2.9.1. Overview
- 16.2.9.2. Products
- 16.2.9.3. SWOT Analysis
- 16.2.9.4. Recent Developments
- 16.2.9.5. Financials (Based on Availability)
- 16.2.10 GD Foods *List Not Exhaustive
- 16.2.10.1. Overview
- 16.2.10.2. Products
- 16.2.10.3. SWOT Analysis
- 16.2.10.4. Recent Developments
- 16.2.10.5. Financials (Based on Availability)
- 16.2.1 B&G Foods Inc
List of Figures
- Figure 1: Global Jam Industry Revenue Breakdown (Million, %) by Region 2024 & 2032
- Figure 2: North America Jam Industry Revenue (Million), by Country 2024 & 2032
- Figure 3: North America Jam Industry Revenue Share (%), by Country 2024 & 2032
- Figure 4: Europe Jam Industry Revenue (Million), by Country 2024 & 2032
- Figure 5: Europe Jam Industry Revenue Share (%), by Country 2024 & 2032
- Figure 6: Asia Pacific Jam Industry Revenue (Million), by Country 2024 & 2032
- Figure 7: Asia Pacific Jam Industry Revenue Share (%), by Country 2024 & 2032
- Figure 8: South America Jam Industry Revenue (Million), by Country 2024 & 2032
- Figure 9: South America Jam Industry Revenue Share (%), by Country 2024 & 2032
- Figure 10: Middle East and Africa Jam Industry Revenue (Million), by Country 2024 & 2032
- Figure 11: Middle East and Africa Jam Industry Revenue Share (%), by Country 2024 & 2032
- Figure 12: North America Jam Industry Revenue (Million), by Product Type 2024 & 2032
- Figure 13: North America Jam Industry Revenue Share (%), by Product Type 2024 & 2032
- Figure 14: North America Jam Industry Revenue (Million), by Distribution Channel 2024 & 2032
- Figure 15: North America Jam Industry Revenue Share (%), by Distribution Channel 2024 & 2032
- Figure 16: North America Jam Industry Revenue (Million), by Country 2024 & 2032
- Figure 17: North America Jam Industry Revenue Share (%), by Country 2024 & 2032
- Figure 18: Europe Jam Industry Revenue (Million), by Product Type 2024 & 2032
- Figure 19: Europe Jam Industry Revenue Share (%), by Product Type 2024 & 2032
- Figure 20: Europe Jam Industry Revenue (Million), by Distribution Channel 2024 & 2032
- Figure 21: Europe Jam Industry Revenue Share (%), by Distribution Channel 2024 & 2032
- Figure 22: Europe Jam Industry Revenue (Million), by Country 2024 & 2032
- Figure 23: Europe Jam Industry Revenue Share (%), by Country 2024 & 2032
- Figure 24: Asia Pacific Jam Industry Revenue (Million), by Product Type 2024 & 2032
- Figure 25: Asia Pacific Jam Industry Revenue Share (%), by Product Type 2024 & 2032
- Figure 26: Asia Pacific Jam Industry Revenue (Million), by Distribution Channel 2024 & 2032
- Figure 27: Asia Pacific Jam Industry Revenue Share (%), by Distribution Channel 2024 & 2032
- Figure 28: Asia Pacific Jam Industry Revenue (Million), by Country 2024 & 2032
- Figure 29: Asia Pacific Jam Industry Revenue Share (%), by Country 2024 & 2032
- Figure 30: South America Jam Industry Revenue (Million), by Product Type 2024 & 2032
- Figure 31: South America Jam Industry Revenue Share (%), by Product Type 2024 & 2032
- Figure 32: South America Jam Industry Revenue (Million), by Distribution Channel 2024 & 2032
- Figure 33: South America Jam Industry Revenue Share (%), by Distribution Channel 2024 & 2032
- Figure 34: South America Jam Industry Revenue (Million), by Country 2024 & 2032
- Figure 35: South America Jam Industry Revenue Share (%), by Country 2024 & 2032
- Figure 36: Middle East and Africa Jam Industry Revenue (Million), by Product Type 2024 & 2032
- Figure 37: Middle East and Africa Jam Industry Revenue Share (%), by Product Type 2024 & 2032
- Figure 38: Middle East and Africa Jam Industry Revenue (Million), by Distribution Channel 2024 & 2032
- Figure 39: Middle East and Africa Jam Industry Revenue Share (%), by Distribution Channel 2024 & 2032
- Figure 40: Middle East and Africa Jam Industry Revenue (Million), by Country 2024 & 2032
- Figure 41: Middle East and Africa Jam Industry Revenue Share (%), by Country 2024 & 2032
List of Tables
- Table 1: Global Jam Industry Revenue Million Forecast, by Region 2019 & 2032
- Table 2: Global Jam Industry Revenue Million Forecast, by Product Type 2019 & 2032
- Table 3: Global Jam Industry Revenue Million Forecast, by Distribution Channel 2019 & 2032
- Table 4: Global Jam Industry Revenue Million Forecast, by Region 2019 & 2032
- Table 5: Global Jam Industry Revenue Million Forecast, by Country 2019 & 2032
- Table 6: United States Jam Industry Revenue (Million) Forecast, by Application 2019 & 2032
- Table 7: Canada Jam Industry Revenue (Million) Forecast, by Application 2019 & 2032
- Table 8: Mexico Jam Industry Revenue (Million) Forecast, by Application 2019 & 2032
- Table 9: Rest of North America Jam Industry Revenue (Million) Forecast, by Application 2019 & 2032
- Table 10: Global Jam Industry Revenue Million Forecast, by Country 2019 & 2032
- Table 11: United Kingdom Jam Industry Revenue (Million) Forecast, by Application 2019 & 2032
- Table 12: Germany Jam Industry Revenue (Million) Forecast, by Application 2019 & 2032
- Table 13: France Jam Industry Revenue (Million) Forecast, by Application 2019 & 2032
- Table 14: Spain Jam Industry Revenue (Million) Forecast, by Application 2019 & 2032
- Table 15: Italy Jam Industry Revenue (Million) Forecast, by Application 2019 & 2032
- Table 16: Russia Jam Industry Revenue (Million) Forecast, by Application 2019 & 2032
- Table 17: Rest of Europe Jam Industry Revenue (Million) Forecast, by Application 2019 & 2032
- Table 18: Global Jam Industry Revenue Million Forecast, by Country 2019 & 2032
- Table 19: China Jam Industry Revenue (Million) Forecast, by Application 2019 & 2032
- Table 20: Japan Jam Industry Revenue (Million) Forecast, by Application 2019 & 2032
- Table 21: India Jam Industry Revenue (Million) Forecast, by Application 2019 & 2032
- Table 22: Australia Jam Industry Revenue (Million) Forecast, by Application 2019 & 2032
- Table 23: Rest of Asia Pacific Jam Industry Revenue (Million) Forecast, by Application 2019 & 2032
- Table 24: Global Jam Industry Revenue Million Forecast, by Country 2019 & 2032
- Table 25: Brazil Jam Industry Revenue (Million) Forecast, by Application 2019 & 2032
- Table 26: Argentina Jam Industry Revenue (Million) Forecast, by Application 2019 & 2032
- Table 27: Rest of South America Jam Industry Revenue (Million) Forecast, by Application 2019 & 2032
- Table 28: Global Jam Industry Revenue Million Forecast, by Country 2019 & 2032
- Table 29: Saudi Arabia Jam Industry Revenue (Million) Forecast, by Application 2019 & 2032
- Table 30: South Africa Jam Industry Revenue (Million) Forecast, by Application 2019 & 2032
- Table 31: Rest of Middle East and Africa Jam Industry Revenue (Million) Forecast, by Application 2019 & 2032
- Table 32: Global Jam Industry Revenue Million Forecast, by Product Type 2019 & 2032
- Table 33: Global Jam Industry Revenue Million Forecast, by Distribution Channel 2019 & 2032
- Table 34: Global Jam Industry Revenue Million Forecast, by Country 2019 & 2032
- Table 35: United States Jam Industry Revenue (Million) Forecast, by Application 2019 & 2032
- Table 36: Canada Jam Industry Revenue (Million) Forecast, by Application 2019 & 2032
- Table 37: Mexico Jam Industry Revenue (Million) Forecast, by Application 2019 & 2032
- Table 38: Rest of North America Jam Industry Revenue (Million) Forecast, by Application 2019 & 2032
- Table 39: Global Jam Industry Revenue Million Forecast, by Product Type 2019 & 2032
- Table 40: Global Jam Industry Revenue Million Forecast, by Distribution Channel 2019 & 2032
- Table 41: Global Jam Industry Revenue Million Forecast, by Country 2019 & 2032
- Table 42: United Kingdom Jam Industry Revenue (Million) Forecast, by Application 2019 & 2032
- Table 43: Germany Jam Industry Revenue (Million) Forecast, by Application 2019 & 2032
- Table 44: France Jam Industry Revenue (Million) Forecast, by Application 2019 & 2032
- Table 45: Spain Jam Industry Revenue (Million) Forecast, by Application 2019 & 2032
- Table 46: Italy Jam Industry Revenue (Million) Forecast, by Application 2019 & 2032
- Table 47: Russia Jam Industry Revenue (Million) Forecast, by Application 2019 & 2032
- Table 48: Rest of Europe Jam Industry Revenue (Million) Forecast, by Application 2019 & 2032
- Table 49: Global Jam Industry Revenue Million Forecast, by Product Type 2019 & 2032
- Table 50: Global Jam Industry Revenue Million Forecast, by Distribution Channel 2019 & 2032
- Table 51: Global Jam Industry Revenue Million Forecast, by Country 2019 & 2032
- Table 52: China Jam Industry Revenue (Million) Forecast, by Application 2019 & 2032
- Table 53: Japan Jam Industry Revenue (Million) Forecast, by Application 2019 & 2032
- Table 54: India Jam Industry Revenue (Million) Forecast, by Application 2019 & 2032
- Table 55: Australia Jam Industry Revenue (Million) Forecast, by Application 2019 & 2032
- Table 56: Rest of Asia Pacific Jam Industry Revenue (Million) Forecast, by Application 2019 & 2032
- Table 57: Global Jam Industry Revenue Million Forecast, by Product Type 2019 & 2032
- Table 58: Global Jam Industry Revenue Million Forecast, by Distribution Channel 2019 & 2032
- Table 59: Global Jam Industry Revenue Million Forecast, by Country 2019 & 2032
- Table 60: Brazil Jam Industry Revenue (Million) Forecast, by Application 2019 & 2032
- Table 61: Argentina Jam Industry Revenue (Million) Forecast, by Application 2019 & 2032
- Table 62: Rest of South America Jam Industry Revenue (Million) Forecast, by Application 2019 & 2032
- Table 63: Global Jam Industry Revenue Million Forecast, by Product Type 2019 & 2032
- Table 64: Global Jam Industry Revenue Million Forecast, by Distribution Channel 2019 & 2032
- Table 65: Global Jam Industry Revenue Million Forecast, by Country 2019 & 2032
- Table 66: Saudi Arabia Jam Industry Revenue (Million) Forecast, by Application 2019 & 2032
- Table 67: South Africa Jam Industry Revenue (Million) Forecast, by Application 2019 & 2032
- Table 68: Rest of Middle East and Africa Jam Industry Revenue (Million) Forecast, by Application 2019 & 2032
Frequently Asked Questions
1. What is the projected Compound Annual Growth Rate (CAGR) of the Jam Industry?
The projected CAGR is approximately 4.38%.
2. Which companies are prominent players in the Jam Industry?
Key companies in the market include B&G Foods Inc, Unilever, F Duerr & Sons Ltd, Ritter Alimentos SA, Wilkin & Sons Ltd, Orkla ASA, The J M Smucker Company, Andros Group, Crofters Food Ltd, GD Foods *List Not Exhaustive.
3. What are the main segments of the Jam Industry?
The market segments include Product Type, Distribution Channel.
4. Can you provide details about the market size?
The market size is estimated to be USD 4.82 Million as of 2022.
5. What are some drivers contributing to market growth?
Prevalence of Lactose Intolerance Driving the Market; Growing Influence of Healthy Lifestyle Trends and Rising Non-Traditional Users.
6. What are the notable trends driving market growth?
Demand for Clean-label and Reduced Sugar/Fat Spreads.
7. Are there any restraints impacting market growth?
Wide Availability of Alternative Protein Sources.
8. Can you provide examples of recent developments in the market?
In 2020, Jumel Jams launched its sugar-free jams range through online stores. The range included four flavors of stevia sweetener, with gluten-free and low-in-salt features.
9. What pricing options are available for accessing the report?
Pricing options include single-user, multi-user, and enterprise licenses priced at USD 4750, USD 5250, and USD 8750 respectively.
10. Is the market size provided in terms of value or volume?
The market size is provided in terms of value, measured in Million.
11. Are there any specific market keywords associated with the report?
Yes, the market keyword associated with the report is "Jam Industry," which aids in identifying and referencing the specific market segment covered.
12. How do I determine which pricing option suits my needs best?
The pricing options vary based on user requirements and access needs. Individual users may opt for single-user licenses, while businesses requiring broader access may choose multi-user or enterprise licenses for cost-effective access to the report.
13. Are there any additional resources or data provided in the Jam Industry report?
While the report offers comprehensive insights, it's advisable to review the specific contents or supplementary materials provided to ascertain if additional resources or data are available.
14. How can I stay updated on further developments or reports in the Jam Industry?
To stay informed about further developments, trends, and reports in the Jam Industry, consider subscribing to industry newsletters, following relevant companies and organizations, or regularly checking reputable industry news sources and publications.
Methodology
Step 1 - Identification of Relevant Samples Size from Population Database


Step 2 - Approaches for Defining Global Market Size (Value, Volume* & Price*)

Note*: In applicable scenarios
Step 3 - Data Sources
Primary Research
- Web Analytics
- Survey Reports
- Research Institute
- Latest Research Reports
- Opinion Leaders
Secondary Research
- Annual Reports
- White Paper
- Latest Press Release
- Industry Association
- Paid Database
- Investor Presentations

Step 4 - Data Triangulation
Involves using different sources of information in order to increase the validity of a study
These sources are likely to be stakeholders in a program - participants, other researchers, program staff, other community members, and so on.
Then we put all data in single framework & apply various statistical tools to find out the dynamic on the market.
During the analysis stage, feedback from the stakeholder groups would be compared to determine areas of agreement as well as areas of divergence


