
Key Insights
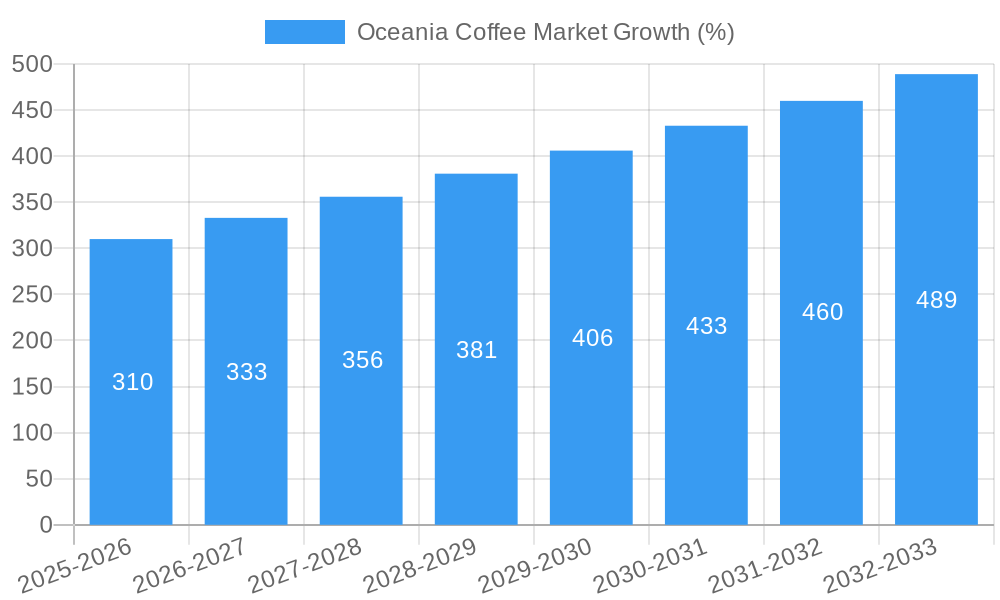
The Oceania coffee market, encompassing countries like Australia and New Zealand, presents a dynamic landscape characterized by robust growth and evolving consumer preferences. Driven by a strong coffee culture, rising disposable incomes, and the increasing popularity of specialty coffee, the market is experiencing significant expansion. The 6.20% CAGR indicates a consistent upward trajectory, projected to continue through 2033. Key segments within this market include whole-bean coffee, which maintains a strong presence due to its perceived higher quality and freshness, and ground coffee, catering to convenience-seeking consumers. The rapid growth of the specialty coffee segment fuels the demand for premium beans and innovative brewing methods. Instant coffee continues to hold a considerable market share, particularly among time-constrained consumers. Distribution channels are diversified, with both on-trade (cafes, restaurants) and off-trade (supermarkets, online retailers) sectors contributing significantly. Major players like Starbucks, Nestle, and local roasters compete fiercely, showcasing the market's maturity and competitive intensity. The Asia-Pacific region's influence is evident, with increasing imports of coffee beans from the region, impacting both pricing and product availability. The market faces challenges such as fluctuating coffee bean prices and concerns about sustainability and ethical sourcing, which are driving consumer demand for ethically-sourced and environmentally friendly products.
Growth in the Oceania coffee market is further fueled by the increasing adoption of coffee subscription services and the rise of artisanal coffee shops. These factors cater to the evolving consumer preference for high-quality, convenient, and ethically sourced coffee. The on-trade segment's growth is directly correlated with the popularity of cafes and coffee-centric social gatherings. While economic factors can influence consumer spending, the overall passion for coffee within Oceania ensures continued market expansion. This is also reflected in the increased diversification of coffee offerings, encompassing various roasts, brewing methods, and flavor profiles to cater to a wide spectrum of consumer preferences. The robust market is expected to see further innovation in packaging, branding, and product diversification, particularly in response to the growing focus on sustainability and transparency within the coffee supply chain.

Oceania Coffee Market Report: 2019-2033
This comprehensive report provides an in-depth analysis of the Oceania coffee market, offering invaluable insights for industry professionals, investors, and strategic planners. Covering the period from 2019 to 2033, with a focus on 2025, this report meticulously examines market dynamics, competitive landscapes, and future growth potential. The study incorporates detailed segmentation by product type (Whole-Bean, Ground Coffee, Instant Coffee, Others) and distribution channel (On-Trade, Off-Trade), providing a granular understanding of this dynamic market. The Oceania Coffee Market is projected to reach xx Million by 2033.
Oceania Coffee Market Structure & Innovation Trends
This section analyzes the market concentration, highlighting the market share of key players like Starbucks Coffee Company, Nestle SA, and Jacobs Douwe Egberts. We delve into innovation drivers, including consumer demand for sustainable and ethically sourced coffee, and the impact of regulatory frameworks on market activities. The report also examines the influence of product substitutes (e.g., tea, other beverages), end-user demographics (e.g., age, income), and mergers & acquisitions (M&A) activities, including deal values (xx Million in total M&A activity during 2019-2024).
- Market Concentration: Dominated by a few major players, with a combined market share of approximately xx%. Smaller, niche players cater to specific consumer segments.
- Innovation Drivers: Growing demand for specialty coffee, single-origin beans, and sustainable practices fuels innovation.
- Regulatory Frameworks: Food safety regulations and labeling requirements influence product development and market access.
- Product Substitutes: The market faces competition from tea, energy drinks, and other beverages.
- End-User Demographics: The market is driven by a diverse consumer base, with significant demand from younger generations and coffee enthusiasts.
- M&A Activity: Consolidation through mergers and acquisitions is expected to continue shaping the market landscape.
Oceania Coffee Market Dynamics & Trends
This section explores the key factors driving market growth, including rising disposable incomes, changing consumer preferences towards premium coffee, and the increasing popularity of specialty coffee shops. We analyze technological disruptions such as advancements in coffee roasting and brewing technologies, along with the impact of these changes on consumer behavior and market competition. The report provides a detailed analysis of market growth drivers, technological advancements, evolving consumer preferences (e.g., health consciousness, ethical sourcing), and the competitive dynamics within the Oceania coffee market. The CAGR for the forecast period (2025-2033) is estimated at xx%, with a market penetration rate of xx% by 2033.
Dominant Regions & Segments in Oceania Coffee Market
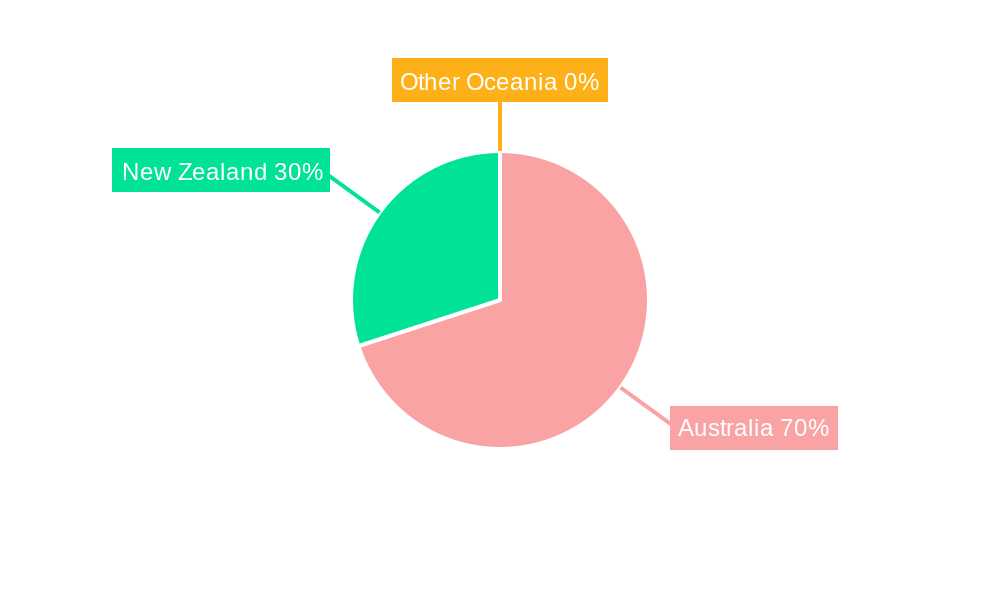
This section identifies the leading regions and segments within the Oceania coffee market. Australia and New Zealand are expected to remain dominant markets due to high coffee consumption per capita. Within product types, ground coffee holds the largest market share, followed by whole bean and instant coffee. The off-trade channel (supermarkets, retail stores) dominates distribution, but the on-trade (cafes, restaurants) is also experiencing substantial growth.
- Key Drivers for Australia and New Zealand: High disposable incomes, café culture, and strong consumer preference for premium coffee.
- Ground Coffee Dominance: Convenience, affordability, and widespread availability drive high demand.
- Off-Trade Channel Leadership: Extensive retail distribution networks contribute to market share.
- On-Trade Channel Growth: The increasing popularity of specialty coffee shops fuels on-trade expansion.
Oceania Coffee Market Product Innovations
Recent innovations focus on sustainable sourcing, single-origin beans, and convenient brewing methods like single-serve pods and ready-to-drink (RTD) coffee. Technological advancements in roasting and extraction techniques improve the quality and taste profile of coffee, while meeting growing consumer demand for convenience and sustainability. These trends contribute to higher margins and brand loyalty, driving competitive advantage.
Report Scope & Segmentation Analysis
This report segments the Oceania coffee market by product type (whole-bean, ground, instant, others) and distribution channel (on-trade, off-trade). Each segment is analyzed in terms of growth projections, market size (in Millions), and competitive dynamics. The ground coffee segment is projected to maintain its leading position, driven by its affordability and convenience. The on-trade segment is anticipated to experience significant growth, fueled by increasing consumer spending on premium coffee experiences.
- By Product Type: Market sizes and growth rates are detailed for each segment.
- By Distribution Channel: Market dynamics and competitive analysis for on-trade and off-trade are provided.
Key Drivers of Oceania Coffee Market Growth
Several key factors drive Oceania coffee market growth: rising disposable incomes, increasing consumer preference for premium coffee, and the growing popularity of specialty coffee shops and cafes. Furthermore, technological advancements in coffee production and brewing methods enhance product quality and variety, and government initiatives supporting the coffee industry further stimulate market growth.
Challenges in the Oceania Coffee Market Sector
The Oceania coffee market faces challenges such as fluctuating coffee bean prices, intense competition from established and emerging players, and evolving consumer preferences. Supply chain disruptions and sustainability concerns also pose significant challenges, requiring innovative approaches to mitigate their impact.
Emerging Opportunities in Oceania Coffee Market
Emerging opportunities include the growing demand for sustainable and ethically sourced coffee, the increasing popularity of plant-based milk alternatives, and the expansion of ready-to-drink (RTD) coffee options. Innovation in brewing technologies and the development of new coffee-based products create exciting prospects for market expansion.
Leading Players in the Oceania Coffee Market Market
- Starbucks Coffee Company
- Moccona
- Nestle SA
- Seven Miles
- Altura Coffee Co
- Cantarella Bros Pty Ltd
- Ospina Coffee
- McDonald's
- Jacobs Douwe Egberts
- Kokako Organic Coffee Roaster
Key Developments in Oceania Coffee Market Industry
- 2022-03: Nestle SA launches a new line of sustainable coffee.
- 2023-10: Starbucks Coffee Company opens new stores in key Oceania markets.
- 2024-06: Jacobs Douwe Egberts introduces innovative single-serve coffee pods. (Further details on specific events would be included in the full report)
Future Outlook for Oceania Coffee Market Market
The Oceania coffee market is poised for continued growth, driven by increasing coffee consumption, evolving consumer preferences, and ongoing innovation. Strategic partnerships, product diversification, and a focus on sustainability will be crucial for players to capitalize on emerging opportunities and maintain a competitive edge. The market is expected to maintain strong growth in the next decade.
Oceania Coffee Market Segmentation
-
1. Product Type
- 1.1. Whole-Bean
- 1.2. Ground Coffee
- 1.3. Instant Coffee
- 1.4. Others
-
2. Distribution Channel
- 2.1. On-Trade
-
2.2. Off-Trade
- 2.2.1. Supermarket/Hypermarket
- 2.2.2. Convenience Stores
- 2.2.3. Specialist Retailers
- 2.2.4. Others
Oceania Coffee Market Segmentation By Geography
-
1. North America
- 1.1. United States
- 1.2. Canada
- 1.3. Mexico
-
2. South America
- 2.1. Brazil
- 2.2. Argentina
- 2.3. Rest of South America
-
3. Europe
- 3.1. United Kingdom
- 3.2. Germany
- 3.3. France
- 3.4. Italy
- 3.5. Spain
- 3.6. Russia
- 3.7. Benelux
- 3.8. Nordics
- 3.9. Rest of Europe
-
4. Middle East & Africa
- 4.1. Turkey
- 4.2. Israel
- 4.3. GCC
- 4.4. North Africa
- 4.5. South Africa
- 4.6. Rest of Middle East & Africa
-
5. Asia Pacific
- 5.1. China
- 5.2. India
- 5.3. Japan
- 5.4. South Korea
- 5.5. ASEAN
- 5.6. Oceania
- 5.7. Rest of Asia Pacific
Oceania Coffee Market REPORT HIGHLIGHTS
| Aspects | Details |
|---|---|
| Study Period | 2019-2033 |
| Base Year | 2024 |
| Estimated Year | 2025 |
| Forecast Period | 2025-2033 |
| Historical Period | 2019-2024 |
| Growth Rate | CAGR of 6.20% from 2019-2033 |
| Segmentation |
|
Table of Contents
- 1. Introduction
- 1.1. Research Scope
- 1.2. Market Segmentation
- 1.3. Research Methodology
- 1.4. Definitions and Assumptions
- 2. Executive Summary
- 2.1. Introduction
- 3. Market Dynamics
- 3.1. Introduction
- 3.2. Market Drivers
- 3.2.1. Escalating Concern for Quality Drinking Water; Strategic Investment by the Key Players
- 3.3. Market Restrains
- 3.3.1. Need for Stringent Regulatory Landscape
- 3.4. Market Trends
- 3.4.1. Rising Demand For Instant Coffee in The Region
- 4. Market Factor Analysis
- 4.1. Porters Five Forces
- 4.2. Supply/Value Chain
- 4.3. PESTEL analysis
- 4.4. Market Entropy
- 4.5. Patent/Trademark Analysis
- 5. Global Oceania Coffee Market Analysis, Insights and Forecast, 2019-2031
- 5.1. Market Analysis, Insights and Forecast - by Product Type
- 5.1.1. Whole-Bean
- 5.1.2. Ground Coffee
- 5.1.3. Instant Coffee
- 5.1.4. Others
- 5.2. Market Analysis, Insights and Forecast - by Distribution Channel
- 5.2.1. On-Trade
- 5.2.2. Off-Trade
- 5.2.2.1. Supermarket/Hypermarket
- 5.2.2.2. Convenience Stores
- 5.2.2.3. Specialist Retailers
- 5.2.2.4. Others
- 5.3. Market Analysis, Insights and Forecast - by Region
- 5.3.1. North America
- 5.3.2. South America
- 5.3.3. Europe
- 5.3.4. Middle East & Africa
- 5.3.5. Asia Pacific
- 5.1. Market Analysis, Insights and Forecast - by Product Type
- 6. North America Oceania Coffee Market Analysis, Insights and Forecast, 2019-2031
- 6.1. Market Analysis, Insights and Forecast - by Product Type
- 6.1.1. Whole-Bean
- 6.1.2. Ground Coffee
- 6.1.3. Instant Coffee
- 6.1.4. Others
- 6.2. Market Analysis, Insights and Forecast - by Distribution Channel
- 6.2.1. On-Trade
- 6.2.2. Off-Trade
- 6.2.2.1. Supermarket/Hypermarket
- 6.2.2.2. Convenience Stores
- 6.2.2.3. Specialist Retailers
- 6.2.2.4. Others
- 6.1. Market Analysis, Insights and Forecast - by Product Type
- 7. South America Oceania Coffee Market Analysis, Insights and Forecast, 2019-2031
- 7.1. Market Analysis, Insights and Forecast - by Product Type
- 7.1.1. Whole-Bean
- 7.1.2. Ground Coffee
- 7.1.3. Instant Coffee
- 7.1.4. Others
- 7.2. Market Analysis, Insights and Forecast - by Distribution Channel
- 7.2.1. On-Trade
- 7.2.2. Off-Trade
- 7.2.2.1. Supermarket/Hypermarket
- 7.2.2.2. Convenience Stores
- 7.2.2.3. Specialist Retailers
- 7.2.2.4. Others
- 7.1. Market Analysis, Insights and Forecast - by Product Type
- 8. Europe Oceania Coffee Market Analysis, Insights and Forecast, 2019-2031
- 8.1. Market Analysis, Insights and Forecast - by Product Type
- 8.1.1. Whole-Bean
- 8.1.2. Ground Coffee
- 8.1.3. Instant Coffee
- 8.1.4. Others
- 8.2. Market Analysis, Insights and Forecast - by Distribution Channel
- 8.2.1. On-Trade
- 8.2.2. Off-Trade
- 8.2.2.1. Supermarket/Hypermarket
- 8.2.2.2. Convenience Stores
- 8.2.2.3. Specialist Retailers
- 8.2.2.4. Others
- 8.1. Market Analysis, Insights and Forecast - by Product Type
- 9. Middle East & Africa Oceania Coffee Market Analysis, Insights and Forecast, 2019-2031
- 9.1. Market Analysis, Insights and Forecast - by Product Type
- 9.1.1. Whole-Bean
- 9.1.2. Ground Coffee
- 9.1.3. Instant Coffee
- 9.1.4. Others
- 9.2. Market Analysis, Insights and Forecast - by Distribution Channel
- 9.2.1. On-Trade
- 9.2.2. Off-Trade
- 9.2.2.1. Supermarket/Hypermarket
- 9.2.2.2. Convenience Stores
- 9.2.2.3. Specialist Retailers
- 9.2.2.4. Others
- 9.1. Market Analysis, Insights and Forecast - by Product Type
- 10. Asia Pacific Oceania Coffee Market Analysis, Insights and Forecast, 2019-2031
- 10.1. Market Analysis, Insights and Forecast - by Product Type
- 10.1.1. Whole-Bean
- 10.1.2. Ground Coffee
- 10.1.3. Instant Coffee
- 10.1.4. Others
- 10.2. Market Analysis, Insights and Forecast - by Distribution Channel
- 10.2.1. On-Trade
- 10.2.2. Off-Trade
- 10.2.2.1. Supermarket/Hypermarket
- 10.2.2.2. Convenience Stores
- 10.2.2.3. Specialist Retailers
- 10.2.2.4. Others
- 10.1. Market Analysis, Insights and Forecast - by Product Type
- 11. India Oceania Coffee Market Analysis, Insights and Forecast, 2019-2031
- 12. China Oceania Coffee Market Analysis, Insights and Forecast, 2019-2031
- 13. Japan Oceania Coffee Market Analysis, Insights and Forecast, 2019-2031
- 14. Australia Oceania Coffee Market Analysis, Insights and Forecast, 2019-2031
- 15. Rest of Asia Pacific Oceania Coffee Market Analysis, Insights and Forecast, 2019-2031
- 16. Competitive Analysis
- 16.1. Global Market Share Analysis 2024
- 16.2. Company Profiles
- 16.2.1 Starbucks Coffee Company
- 16.2.1.1. Overview
- 16.2.1.2. Products
- 16.2.1.3. SWOT Analysis
- 16.2.1.4. Recent Developments
- 16.2.1.5. Financials (Based on Availability)
- 16.2.2 Moccona
- 16.2.2.1. Overview
- 16.2.2.2. Products
- 16.2.2.3. SWOT Analysis
- 16.2.2.4. Recent Developments
- 16.2.2.5. Financials (Based on Availability)
- 16.2.3 Nestle SA
- 16.2.3.1. Overview
- 16.2.3.2. Products
- 16.2.3.3. SWOT Analysis
- 16.2.3.4. Recent Developments
- 16.2.3.5. Financials (Based on Availability)
- 16.2.4 Seven Miles
- 16.2.4.1. Overview
- 16.2.4.2. Products
- 16.2.4.3. SWOT Analysis
- 16.2.4.4. Recent Developments
- 16.2.4.5. Financials (Based on Availability)
- 16.2.5 Altura Coffee Co
- 16.2.5.1. Overview
- 16.2.5.2. Products
- 16.2.5.3. SWOT Analysis
- 16.2.5.4. Recent Developments
- 16.2.5.5. Financials (Based on Availability)
- 16.2.6 Cantarella Bros Pty Ltd
- 16.2.6.1. Overview
- 16.2.6.2. Products
- 16.2.6.3. SWOT Analysis
- 16.2.6.4. Recent Developments
- 16.2.6.5. Financials (Based on Availability)
- 16.2.7 Ospina Coffee
- 16.2.7.1. Overview
- 16.2.7.2. Products
- 16.2.7.3. SWOT Analysis
- 16.2.7.4. Recent Developments
- 16.2.7.5. Financials (Based on Availability)
- 16.2.8 McDonald's
- 16.2.8.1. Overview
- 16.2.8.2. Products
- 16.2.8.3. SWOT Analysis
- 16.2.8.4. Recent Developments
- 16.2.8.5. Financials (Based on Availability)
- 16.2.9 Jacobs Douwe Egberts
- 16.2.9.1. Overview
- 16.2.9.2. Products
- 16.2.9.3. SWOT Analysis
- 16.2.9.4. Recent Developments
- 16.2.9.5. Financials (Based on Availability)
- 16.2.10 Kokako Organic Coffee Roaster
- 16.2.10.1. Overview
- 16.2.10.2. Products
- 16.2.10.3. SWOT Analysis
- 16.2.10.4. Recent Developments
- 16.2.10.5. Financials (Based on Availability)
- 16.2.1 Starbucks Coffee Company
List of Figures
- Figure 1: Global Oceania Coffee Market Revenue Breakdown (Million, %) by Region 2024 & 2032
- Figure 2: Asia Pacific Oceania Coffee Market Revenue (Million), by Country 2024 & 2032
- Figure 3: Asia Pacific Oceania Coffee Market Revenue Share (%), by Country 2024 & 2032
- Figure 4: North America Oceania Coffee Market Revenue (Million), by Product Type 2024 & 2032
- Figure 5: North America Oceania Coffee Market Revenue Share (%), by Product Type 2024 & 2032
- Figure 6: North America Oceania Coffee Market Revenue (Million), by Distribution Channel 2024 & 2032
- Figure 7: North America Oceania Coffee Market Revenue Share (%), by Distribution Channel 2024 & 2032
- Figure 8: North America Oceania Coffee Market Revenue (Million), by Country 2024 & 2032
- Figure 9: North America Oceania Coffee Market Revenue Share (%), by Country 2024 & 2032
- Figure 10: South America Oceania Coffee Market Revenue (Million), by Product Type 2024 & 2032
- Figure 11: South America Oceania Coffee Market Revenue Share (%), by Product Type 2024 & 2032
- Figure 12: South America Oceania Coffee Market Revenue (Million), by Distribution Channel 2024 & 2032
- Figure 13: South America Oceania Coffee Market Revenue Share (%), by Distribution Channel 2024 & 2032
- Figure 14: South America Oceania Coffee Market Revenue (Million), by Country 2024 & 2032
- Figure 15: South America Oceania Coffee Market Revenue Share (%), by Country 2024 & 2032
- Figure 16: Europe Oceania Coffee Market Revenue (Million), by Product Type 2024 & 2032
- Figure 17: Europe Oceania Coffee Market Revenue Share (%), by Product Type 2024 & 2032
- Figure 18: Europe Oceania Coffee Market Revenue (Million), by Distribution Channel 2024 & 2032
- Figure 19: Europe Oceania Coffee Market Revenue Share (%), by Distribution Channel 2024 & 2032
- Figure 20: Europe Oceania Coffee Market Revenue (Million), by Country 2024 & 2032
- Figure 21: Europe Oceania Coffee Market Revenue Share (%), by Country 2024 & 2032
- Figure 22: Middle East & Africa Oceania Coffee Market Revenue (Million), by Product Type 2024 & 2032
- Figure 23: Middle East & Africa Oceania Coffee Market Revenue Share (%), by Product Type 2024 & 2032
- Figure 24: Middle East & Africa Oceania Coffee Market Revenue (Million), by Distribution Channel 2024 & 2032
- Figure 25: Middle East & Africa Oceania Coffee Market Revenue Share (%), by Distribution Channel 2024 & 2032
- Figure 26: Middle East & Africa Oceania Coffee Market Revenue (Million), by Country 2024 & 2032
- Figure 27: Middle East & Africa Oceania Coffee Market Revenue Share (%), by Country 2024 & 2032
- Figure 28: Asia Pacific Oceania Coffee Market Revenue (Million), by Product Type 2024 & 2032
- Figure 29: Asia Pacific Oceania Coffee Market Revenue Share (%), by Product Type 2024 & 2032
- Figure 30: Asia Pacific Oceania Coffee Market Revenue (Million), by Distribution Channel 2024 & 2032
- Figure 31: Asia Pacific Oceania Coffee Market Revenue Share (%), by Distribution Channel 2024 & 2032
- Figure 32: Asia Pacific Oceania Coffee Market Revenue (Million), by Country 2024 & 2032
- Figure 33: Asia Pacific Oceania Coffee Market Revenue Share (%), by Country 2024 & 2032
List of Tables
- Table 1: Global Oceania Coffee Market Revenue Million Forecast, by Region 2019 & 2032
- Table 2: Global Oceania Coffee Market Revenue Million Forecast, by Product Type 2019 & 2032
- Table 3: Global Oceania Coffee Market Revenue Million Forecast, by Distribution Channel 2019 & 2032
- Table 4: Global Oceania Coffee Market Revenue Million Forecast, by Region 2019 & 2032
- Table 5: Global Oceania Coffee Market Revenue Million Forecast, by Country 2019 & 2032
- Table 6: India Oceania Coffee Market Revenue (Million) Forecast, by Application 2019 & 2032
- Table 7: China Oceania Coffee Market Revenue (Million) Forecast, by Application 2019 & 2032
- Table 8: Japan Oceania Coffee Market Revenue (Million) Forecast, by Application 2019 & 2032
- Table 9: Australia Oceania Coffee Market Revenue (Million) Forecast, by Application 2019 & 2032
- Table 10: Rest of Asia Pacific Oceania Coffee Market Revenue (Million) Forecast, by Application 2019 & 2032
- Table 11: Global Oceania Coffee Market Revenue Million Forecast, by Product Type 2019 & 2032
- Table 12: Global Oceania Coffee Market Revenue Million Forecast, by Distribution Channel 2019 & 2032
- Table 13: Global Oceania Coffee Market Revenue Million Forecast, by Country 2019 & 2032
- Table 14: United States Oceania Coffee Market Revenue (Million) Forecast, by Application 2019 & 2032
- Table 15: Canada Oceania Coffee Market Revenue (Million) Forecast, by Application 2019 & 2032
- Table 16: Mexico Oceania Coffee Market Revenue (Million) Forecast, by Application 2019 & 2032
- Table 17: Global Oceania Coffee Market Revenue Million Forecast, by Product Type 2019 & 2032
- Table 18: Global Oceania Coffee Market Revenue Million Forecast, by Distribution Channel 2019 & 2032
- Table 19: Global Oceania Coffee Market Revenue Million Forecast, by Country 2019 & 2032
- Table 20: Brazil Oceania Coffee Market Revenue (Million) Forecast, by Application 2019 & 2032
- Table 21: Argentina Oceania Coffee Market Revenue (Million) Forecast, by Application 2019 & 2032
- Table 22: Rest of South America Oceania Coffee Market Revenue (Million) Forecast, by Application 2019 & 2032
- Table 23: Global Oceania Coffee Market Revenue Million Forecast, by Product Type 2019 & 2032
- Table 24: Global Oceania Coffee Market Revenue Million Forecast, by Distribution Channel 2019 & 2032
- Table 25: Global Oceania Coffee Market Revenue Million Forecast, by Country 2019 & 2032
- Table 26: United Kingdom Oceania Coffee Market Revenue (Million) Forecast, by Application 2019 & 2032
- Table 27: Germany Oceania Coffee Market Revenue (Million) Forecast, by Application 2019 & 2032
- Table 28: France Oceania Coffee Market Revenue (Million) Forecast, by Application 2019 & 2032
- Table 29: Italy Oceania Coffee Market Revenue (Million) Forecast, by Application 2019 & 2032
- Table 30: Spain Oceania Coffee Market Revenue (Million) Forecast, by Application 2019 & 2032
- Table 31: Russia Oceania Coffee Market Revenue (Million) Forecast, by Application 2019 & 2032
- Table 32: Benelux Oceania Coffee Market Revenue (Million) Forecast, by Application 2019 & 2032
- Table 33: Nordics Oceania Coffee Market Revenue (Million) Forecast, by Application 2019 & 2032
- Table 34: Rest of Europe Oceania Coffee Market Revenue (Million) Forecast, by Application 2019 & 2032
- Table 35: Global Oceania Coffee Market Revenue Million Forecast, by Product Type 2019 & 2032
- Table 36: Global Oceania Coffee Market Revenue Million Forecast, by Distribution Channel 2019 & 2032
- Table 37: Global Oceania Coffee Market Revenue Million Forecast, by Country 2019 & 2032
- Table 38: Turkey Oceania Coffee Market Revenue (Million) Forecast, by Application 2019 & 2032
- Table 39: Israel Oceania Coffee Market Revenue (Million) Forecast, by Application 2019 & 2032
- Table 40: GCC Oceania Coffee Market Revenue (Million) Forecast, by Application 2019 & 2032
- Table 41: North Africa Oceania Coffee Market Revenue (Million) Forecast, by Application 2019 & 2032
- Table 42: South Africa Oceania Coffee Market Revenue (Million) Forecast, by Application 2019 & 2032
- Table 43: Rest of Middle East & Africa Oceania Coffee Market Revenue (Million) Forecast, by Application 2019 & 2032
- Table 44: Global Oceania Coffee Market Revenue Million Forecast, by Product Type 2019 & 2032
- Table 45: Global Oceania Coffee Market Revenue Million Forecast, by Distribution Channel 2019 & 2032
- Table 46: Global Oceania Coffee Market Revenue Million Forecast, by Country 2019 & 2032
- Table 47: China Oceania Coffee Market Revenue (Million) Forecast, by Application 2019 & 2032
- Table 48: India Oceania Coffee Market Revenue (Million) Forecast, by Application 2019 & 2032
- Table 49: Japan Oceania Coffee Market Revenue (Million) Forecast, by Application 2019 & 2032
- Table 50: South Korea Oceania Coffee Market Revenue (Million) Forecast, by Application 2019 & 2032
- Table 51: ASEAN Oceania Coffee Market Revenue (Million) Forecast, by Application 2019 & 2032
- Table 52: Oceania Oceania Coffee Market Revenue (Million) Forecast, by Application 2019 & 2032
- Table 53: Rest of Asia Pacific Oceania Coffee Market Revenue (Million) Forecast, by Application 2019 & 2032
Frequently Asked Questions
1. What is the projected Compound Annual Growth Rate (CAGR) of the Oceania Coffee Market?
The projected CAGR is approximately 6.20%.
2. Which companies are prominent players in the Oceania Coffee Market?
Key companies in the market include Starbucks Coffee Company, Moccona, Nestle SA, Seven Miles, Altura Coffee Co, Cantarella Bros Pty Ltd, Ospina Coffee, McDonald's, Jacobs Douwe Egberts, Kokako Organic Coffee Roaster.
3. What are the main segments of the Oceania Coffee Market?
The market segments include Product Type, Distribution Channel.
4. Can you provide details about the market size?
The market size is estimated to be USD XX Million as of 2022.
5. What are some drivers contributing to market growth?
Escalating Concern for Quality Drinking Water; Strategic Investment by the Key Players.
6. What are the notable trends driving market growth?
Rising Demand For Instant Coffee in The Region.
7. Are there any restraints impacting market growth?
Need for Stringent Regulatory Landscape.
8. Can you provide examples of recent developments in the market?
N/A
9. What pricing options are available for accessing the report?
Pricing options include single-user, multi-user, and enterprise licenses priced at USD 3800, USD 4500, and USD 5800 respectively.
10. Is the market size provided in terms of value or volume?
The market size is provided in terms of value, measured in Million.
11. Are there any specific market keywords associated with the report?
Yes, the market keyword associated with the report is "Oceania Coffee Market," which aids in identifying and referencing the specific market segment covered.
12. How do I determine which pricing option suits my needs best?
The pricing options vary based on user requirements and access needs. Individual users may opt for single-user licenses, while businesses requiring broader access may choose multi-user or enterprise licenses for cost-effective access to the report.
13. Are there any additional resources or data provided in the Oceania Coffee Market report?
While the report offers comprehensive insights, it's advisable to review the specific contents or supplementary materials provided to ascertain if additional resources or data are available.
14. How can I stay updated on further developments or reports in the Oceania Coffee Market?
To stay informed about further developments, trends, and reports in the Oceania Coffee Market, consider subscribing to industry newsletters, following relevant companies and organizations, or regularly checking reputable industry news sources and publications.
Methodology
Step 1 - Identification of Relevant Samples Size from Population Database


Step 2 - Approaches for Defining Global Market Size (Value, Volume* & Price*)

Note*: In applicable scenarios
Step 3 - Data Sources
Primary Research
- Web Analytics
- Survey Reports
- Research Institute
- Latest Research Reports
- Opinion Leaders
Secondary Research
- Annual Reports
- White Paper
- Latest Press Release
- Industry Association
- Paid Database
- Investor Presentations

Step 4 - Data Triangulation
Involves using different sources of information in order to increase the validity of a study
These sources are likely to be stakeholders in a program - participants, other researchers, program staff, other community members, and so on.
Then we put all data in single framework & apply various statistical tools to find out the dynamic on the market.
During the analysis stage, feedback from the stakeholder groups would be compared to determine areas of agreement as well as areas of divergence


