
Key Insights
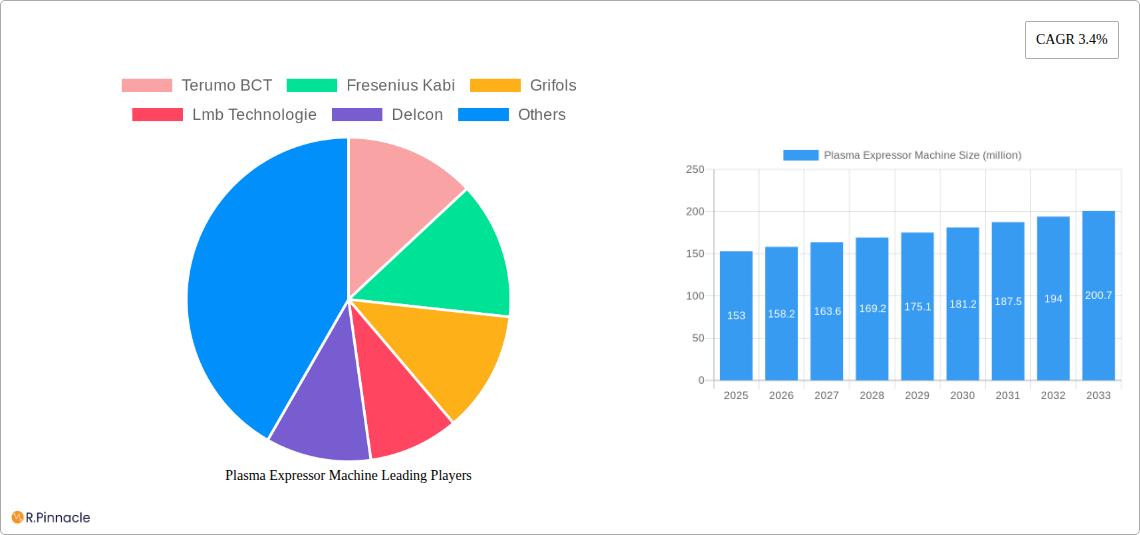
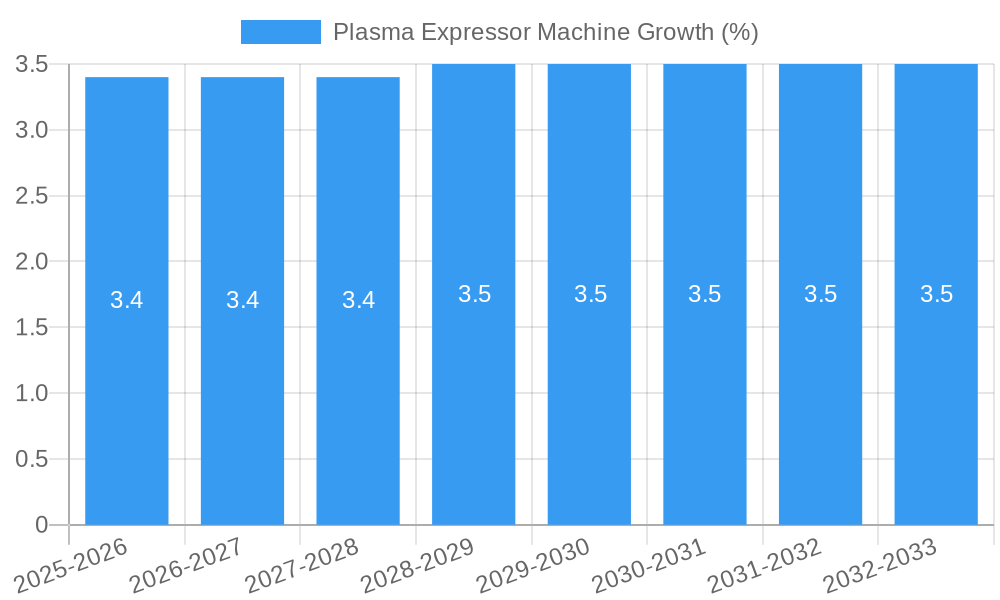
The global Plasma Expressor Machine market is poised for steady growth, projected to reach a valuation of USD 153 million with a Compound Annual Growth Rate (CAGR) of 3.4% during the forecast period of 2025-2033. This sustained expansion is primarily driven by the increasing prevalence of blood disorders, the growing demand for plasma-derived therapeutics, and the continuous advancements in medical technology. Hospitals and blood centers represent the dominant application segments, accounting for a significant share of the market due to their critical role in plasma collection and processing. The market is witnessing a shift towards automatic plasma expressors, driven by their superior efficiency, accuracy, and reduced risk of human error compared to manual counterparts. These advanced systems are crucial for meeting the escalating need for high-quality plasma in transfusion medicine and the production of life-saving therapies.
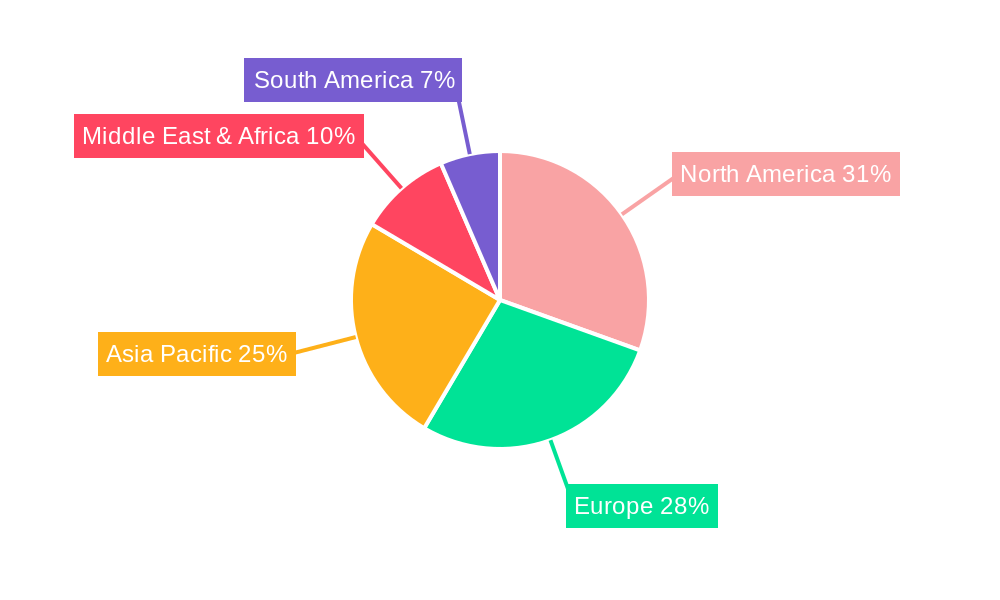
Emerging trends such as the development of integrated plasma processing systems, the focus on improving donor comfort and safety, and the expansion of plasma collection networks in developing economies are further fueling market growth. While the market demonstrates robust potential, certain restraints such as the high initial cost of advanced automated systems and stringent regulatory approvals for medical devices can pose challenges. Geographically, North America and Europe are expected to lead the market, owing to well-established healthcare infrastructures, high healthcare expenditure, and a strong presence of key market players. However, the Asia Pacific region is anticipated to exhibit the fastest growth, propelled by increasing healthcare investments, a rising awareness of blood donation benefits, and a growing demand for plasma-based products. Key players like Terumo BCT, Fresenius Kabi, and Grifols are actively engaged in product innovation and strategic collaborations to capture a larger market share.
Comprehensive Report: Plasma Expressor Machine Market Analysis 2019-2033
This in-depth report provides a detailed analysis of the global Plasma Expressor Machine market, offering actionable insights for industry stakeholders. Covering the historical period from 2019 to 2024, the base year of 2025, and extending through a forecast period to 2033, this study delivers a robust understanding of market dynamics, innovations, and future trajectories. The report leverages extensive data to pinpoint high-ranking keywords and deliver a reader-centric experience for professionals in the medical device and biotechnology sectors.
Plasma Expressor Machine Market Structure & Innovation Trends
The global Plasma Expressor Machine market exhibits a moderately consolidated structure, with key players like Terumo BCT, Fresenius Kabi, and Grifols holding significant market share. Innovation is primarily driven by advancements in automation, precision control, and data management capabilities, aimed at enhancing efficiency and safety in blood component processing. Regulatory frameworks from bodies such as the FDA and EMA significantly influence product development and market entry, ensuring adherence to stringent quality and safety standards. Product substitutes are limited, with manual methods offering a lower-cost alternative but lacking the throughput and consistency of automated systems. End-user demographics are predominantly healthcare institutions and blood collection agencies, with a growing interest from specialized research facilities. Mergers and acquisitions (M&A) activities are observed, with estimated deal values in the multi-million dollar range, indicating strategic consolidation and expansion efforts by leading companies. For instance, recent M&A activities in the sector have been valued in the range of \$50 million to \$150 million, aimed at acquiring innovative technologies or expanding market reach.
Plasma Expressor Machine Market Dynamics & Trends
The Plasma Expressor Machine market is poised for robust growth, driven by a confluence of factors including the increasing prevalence of chronic diseases requiring blood transfusions, a rising global demand for plasma-derived therapies, and the continuous technological evolution of blood processing equipment. The market penetration of plasma expressor machines is steadily increasing as healthcare providers recognize their indispensable role in optimizing blood collection and processing workflows. The Compound Annual Growth Rate (CAGR) is projected to be approximately 6.5% over the forecast period. Technological disruptions are primarily focused on developing more sophisticated automated systems that offer enhanced precision, reduced processing times, and integrated data logging for improved traceability and quality control. Consumer preferences are shifting towards user-friendly interfaces, reduced maintenance requirements, and cost-effective solutions that deliver high-volume processing capabilities. Competitive dynamics are characterized by intense R&D efforts to differentiate through innovative features and a focus on building strong distribution networks. The growing emphasis on patient safety and the demand for higher quality blood products are also significant market drivers. Furthermore, the increasing adoption of single-use components in medical devices is influencing the design and functionality of plasma expressor machines, aiming to minimize contamination risks and simplify operational procedures. The expanding global blood supply chain infrastructure also contributes to the market's upward trajectory.
Dominant Regions & Segments in Plasma Expressor Machine
North America currently dominates the global Plasma Expressor Machine market, primarily driven by the advanced healthcare infrastructure, high prevalence of blood-related disorders, and substantial investments in medical technology in countries like the United States and Canada. The region's strong emphasis on research and development and the presence of leading plasma processing centers contribute significantly to its leading position.
Application Dominance:
- Hospitals: Hospitals represent the largest application segment due to their extensive need for blood products for surgical procedures, trauma care, and chronic disease management. The increasing volume of complex surgeries and the growing demand for autologous blood transfusions further bolster this segment. Economic policies promoting healthcare access and investments in hospital infrastructure are key drivers.
- Blood Centers: Blood centers are another crucial segment, responsible for collecting, processing, and distributing blood components. The continuous need to meet the demand for blood products for transfusions and plasma-derived therapies makes this segment a significant contributor. Government initiatives supporting blood donation drives and public health campaigns play a vital role.
- Others: This segment includes research institutions, diagnostic laboratories, and specialized therapeutic centers. While smaller in volume compared to hospitals and blood centers, it showcases high growth potential due to emerging research applications and niche therapeutic needs.
Type Dominance:
- Automatic Plasma Expressor: Automatic plasma expressors are increasingly dominating the market due to their superior efficiency, precision, and capacity for high-volume processing. Technological advancements in automation, coupled with a focus on minimizing human error, have propelled their adoption. The high initial investment is often offset by long-term operational benefits.
- Manual Plasma Expressor: Manual plasma expressors, while still present in certain settings due to cost considerations or specific low-volume needs, are gradually being phased out in favor of automated solutions. Their market share is expected to decline as technological advancements make automated systems more accessible and cost-effective.
Plasma Expressor Machine Product Innovations
Recent product innovations in the Plasma Expressor Machine market are centered on enhancing automation, improving user interface design, and integrating advanced data analytics. Companies are developing machines with greater precision in component separation, offering customizable processing parameters to meet diverse clinical needs. The competitive advantage lies in providing solutions that reduce processing time, minimize waste, and ensure optimal yield of plasma components. Technological trends are leaning towards smart devices with remote monitoring capabilities and AI-driven performance optimization.
Report Scope & Segmentation Analysis
This report segmentations encompass the entire Plasma Expressor Machine market.
- Application: Hospitals: This segment is projected to witness substantial growth, driven by increased surgical volumes and the rising demand for blood products. Market size is estimated to be in the range of \$500 million to \$700 million, with a projected CAGR of 7.0%.
- Application: Blood Centers: Blood centers are a cornerstone of the market, with expected growth fueled by public health initiatives and the continuous need for blood donations. Market size is estimated to be around \$400 million to \$600 million, with a CAGR of 6.5%.
- Application: Others: This niche segment, including research and specialized therapeutic centers, is anticipated to exhibit the highest growth rate, albeit from a smaller base. Market size is estimated between \$50 million to \$100 million, with a projected CAGR of 8.0%.
- Type: Manual Plasma Expressor: The market share for manual expressors is expected to contract, driven by the increasing preference for automated systems. Market size is estimated to be around \$100 million to \$200 million, with a declining CAGR.
- Type: Automatic Plasma Expressor: This segment will continue its dominance, with significant growth anticipated due to technological advancements and increasing adoption across healthcare settings. Market size is estimated to be between \$850 million to \$1.1 billion, with a robust CAGR of 7.5%.
Key Drivers of Plasma Expressor Machine Growth
The growth of the Plasma Expressor Machine market is propelled by several key factors. Technologically, advancements in automation and precision engineering are leading to more efficient and reliable machines. Economically, the increasing global healthcare expenditure and the rising demand for plasma-derived therapies are significant drivers. Regulatory factors, such as stringent quality control mandates for blood products, also encourage the adoption of advanced processing equipment. Furthermore, a growing awareness of the importance of safe and efficient blood component utilization in patient care is a substantial growth accelerator. The increasing prevalence of chronic diseases that require blood transfusions also plays a crucial role.
Challenges in the Plasma Expressor Machine Sector
Despite the promising growth, the Plasma Expressor Machine sector faces several challenges. Regulatory hurdles, particularly the lengthy approval processes for new medical devices in various regions, can impede market entry. Supply chain disruptions, as evidenced in recent global events, can impact the availability of critical components and raw materials, leading to production delays and increased costs. Intense competitive pressures among established players and emerging manufacturers necessitate continuous innovation and cost optimization. High initial capital investment for advanced automated systems can also be a barrier for smaller healthcare facilities or in developing economies.
Emerging Opportunities in Plasma Expressor Machine
Emerging opportunities in the Plasma Expressor Machine market are abundant. The growing demand for plasma-derived therapies for rare diseases and autoimmune disorders presents a significant avenue for growth. Advancements in artificial intelligence and machine learning offer opportunities for developing "smart" plasma expressor machines with predictive maintenance capabilities and enhanced operational efficiency. The expansion of healthcare infrastructure in emerging economies, particularly in Asia and Africa, creates new markets for these essential medical devices. Furthermore, the development of more compact and portable plasma expressor machines could cater to decentralized blood collection efforts and emergency response scenarios.
Leading Players in the Plasma Expressor Machine Market
- Terumo BCT
- Fresenius Kabi
- Grifols
- Lmb Technologie
- Delcon
- JMS
- Bioelettronica
- Demophorius Healthcare
- Macopharma
- BMS K Group
- Nigale
- BIOBASE
- Weigao Group
- Meditech Technologies
- Labtop Instruments
- Suzhou Medical Instrument
Key Developments in Plasma Expressor Machine Industry
- 2023: Launch of next-generation automated plasma expressor with enhanced AI-driven process optimization.
- 2023: Acquisition of a key technology provider by a major player to strengthen its R&D capabilities in precision plasma separation.
- 2022: Introduction of a new line of plasma expressors featuring integrated data analytics and cloud connectivity.
- 2021: Significant investment in expanding manufacturing capacity for plasma expressor machines to meet growing global demand.
- 2020: Development of more ergonomic and user-friendly manual plasma expressor models for specific niche applications.
- 2019: Introduction of advanced safety features and contamination control mechanisms in automatic plasma expressor systems.
Future Outlook for Plasma Expressor Machine Market
The future outlook for the Plasma Expressor Machine market is exceptionally bright, fueled by ongoing technological innovation and the ever-increasing global need for plasma-derived products and efficient blood component processing. The market is expected to witness sustained growth driven by the expansion of personalized medicine, the rising incidence of blood disorders, and proactive government initiatives aimed at strengthening blood supply chains. Strategic collaborations and market expansions into underserved regions will further accelerate this growth trajectory. The focus on developing sustainable and cost-effective solutions will also be a critical determinant of future success, ensuring wider accessibility and adoption across diverse healthcare ecosystems.
Plasma Expressor Machine Segmentation
-
1. Application
- 1.1. Hospitals
- 1.2. Blood Centers
- 1.3. Others
-
2. Type
- 2.1. Manual Plasma Expressor
- 2.2. Automatic Plasma Expressor
Plasma Expressor Machine Segmentation By Geography
-
1. North America
- 1.1. United States
- 1.2. Canada
- 1.3. Mexico
-
2. South America
- 2.1. Brazil
- 2.2. Argentina
- 2.3. Rest of South America
-
3. Europe
- 3.1. United Kingdom
- 3.2. Germany
- 3.3. France
- 3.4. Italy
- 3.5. Spain
- 3.6. Russia
- 3.7. Benelux
- 3.8. Nordics
- 3.9. Rest of Europe
-
4. Middle East & Africa
- 4.1. Turkey
- 4.2. Israel
- 4.3. GCC
- 4.4. North Africa
- 4.5. South Africa
- 4.6. Rest of Middle East & Africa
-
5. Asia Pacific
- 5.1. China
- 5.2. India
- 5.3. Japan
- 5.4. South Korea
- 5.5. ASEAN
- 5.6. Oceania
- 5.7. Rest of Asia Pacific
Plasma Expressor Machine REPORT HIGHLIGHTS
| Aspects | Details |
|---|---|
| Study Period | 2019-2033 |
| Base Year | 2024 |
| Estimated Year | 2025 |
| Forecast Period | 2025-2033 |
| Historical Period | 2019-2024 |
| Growth Rate | CAGR of 3.4% from 2019-2033 |
| Segmentation |
|
Table of Contents
- 1. Introduction
- 1.1. Research Scope
- 1.2. Market Segmentation
- 1.3. Research Methodology
- 1.4. Definitions and Assumptions
- 2. Executive Summary
- 2.1. Introduction
- 3. Market Dynamics
- 3.1. Introduction
- 3.2. Market Drivers
- 3.3. Market Restrains
- 3.4. Market Trends
- 4. Market Factor Analysis
- 4.1. Porters Five Forces
- 4.2. Supply/Value Chain
- 4.3. PESTEL analysis
- 4.4. Market Entropy
- 4.5. Patent/Trademark Analysis
- 5. Global Plasma Expressor Machine Analysis, Insights and Forecast, 2019-2031
- 5.1. Market Analysis, Insights and Forecast - by Application
- 5.1.1. Hospitals
- 5.1.2. Blood Centers
- 5.1.3. Others
- 5.2. Market Analysis, Insights and Forecast - by Type
- 5.2.1. Manual Plasma Expressor
- 5.2.2. Automatic Plasma Expressor
- 5.3. Market Analysis, Insights and Forecast - by Region
- 5.3.1. North America
- 5.3.2. South America
- 5.3.3. Europe
- 5.3.4. Middle East & Africa
- 5.3.5. Asia Pacific
- 5.1. Market Analysis, Insights and Forecast - by Application
- 6. North America Plasma Expressor Machine Analysis, Insights and Forecast, 2019-2031
- 6.1. Market Analysis, Insights and Forecast - by Application
- 6.1.1. Hospitals
- 6.1.2. Blood Centers
- 6.1.3. Others
- 6.2. Market Analysis, Insights and Forecast - by Type
- 6.2.1. Manual Plasma Expressor
- 6.2.2. Automatic Plasma Expressor
- 6.1. Market Analysis, Insights and Forecast - by Application
- 7. South America Plasma Expressor Machine Analysis, Insights and Forecast, 2019-2031
- 7.1. Market Analysis, Insights and Forecast - by Application
- 7.1.1. Hospitals
- 7.1.2. Blood Centers
- 7.1.3. Others
- 7.2. Market Analysis, Insights and Forecast - by Type
- 7.2.1. Manual Plasma Expressor
- 7.2.2. Automatic Plasma Expressor
- 7.1. Market Analysis, Insights and Forecast - by Application
- 8. Europe Plasma Expressor Machine Analysis, Insights and Forecast, 2019-2031
- 8.1. Market Analysis, Insights and Forecast - by Application
- 8.1.1. Hospitals
- 8.1.2. Blood Centers
- 8.1.3. Others
- 8.2. Market Analysis, Insights and Forecast - by Type
- 8.2.1. Manual Plasma Expressor
- 8.2.2. Automatic Plasma Expressor
- 8.1. Market Analysis, Insights and Forecast - by Application
- 9. Middle East & Africa Plasma Expressor Machine Analysis, Insights and Forecast, 2019-2031
- 9.1. Market Analysis, Insights and Forecast - by Application
- 9.1.1. Hospitals
- 9.1.2. Blood Centers
- 9.1.3. Others
- 9.2. Market Analysis, Insights and Forecast - by Type
- 9.2.1. Manual Plasma Expressor
- 9.2.2. Automatic Plasma Expressor
- 9.1. Market Analysis, Insights and Forecast - by Application
- 10. Asia Pacific Plasma Expressor Machine Analysis, Insights and Forecast, 2019-2031
- 10.1. Market Analysis, Insights and Forecast - by Application
- 10.1.1. Hospitals
- 10.1.2. Blood Centers
- 10.1.3. Others
- 10.2. Market Analysis, Insights and Forecast - by Type
- 10.2.1. Manual Plasma Expressor
- 10.2.2. Automatic Plasma Expressor
- 10.1. Market Analysis, Insights and Forecast - by Application
- 11. Competitive Analysis
- 11.1. Global Market Share Analysis 2024
- 11.2. Company Profiles
- 11.2.1 Terumo BCT
- 11.2.1.1. Overview
- 11.2.1.2. Products
- 11.2.1.3. SWOT Analysis
- 11.2.1.4. Recent Developments
- 11.2.1.5. Financials (Based on Availability)
- 11.2.2 Fresenius Kabi
- 11.2.2.1. Overview
- 11.2.2.2. Products
- 11.2.2.3. SWOT Analysis
- 11.2.2.4. Recent Developments
- 11.2.2.5. Financials (Based on Availability)
- 11.2.3 Grifols
- 11.2.3.1. Overview
- 11.2.3.2. Products
- 11.2.3.3. SWOT Analysis
- 11.2.3.4. Recent Developments
- 11.2.3.5. Financials (Based on Availability)
- 11.2.4 Lmb Technologie
- 11.2.4.1. Overview
- 11.2.4.2. Products
- 11.2.4.3. SWOT Analysis
- 11.2.4.4. Recent Developments
- 11.2.4.5. Financials (Based on Availability)
- 11.2.5 Delcon
- 11.2.5.1. Overview
- 11.2.5.2. Products
- 11.2.5.3. SWOT Analysis
- 11.2.5.4. Recent Developments
- 11.2.5.5. Financials (Based on Availability)
- 11.2.6 JMS
- 11.2.6.1. Overview
- 11.2.6.2. Products
- 11.2.6.3. SWOT Analysis
- 11.2.6.4. Recent Developments
- 11.2.6.5. Financials (Based on Availability)
- 11.2.7 Bioelettronica
- 11.2.7.1. Overview
- 11.2.7.2. Products
- 11.2.7.3. SWOT Analysis
- 11.2.7.4. Recent Developments
- 11.2.7.5. Financials (Based on Availability)
- 11.2.8 Demophorius Healthcare
- 11.2.8.1. Overview
- 11.2.8.2. Products
- 11.2.8.3. SWOT Analysis
- 11.2.8.4. Recent Developments
- 11.2.8.5. Financials (Based on Availability)
- 11.2.9 Macopharma
- 11.2.9.1. Overview
- 11.2.9.2. Products
- 11.2.9.3. SWOT Analysis
- 11.2.9.4. Recent Developments
- 11.2.9.5. Financials (Based on Availability)
- 11.2.10 BMS K Group
- 11.2.10.1. Overview
- 11.2.10.2. Products
- 11.2.10.3. SWOT Analysis
- 11.2.10.4. Recent Developments
- 11.2.10.5. Financials (Based on Availability)
- 11.2.11 Nigale
- 11.2.11.1. Overview
- 11.2.11.2. Products
- 11.2.11.3. SWOT Analysis
- 11.2.11.4. Recent Developments
- 11.2.11.5. Financials (Based on Availability)
- 11.2.12 BIOBASE
- 11.2.12.1. Overview
- 11.2.12.2. Products
- 11.2.12.3. SWOT Analysis
- 11.2.12.4. Recent Developments
- 11.2.12.5. Financials (Based on Availability)
- 11.2.13 Weigao Group
- 11.2.13.1. Overview
- 11.2.13.2. Products
- 11.2.13.3. SWOT Analysis
- 11.2.13.4. Recent Developments
- 11.2.13.5. Financials (Based on Availability)
- 11.2.14 Meditech Technologies
- 11.2.14.1. Overview
- 11.2.14.2. Products
- 11.2.14.3. SWOT Analysis
- 11.2.14.4. Recent Developments
- 11.2.14.5. Financials (Based on Availability)
- 11.2.15 Labtop Instruments
- 11.2.15.1. Overview
- 11.2.15.2. Products
- 11.2.15.3. SWOT Analysis
- 11.2.15.4. Recent Developments
- 11.2.15.5. Financials (Based on Availability)
- 11.2.16 Suzhou Medical Instrument
- 11.2.16.1. Overview
- 11.2.16.2. Products
- 11.2.16.3. SWOT Analysis
- 11.2.16.4. Recent Developments
- 11.2.16.5. Financials (Based on Availability)
- 11.2.1 Terumo BCT
List of Figures
- Figure 1: Global Plasma Expressor Machine Revenue Breakdown (million, %) by Region 2024 & 2032
- Figure 2: Global Plasma Expressor Machine Volume Breakdown (K, %) by Region 2024 & 2032
- Figure 3: North America Plasma Expressor Machine Revenue (million), by Application 2024 & 2032
- Figure 4: North America Plasma Expressor Machine Volume (K), by Application 2024 & 2032
- Figure 5: North America Plasma Expressor Machine Revenue Share (%), by Application 2024 & 2032
- Figure 6: North America Plasma Expressor Machine Volume Share (%), by Application 2024 & 2032
- Figure 7: North America Plasma Expressor Machine Revenue (million), by Type 2024 & 2032
- Figure 8: North America Plasma Expressor Machine Volume (K), by Type 2024 & 2032
- Figure 9: North America Plasma Expressor Machine Revenue Share (%), by Type 2024 & 2032
- Figure 10: North America Plasma Expressor Machine Volume Share (%), by Type 2024 & 2032
- Figure 11: North America Plasma Expressor Machine Revenue (million), by Country 2024 & 2032
- Figure 12: North America Plasma Expressor Machine Volume (K), by Country 2024 & 2032
- Figure 13: North America Plasma Expressor Machine Revenue Share (%), by Country 2024 & 2032
- Figure 14: North America Plasma Expressor Machine Volume Share (%), by Country 2024 & 2032
- Figure 15: South America Plasma Expressor Machine Revenue (million), by Application 2024 & 2032
- Figure 16: South America Plasma Expressor Machine Volume (K), by Application 2024 & 2032
- Figure 17: South America Plasma Expressor Machine Revenue Share (%), by Application 2024 & 2032
- Figure 18: South America Plasma Expressor Machine Volume Share (%), by Application 2024 & 2032
- Figure 19: South America Plasma Expressor Machine Revenue (million), by Type 2024 & 2032
- Figure 20: South America Plasma Expressor Machine Volume (K), by Type 2024 & 2032
- Figure 21: South America Plasma Expressor Machine Revenue Share (%), by Type 2024 & 2032
- Figure 22: South America Plasma Expressor Machine Volume Share (%), by Type 2024 & 2032
- Figure 23: South America Plasma Expressor Machine Revenue (million), by Country 2024 & 2032
- Figure 24: South America Plasma Expressor Machine Volume (K), by Country 2024 & 2032
- Figure 25: South America Plasma Expressor Machine Revenue Share (%), by Country 2024 & 2032
- Figure 26: South America Plasma Expressor Machine Volume Share (%), by Country 2024 & 2032
- Figure 27: Europe Plasma Expressor Machine Revenue (million), by Application 2024 & 2032
- Figure 28: Europe Plasma Expressor Machine Volume (K), by Application 2024 & 2032
- Figure 29: Europe Plasma Expressor Machine Revenue Share (%), by Application 2024 & 2032
- Figure 30: Europe Plasma Expressor Machine Volume Share (%), by Application 2024 & 2032
- Figure 31: Europe Plasma Expressor Machine Revenue (million), by Type 2024 & 2032
- Figure 32: Europe Plasma Expressor Machine Volume (K), by Type 2024 & 2032
- Figure 33: Europe Plasma Expressor Machine Revenue Share (%), by Type 2024 & 2032
- Figure 34: Europe Plasma Expressor Machine Volume Share (%), by Type 2024 & 2032
- Figure 35: Europe Plasma Expressor Machine Revenue (million), by Country 2024 & 2032
- Figure 36: Europe Plasma Expressor Machine Volume (K), by Country 2024 & 2032
- Figure 37: Europe Plasma Expressor Machine Revenue Share (%), by Country 2024 & 2032
- Figure 38: Europe Plasma Expressor Machine Volume Share (%), by Country 2024 & 2032
- Figure 39: Middle East & Africa Plasma Expressor Machine Revenue (million), by Application 2024 & 2032
- Figure 40: Middle East & Africa Plasma Expressor Machine Volume (K), by Application 2024 & 2032
- Figure 41: Middle East & Africa Plasma Expressor Machine Revenue Share (%), by Application 2024 & 2032
- Figure 42: Middle East & Africa Plasma Expressor Machine Volume Share (%), by Application 2024 & 2032
- Figure 43: Middle East & Africa Plasma Expressor Machine Revenue (million), by Type 2024 & 2032
- Figure 44: Middle East & Africa Plasma Expressor Machine Volume (K), by Type 2024 & 2032
- Figure 45: Middle East & Africa Plasma Expressor Machine Revenue Share (%), by Type 2024 & 2032
- Figure 46: Middle East & Africa Plasma Expressor Machine Volume Share (%), by Type 2024 & 2032
- Figure 47: Middle East & Africa Plasma Expressor Machine Revenue (million), by Country 2024 & 2032
- Figure 48: Middle East & Africa Plasma Expressor Machine Volume (K), by Country 2024 & 2032
- Figure 49: Middle East & Africa Plasma Expressor Machine Revenue Share (%), by Country 2024 & 2032
- Figure 50: Middle East & Africa Plasma Expressor Machine Volume Share (%), by Country 2024 & 2032
- Figure 51: Asia Pacific Plasma Expressor Machine Revenue (million), by Application 2024 & 2032
- Figure 52: Asia Pacific Plasma Expressor Machine Volume (K), by Application 2024 & 2032
- Figure 53: Asia Pacific Plasma Expressor Machine Revenue Share (%), by Application 2024 & 2032
- Figure 54: Asia Pacific Plasma Expressor Machine Volume Share (%), by Application 2024 & 2032
- Figure 55: Asia Pacific Plasma Expressor Machine Revenue (million), by Type 2024 & 2032
- Figure 56: Asia Pacific Plasma Expressor Machine Volume (K), by Type 2024 & 2032
- Figure 57: Asia Pacific Plasma Expressor Machine Revenue Share (%), by Type 2024 & 2032
- Figure 58: Asia Pacific Plasma Expressor Machine Volume Share (%), by Type 2024 & 2032
- Figure 59: Asia Pacific Plasma Expressor Machine Revenue (million), by Country 2024 & 2032
- Figure 60: Asia Pacific Plasma Expressor Machine Volume (K), by Country 2024 & 2032
- Figure 61: Asia Pacific Plasma Expressor Machine Revenue Share (%), by Country 2024 & 2032
- Figure 62: Asia Pacific Plasma Expressor Machine Volume Share (%), by Country 2024 & 2032
List of Tables
- Table 1: Global Plasma Expressor Machine Revenue million Forecast, by Region 2019 & 2032
- Table 2: Global Plasma Expressor Machine Volume K Forecast, by Region 2019 & 2032
- Table 3: Global Plasma Expressor Machine Revenue million Forecast, by Application 2019 & 2032
- Table 4: Global Plasma Expressor Machine Volume K Forecast, by Application 2019 & 2032
- Table 5: Global Plasma Expressor Machine Revenue million Forecast, by Type 2019 & 2032
- Table 6: Global Plasma Expressor Machine Volume K Forecast, by Type 2019 & 2032
- Table 7: Global Plasma Expressor Machine Revenue million Forecast, by Region 2019 & 2032
- Table 8: Global Plasma Expressor Machine Volume K Forecast, by Region 2019 & 2032
- Table 9: Global Plasma Expressor Machine Revenue million Forecast, by Application 2019 & 2032
- Table 10: Global Plasma Expressor Machine Volume K Forecast, by Application 2019 & 2032
- Table 11: Global Plasma Expressor Machine Revenue million Forecast, by Type 2019 & 2032
- Table 12: Global Plasma Expressor Machine Volume K Forecast, by Type 2019 & 2032
- Table 13: Global Plasma Expressor Machine Revenue million Forecast, by Country 2019 & 2032
- Table 14: Global Plasma Expressor Machine Volume K Forecast, by Country 2019 & 2032
- Table 15: United States Plasma Expressor Machine Revenue (million) Forecast, by Application 2019 & 2032
- Table 16: United States Plasma Expressor Machine Volume (K) Forecast, by Application 2019 & 2032
- Table 17: Canada Plasma Expressor Machine Revenue (million) Forecast, by Application 2019 & 2032
- Table 18: Canada Plasma Expressor Machine Volume (K) Forecast, by Application 2019 & 2032
- Table 19: Mexico Plasma Expressor Machine Revenue (million) Forecast, by Application 2019 & 2032
- Table 20: Mexico Plasma Expressor Machine Volume (K) Forecast, by Application 2019 & 2032
- Table 21: Global Plasma Expressor Machine Revenue million Forecast, by Application 2019 & 2032
- Table 22: Global Plasma Expressor Machine Volume K Forecast, by Application 2019 & 2032
- Table 23: Global Plasma Expressor Machine Revenue million Forecast, by Type 2019 & 2032
- Table 24: Global Plasma Expressor Machine Volume K Forecast, by Type 2019 & 2032
- Table 25: Global Plasma Expressor Machine Revenue million Forecast, by Country 2019 & 2032
- Table 26: Global Plasma Expressor Machine Volume K Forecast, by Country 2019 & 2032
- Table 27: Brazil Plasma Expressor Machine Revenue (million) Forecast, by Application 2019 & 2032
- Table 28: Brazil Plasma Expressor Machine Volume (K) Forecast, by Application 2019 & 2032
- Table 29: Argentina Plasma Expressor Machine Revenue (million) Forecast, by Application 2019 & 2032
- Table 30: Argentina Plasma Expressor Machine Volume (K) Forecast, by Application 2019 & 2032
- Table 31: Rest of South America Plasma Expressor Machine Revenue (million) Forecast, by Application 2019 & 2032
- Table 32: Rest of South America Plasma Expressor Machine Volume (K) Forecast, by Application 2019 & 2032
- Table 33: Global Plasma Expressor Machine Revenue million Forecast, by Application 2019 & 2032
- Table 34: Global Plasma Expressor Machine Volume K Forecast, by Application 2019 & 2032
- Table 35: Global Plasma Expressor Machine Revenue million Forecast, by Type 2019 & 2032
- Table 36: Global Plasma Expressor Machine Volume K Forecast, by Type 2019 & 2032
- Table 37: Global Plasma Expressor Machine Revenue million Forecast, by Country 2019 & 2032
- Table 38: Global Plasma Expressor Machine Volume K Forecast, by Country 2019 & 2032
- Table 39: United Kingdom Plasma Expressor Machine Revenue (million) Forecast, by Application 2019 & 2032
- Table 40: United Kingdom Plasma Expressor Machine Volume (K) Forecast, by Application 2019 & 2032
- Table 41: Germany Plasma Expressor Machine Revenue (million) Forecast, by Application 2019 & 2032
- Table 42: Germany Plasma Expressor Machine Volume (K) Forecast, by Application 2019 & 2032
- Table 43: France Plasma Expressor Machine Revenue (million) Forecast, by Application 2019 & 2032
- Table 44: France Plasma Expressor Machine Volume (K) Forecast, by Application 2019 & 2032
- Table 45: Italy Plasma Expressor Machine Revenue (million) Forecast, by Application 2019 & 2032
- Table 46: Italy Plasma Expressor Machine Volume (K) Forecast, by Application 2019 & 2032
- Table 47: Spain Plasma Expressor Machine Revenue (million) Forecast, by Application 2019 & 2032
- Table 48: Spain Plasma Expressor Machine Volume (K) Forecast, by Application 2019 & 2032
- Table 49: Russia Plasma Expressor Machine Revenue (million) Forecast, by Application 2019 & 2032
- Table 50: Russia Plasma Expressor Machine Volume (K) Forecast, by Application 2019 & 2032
- Table 51: Benelux Plasma Expressor Machine Revenue (million) Forecast, by Application 2019 & 2032
- Table 52: Benelux Plasma Expressor Machine Volume (K) Forecast, by Application 2019 & 2032
- Table 53: Nordics Plasma Expressor Machine Revenue (million) Forecast, by Application 2019 & 2032
- Table 54: Nordics Plasma Expressor Machine Volume (K) Forecast, by Application 2019 & 2032
- Table 55: Rest of Europe Plasma Expressor Machine Revenue (million) Forecast, by Application 2019 & 2032
- Table 56: Rest of Europe Plasma Expressor Machine Volume (K) Forecast, by Application 2019 & 2032
- Table 57: Global Plasma Expressor Machine Revenue million Forecast, by Application 2019 & 2032
- Table 58: Global Plasma Expressor Machine Volume K Forecast, by Application 2019 & 2032
- Table 59: Global Plasma Expressor Machine Revenue million Forecast, by Type 2019 & 2032
- Table 60: Global Plasma Expressor Machine Volume K Forecast, by Type 2019 & 2032
- Table 61: Global Plasma Expressor Machine Revenue million Forecast, by Country 2019 & 2032
- Table 62: Global Plasma Expressor Machine Volume K Forecast, by Country 2019 & 2032
- Table 63: Turkey Plasma Expressor Machine Revenue (million) Forecast, by Application 2019 & 2032
- Table 64: Turkey Plasma Expressor Machine Volume (K) Forecast, by Application 2019 & 2032
- Table 65: Israel Plasma Expressor Machine Revenue (million) Forecast, by Application 2019 & 2032
- Table 66: Israel Plasma Expressor Machine Volume (K) Forecast, by Application 2019 & 2032
- Table 67: GCC Plasma Expressor Machine Revenue (million) Forecast, by Application 2019 & 2032
- Table 68: GCC Plasma Expressor Machine Volume (K) Forecast, by Application 2019 & 2032
- Table 69: North Africa Plasma Expressor Machine Revenue (million) Forecast, by Application 2019 & 2032
- Table 70: North Africa Plasma Expressor Machine Volume (K) Forecast, by Application 2019 & 2032
- Table 71: South Africa Plasma Expressor Machine Revenue (million) Forecast, by Application 2019 & 2032
- Table 72: South Africa Plasma Expressor Machine Volume (K) Forecast, by Application 2019 & 2032
- Table 73: Rest of Middle East & Africa Plasma Expressor Machine Revenue (million) Forecast, by Application 2019 & 2032
- Table 74: Rest of Middle East & Africa Plasma Expressor Machine Volume (K) Forecast, by Application 2019 & 2032
- Table 75: Global Plasma Expressor Machine Revenue million Forecast, by Application 2019 & 2032
- Table 76: Global Plasma Expressor Machine Volume K Forecast, by Application 2019 & 2032
- Table 77: Global Plasma Expressor Machine Revenue million Forecast, by Type 2019 & 2032
- Table 78: Global Plasma Expressor Machine Volume K Forecast, by Type 2019 & 2032
- Table 79: Global Plasma Expressor Machine Revenue million Forecast, by Country 2019 & 2032
- Table 80: Global Plasma Expressor Machine Volume K Forecast, by Country 2019 & 2032
- Table 81: China Plasma Expressor Machine Revenue (million) Forecast, by Application 2019 & 2032
- Table 82: China Plasma Expressor Machine Volume (K) Forecast, by Application 2019 & 2032
- Table 83: India Plasma Expressor Machine Revenue (million) Forecast, by Application 2019 & 2032
- Table 84: India Plasma Expressor Machine Volume (K) Forecast, by Application 2019 & 2032
- Table 85: Japan Plasma Expressor Machine Revenue (million) Forecast, by Application 2019 & 2032
- Table 86: Japan Plasma Expressor Machine Volume (K) Forecast, by Application 2019 & 2032
- Table 87: South Korea Plasma Expressor Machine Revenue (million) Forecast, by Application 2019 & 2032
- Table 88: South Korea Plasma Expressor Machine Volume (K) Forecast, by Application 2019 & 2032
- Table 89: ASEAN Plasma Expressor Machine Revenue (million) Forecast, by Application 2019 & 2032
- Table 90: ASEAN Plasma Expressor Machine Volume (K) Forecast, by Application 2019 & 2032
- Table 91: Oceania Plasma Expressor Machine Revenue (million) Forecast, by Application 2019 & 2032
- Table 92: Oceania Plasma Expressor Machine Volume (K) Forecast, by Application 2019 & 2032
- Table 93: Rest of Asia Pacific Plasma Expressor Machine Revenue (million) Forecast, by Application 2019 & 2032
- Table 94: Rest of Asia Pacific Plasma Expressor Machine Volume (K) Forecast, by Application 2019 & 2032
Frequently Asked Questions
1. What is the projected Compound Annual Growth Rate (CAGR) of the Plasma Expressor Machine?
The projected CAGR is approximately 3.4%.
2. Which companies are prominent players in the Plasma Expressor Machine?
Key companies in the market include Terumo BCT, Fresenius Kabi, Grifols, Lmb Technologie, Delcon, JMS, Bioelettronica, Demophorius Healthcare, Macopharma, BMS K Group, Nigale, BIOBASE, Weigao Group, Meditech Technologies, Labtop Instruments, Suzhou Medical Instrument.
3. What are the main segments of the Plasma Expressor Machine?
The market segments include Application, Type.
4. Can you provide details about the market size?
The market size is estimated to be USD 153 million as of 2022.
5. What are some drivers contributing to market growth?
N/A
6. What are the notable trends driving market growth?
N/A
7. Are there any restraints impacting market growth?
N/A
8. Can you provide examples of recent developments in the market?
N/A
9. What pricing options are available for accessing the report?
Pricing options include single-user, multi-user, and enterprise licenses priced at USD 3950.00, USD 5925.00, and USD 7900.00 respectively.
10. Is the market size provided in terms of value or volume?
The market size is provided in terms of value, measured in million and volume, measured in K.
11. Are there any specific market keywords associated with the report?
Yes, the market keyword associated with the report is "Plasma Expressor Machine," which aids in identifying and referencing the specific market segment covered.
12. How do I determine which pricing option suits my needs best?
The pricing options vary based on user requirements and access needs. Individual users may opt for single-user licenses, while businesses requiring broader access may choose multi-user or enterprise licenses for cost-effective access to the report.
13. Are there any additional resources or data provided in the Plasma Expressor Machine report?
While the report offers comprehensive insights, it's advisable to review the specific contents or supplementary materials provided to ascertain if additional resources or data are available.
14. How can I stay updated on further developments or reports in the Plasma Expressor Machine?
To stay informed about further developments, trends, and reports in the Plasma Expressor Machine, consider subscribing to industry newsletters, following relevant companies and organizations, or regularly checking reputable industry news sources and publications.
Methodology
Step 1 - Identification of Relevant Samples Size from Population Database


Step 2 - Approaches for Defining Global Market Size (Value, Volume* & Price*)

Note*: In applicable scenarios
Step 3 - Data Sources
Primary Research
- Web Analytics
- Survey Reports
- Research Institute
- Latest Research Reports
- Opinion Leaders
Secondary Research
- Annual Reports
- White Paper
- Latest Press Release
- Industry Association
- Paid Database
- Investor Presentations

Step 4 - Data Triangulation
Involves using different sources of information in order to increase the validity of a study
These sources are likely to be stakeholders in a program - participants, other researchers, program staff, other community members, and so on.
Then we put all data in single framework & apply various statistical tools to find out the dynamic on the market.
During the analysis stage, feedback from the stakeholder groups would be compared to determine areas of agreement as well as areas of divergence


