
Key Insights
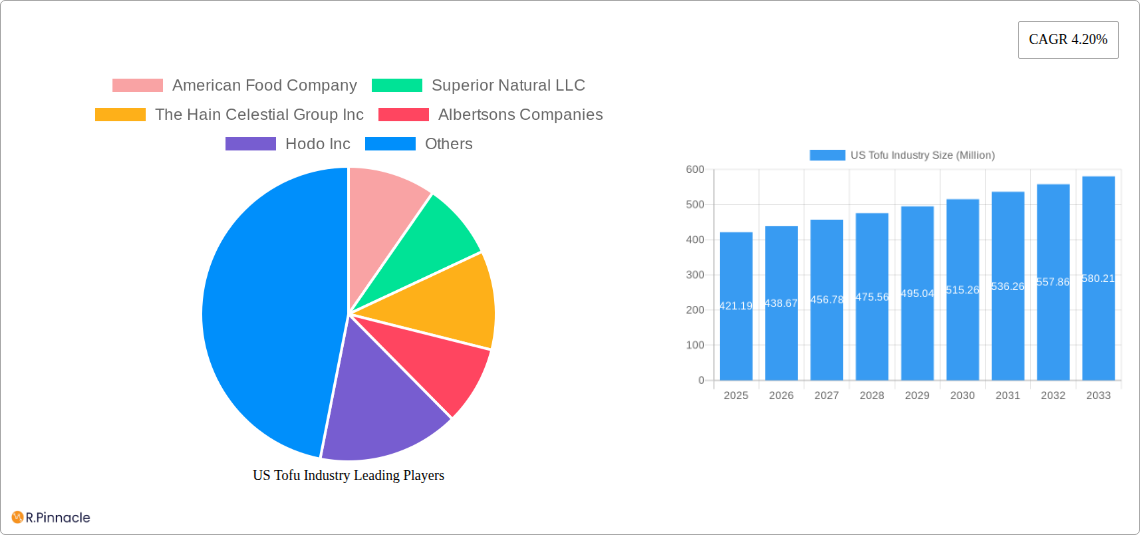
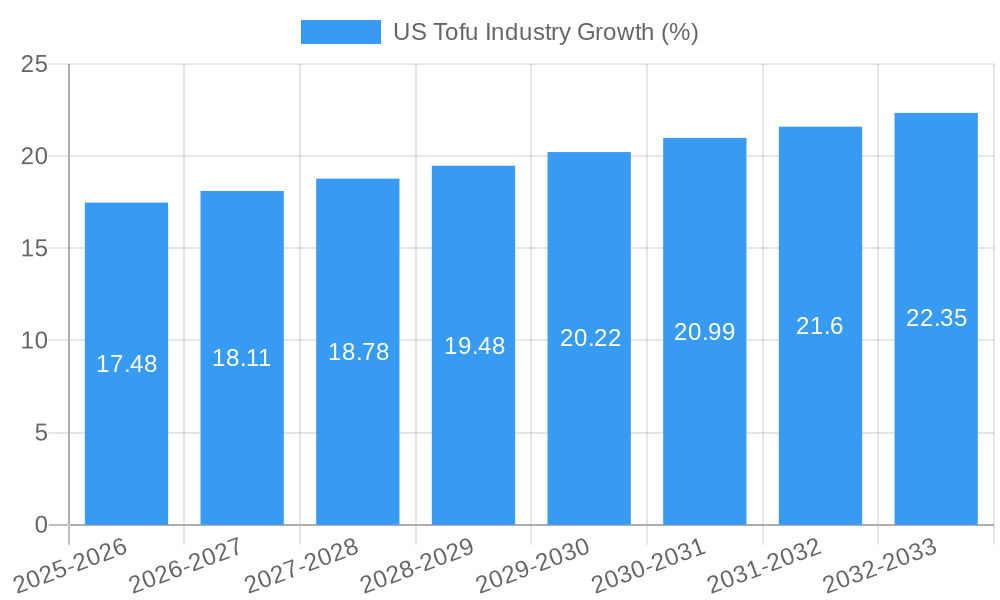
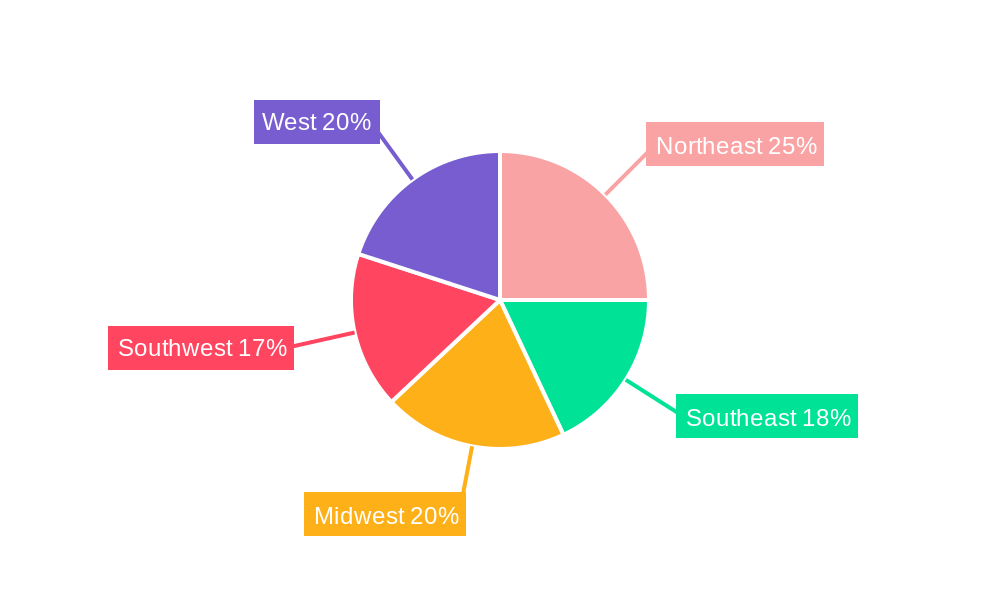
The US tofu market, valued at $421.19 million in 2025, is projected to experience steady growth, driven by increasing consumer awareness of plant-based diets and the health benefits associated with tofu consumption. The market's Compound Annual Growth Rate (CAGR) of 4.20% from 2019 to 2024 indicates a consistent demand for tofu products. This growth is fueled by several factors, including the rising popularity of vegetarianism and veganism, the growing demand for sustainable and ethical food choices, and the increasing availability of tofu in diverse culinary applications beyond traditional Asian cuisine. The market is segmented into on-trade (foodservice) and off-trade (retail) distribution channels, with both exhibiting potential for growth. Major players like American Food Company, Superior Natural LLC, and The Hain Celestial Group Inc. are actively shaping the market landscape through product innovation and expansion into new distribution channels. Regional variations exist, with regions like the West Coast and Northeast likely showing stronger adoption rates due to higher concentrations of health-conscious consumers and diverse culinary preferences. The continued focus on product innovation, such as flavored tofus, organic varieties, and ready-to-eat tofu meals, will be key to further market expansion.
The competitive landscape involves both established players and emerging brands. Smaller companies are gaining traction by focusing on niche markets, such as organic or specialty tofu products. The increasing availability of tofu in mainstream grocery stores and restaurants indicates a broadening of market reach. While challenges such as fluctuating soybean prices and competition from other plant-based protein sources exist, the overall outlook for the US tofu market remains positive, anticipating continued growth throughout the forecast period (2025-2033). Further expansion will likely be driven by successful marketing campaigns that highlight the versatility and nutritional benefits of tofu, catering to both established and new consumer segments.
This comprehensive report provides a detailed analysis of the US Tofu industry, offering invaluable insights for industry professionals, investors, and stakeholders. With a focus on market structure, dynamics, and future projections, this report covers the period 2019-2033, with a base year of 2025 and a forecast period of 2025-2033. The report leverages extensive data analysis to illuminate key trends and opportunities within this rapidly evolving sector. Discover actionable strategies to capitalize on the growth potential of the US Tofu market.
US Tofu Industry Market Structure & Innovation Trends
This section analyzes the competitive landscape of the US Tofu market, examining market concentration, innovation drivers, regulatory influences, product substitutes, end-user demographics, and mergers & acquisitions (M&A) activities. The historical period (2019-2024) and the estimated year (2025) provide a robust foundation for understanding current market dynamics.
Market Concentration: The US Tofu market exhibits a moderately concentrated structure, with a few major players holding significant market share. American Food Company, Superior Natural LLC, The Hain Celestial Group Inc., and House Foods Group Inc. represent some of the key players, although precise market share figures for each require further in-depth analysis and are unavailable at this time.
Innovation Drivers: Growing consumer demand for plant-based proteins and increasing health consciousness are major innovation drivers. The development of novel tofu products with diverse flavors and textures is a key trend. The push for sustainability in food production also drives innovation in processing and packaging.
Regulatory Framework: FDA regulations concerning food safety and labeling significantly impact the industry. Compliance with these regulations is crucial for all players. Changes in labeling requirements or food safety standards could alter market dynamics.
Product Substitutes: Other plant-based protein sources, such as soy milk, tempeh, seitan, and meat alternatives, compete with tofu. The competitive landscape is constantly evolving as new substitutes emerge.
End-User Demographics: The primary end-users are health-conscious consumers, vegetarians, vegans, and individuals seeking plant-based protein alternatives. Growing awareness of the environmental benefits of plant-based diets is driving increased consumption.
M&A Activities: Recent M&A activities, such as Morinaga Nutritional Foods' acquisition of Tofurky in February 2023, demonstrate industry consolidation and strategic investments to expand market share and enhance supply chain efficiency. The deal values for such acquisitions typically remain undisclosed.
US Tofu Industry Market Dynamics & Trends
This section explores the factors driving market growth, including technological advancements, shifting consumer preferences, and the competitive landscape. The report analyzes historical and projected growth rates to paint a comprehensive picture of market evolution.
The US Tofu market is experiencing robust growth, driven by several factors. The increasing awareness of the health benefits associated with plant-based diets, specifically the high protein content and low saturated fat levels of tofu, is a primary driver. Further fueling this growth is the rising popularity of veganism and vegetarianism, alongside a growing interest in sustainable and environmentally friendly food choices. Technological innovations in tofu processing and the development of new flavors and product formats, like the recent introduction of Miso and Indian Spiced Tofu by Hodo Inc., are also contributing to market expansion. The competitive dynamics are characterized by both established players and emerging brands vying for market share through product differentiation, strategic partnerships, and innovations in production and distribution. While precise CAGR (Compound Annual Growth Rate) and market penetration figures require detailed calculations using historical and projected data, early estimates suggest significant positive growth over the forecast period.
Dominant Regions & Segments in US Tofu Industry
This section identifies the leading regions and segments within the US Tofu market. While detailed regional breakdowns necessitate further analysis, we expect that urban areas with higher concentrations of health-conscious consumers would exhibit stronger market performance.
Off-Trade Distribution Channel: This channel dominates the US Tofu market, encompassing grocery stores, supermarkets, and other retail outlets. Key drivers of growth include expanding retail channels and increased accessibility of tofu products.
On-Trade Distribution Channel (Others): The on-trade segment (restaurants, food service establishments) is a smaller but growing segment, reflecting the increasing integration of tofu into diverse culinary applications. Growth is linked to the rising popularity of plant-based menus in restaurants and the demand for convenient, protein-rich options in food service.
US Tofu Industry Product Innovations
Recent product innovations reflect a focus on diversifying flavors, textures, and applications of tofu. The launch of new products with global flavors (Hodo’s Miso and Indian Spiced Tofu) illustrates this trend. Furthermore, improvements in tofu processing techniques aim to enhance texture, taste, and nutritional value. These innovations directly address the evolving consumer preferences and compete with other plant-based alternatives in a dynamic market.
Report Scope & Segmentation Analysis
This report segments the US Tofu market by distribution channel (Off-Trade and On-Trade). The Off-Trade channel encompasses various retail outlets, while the On-Trade channel includes food service establishments. Growth projections vary depending on the segment, reflecting differences in consumer preferences and market dynamics. Competitive analysis within each segment is crucial for understanding market share and positioning. Detailed market size estimations are pending further data analysis.
Key Drivers of US Tofu Industry Growth
Several factors drive the growth of the US Tofu industry:
- Growing demand for plant-based protein: Health-conscious consumers and growing vegetarian/vegan populations are fueling demand.
- Technological advancements: Innovations in tofu processing improve texture, taste, and shelf life.
- Favorable regulatory environment: (Assumes a supportive regulatory environment that facilitates market growth).
- Rising awareness of environmental benefits: Consumers increasingly choose plant-based options for sustainability reasons.
Challenges in the US Tofu Industry Sector
The US Tofu industry faces several challenges:
- Competition from other plant-based proteins: Tofu competes with other sources like tempeh, seitan, and meat alternatives.
- Supply chain disruptions: Potential disruptions can impact product availability and pricing.
- Maintaining product quality and consistency: Manufacturing processes need to ensure consistent quality across production runs.
Emerging Opportunities in US Tofu Industry
Several emerging opportunities exist:
- Development of new product forms and flavors: Continued innovation can meet diverse consumer preferences.
- Expansion into new markets: Untapped markets represent significant growth potential.
- Strategic partnerships and collaborations: Joint ventures can enhance distribution and market reach.
Leading Players in the US Tofu Industry Market
- American Food Company
- Superior Natural LLC
- The Hain Celestial Group Inc
- Albertsons Companies
- Hodo Inc
- Pulmuone Corporate
- House Foods Group Inc
- Morinaga Milk Industry Co Ltd
Key Developments in US Tofu Industry
- June 2022: Morinaga Nutritional Foods launched Mori-Nu Yuzu Flavored Silken Tofu.
- February 2023: Morinaga Nutritional Foods acquired Tofurky and Moocho.
- March 2023: Hodo launched Miso Tofu and Indian Spiced Tofu.
Future Outlook for US Tofu Industry Market
The US Tofu market is poised for continued growth, driven by increasing consumer demand for plant-based proteins and ongoing product innovations. Strategic investments in research and development, expansion into new markets, and strategic partnerships will play key roles in shaping future market dynamics. The industry is expected to see further consolidation and the emergence of new players offering unique product propositions. The market’s potential for expansion remains significant, offering lucrative opportunities for both established and new market entrants.
US Tofu Industry Segmentation
-
1. Distribution Channel
-
1.1. Off-Trade
- 1.1.1. Convenience Stores
- 1.1.2. Online Channel
- 1.1.3. Supermarkets and Hypermarkets
- 1.1.4. Others
- 1.2. On-Trade
-
1.1. Off-Trade
US Tofu Industry Segmentation By Geography
-
1. North America
- 1.1. United States
- 1.2. Canada
- 1.3. Mexico
-
2. South America
- 2.1. Brazil
- 2.2. Argentina
- 2.3. Rest of South America
-
3. Europe
- 3.1. United Kingdom
- 3.2. Germany
- 3.3. France
- 3.4. Italy
- 3.5. Spain
- 3.6. Russia
- 3.7. Benelux
- 3.8. Nordics
- 3.9. Rest of Europe
-
4. Middle East & Africa
- 4.1. Turkey
- 4.2. Israel
- 4.3. GCC
- 4.4. North Africa
- 4.5. South Africa
- 4.6. Rest of Middle East & Africa
-
5. Asia Pacific
- 5.1. China
- 5.2. India
- 5.3. Japan
- 5.4. South Korea
- 5.5. ASEAN
- 5.6. Oceania
- 5.7. Rest of Asia Pacific
US Tofu Industry REPORT HIGHLIGHTS
| Aspects | Details |
|---|---|
| Study Period | 2019-2033 |
| Base Year | 2024 |
| Estimated Year | 2025 |
| Forecast Period | 2025-2033 |
| Historical Period | 2019-2024 |
| Growth Rate | CAGR of 4.20% from 2019-2033 |
| Segmentation |
|
Table of Contents
- 1. Introduction
- 1.1. Research Scope
- 1.2. Market Segmentation
- 1.3. Research Methodology
- 1.4. Definitions and Assumptions
- 2. Executive Summary
- 2.1. Introduction
- 3. Market Dynamics
- 3.1. Introduction
- 3.2. Market Drivers
- 3.2.1. Escalating Demand for Processed Poultry Products; Favorable Government Initiatives to Boost Production
- 3.3. Market Restrains
- 3.3.1. Rising Vegan Trend among Young Consumers; Deeper Penetration of Red Meat Across Saudi Arabia
- 3.4. Market Trends
- 3.4.1. Increasing demand for new variants in the tofu market through the expanded e-commerce channels drives the market
- 4. Market Factor Analysis
- 4.1. Porters Five Forces
- 4.2. Supply/Value Chain
- 4.3. PESTEL analysis
- 4.4. Market Entropy
- 4.5. Patent/Trademark Analysis
- 5. Global US Tofu Industry Analysis, Insights and Forecast, 2019-2031
- 5.1. Market Analysis, Insights and Forecast - by Distribution Channel
- 5.1.1. Off-Trade
- 5.1.1.1. Convenience Stores
- 5.1.1.2. Online Channel
- 5.1.1.3. Supermarkets and Hypermarkets
- 5.1.1.4. Others
- 5.1.2. On-Trade
- 5.1.1. Off-Trade
- 5.2. Market Analysis, Insights and Forecast - by Region
- 5.2.1. North America
- 5.2.2. South America
- 5.2.3. Europe
- 5.2.4. Middle East & Africa
- 5.2.5. Asia Pacific
- 5.1. Market Analysis, Insights and Forecast - by Distribution Channel
- 6. North America US Tofu Industry Analysis, Insights and Forecast, 2019-2031
- 6.1. Market Analysis, Insights and Forecast - by Distribution Channel
- 6.1.1. Off-Trade
- 6.1.1.1. Convenience Stores
- 6.1.1.2. Online Channel
- 6.1.1.3. Supermarkets and Hypermarkets
- 6.1.1.4. Others
- 6.1.2. On-Trade
- 6.1.1. Off-Trade
- 6.1. Market Analysis, Insights and Forecast - by Distribution Channel
- 7. South America US Tofu Industry Analysis, Insights and Forecast, 2019-2031
- 7.1. Market Analysis, Insights and Forecast - by Distribution Channel
- 7.1.1. Off-Trade
- 7.1.1.1. Convenience Stores
- 7.1.1.2. Online Channel
- 7.1.1.3. Supermarkets and Hypermarkets
- 7.1.1.4. Others
- 7.1.2. On-Trade
- 7.1.1. Off-Trade
- 7.1. Market Analysis, Insights and Forecast - by Distribution Channel
- 8. Europe US Tofu Industry Analysis, Insights and Forecast, 2019-2031
- 8.1. Market Analysis, Insights and Forecast - by Distribution Channel
- 8.1.1. Off-Trade
- 8.1.1.1. Convenience Stores
- 8.1.1.2. Online Channel
- 8.1.1.3. Supermarkets and Hypermarkets
- 8.1.1.4. Others
- 8.1.2. On-Trade
- 8.1.1. Off-Trade
- 8.1. Market Analysis, Insights and Forecast - by Distribution Channel
- 9. Middle East & Africa US Tofu Industry Analysis, Insights and Forecast, 2019-2031
- 9.1. Market Analysis, Insights and Forecast - by Distribution Channel
- 9.1.1. Off-Trade
- 9.1.1.1. Convenience Stores
- 9.1.1.2. Online Channel
- 9.1.1.3. Supermarkets and Hypermarkets
- 9.1.1.4. Others
- 9.1.2. On-Trade
- 9.1.1. Off-Trade
- 9.1. Market Analysis, Insights and Forecast - by Distribution Channel
- 10. Asia Pacific US Tofu Industry Analysis, Insights and Forecast, 2019-2031
- 10.1. Market Analysis, Insights and Forecast - by Distribution Channel
- 10.1.1. Off-Trade
- 10.1.1.1. Convenience Stores
- 10.1.1.2. Online Channel
- 10.1.1.3. Supermarkets and Hypermarkets
- 10.1.1.4. Others
- 10.1.2. On-Trade
- 10.1.1. Off-Trade
- 10.1. Market Analysis, Insights and Forecast - by Distribution Channel
- 11. Northeast US Tofu Industry Analysis, Insights and Forecast, 2019-2031
- 12. Southeast US Tofu Industry Analysis, Insights and Forecast, 2019-2031
- 13. Midwest US Tofu Industry Analysis, Insights and Forecast, 2019-2031
- 14. Southwest US Tofu Industry Analysis, Insights and Forecast, 2019-2031
- 15. West US Tofu Industry Analysis, Insights and Forecast, 2019-2031
- 16. Competitive Analysis
- 16.1. Global Market Share Analysis 2024
- 16.2. Company Profiles
- 16.2.1 American Food Company
- 16.2.1.1. Overview
- 16.2.1.2. Products
- 16.2.1.3. SWOT Analysis
- 16.2.1.4. Recent Developments
- 16.2.1.5. Financials (Based on Availability)
- 16.2.2 Superior Natural LLC
- 16.2.2.1. Overview
- 16.2.2.2. Products
- 16.2.2.3. SWOT Analysis
- 16.2.2.4. Recent Developments
- 16.2.2.5. Financials (Based on Availability)
- 16.2.3 The Hain Celestial Group Inc
- 16.2.3.1. Overview
- 16.2.3.2. Products
- 16.2.3.3. SWOT Analysis
- 16.2.3.4. Recent Developments
- 16.2.3.5. Financials (Based on Availability)
- 16.2.4 Albertsons Companies
- 16.2.4.1. Overview
- 16.2.4.2. Products
- 16.2.4.3. SWOT Analysis
- 16.2.4.4. Recent Developments
- 16.2.4.5. Financials (Based on Availability)
- 16.2.5 Hodo Inc
- 16.2.5.1. Overview
- 16.2.5.2. Products
- 16.2.5.3. SWOT Analysis
- 16.2.5.4. Recent Developments
- 16.2.5.5. Financials (Based on Availability)
- 16.2.6 Pulmuone Corporate
- 16.2.6.1. Overview
- 16.2.6.2. Products
- 16.2.6.3. SWOT Analysis
- 16.2.6.4. Recent Developments
- 16.2.6.5. Financials (Based on Availability)
- 16.2.7 House Foods Group Inc
- 16.2.7.1. Overview
- 16.2.7.2. Products
- 16.2.7.3. SWOT Analysis
- 16.2.7.4. Recent Developments
- 16.2.7.5. Financials (Based on Availability)
- 16.2.8 Morinaga Milk Industry Co Ltd
- 16.2.8.1. Overview
- 16.2.8.2. Products
- 16.2.8.3. SWOT Analysis
- 16.2.8.4. Recent Developments
- 16.2.8.5. Financials (Based on Availability)
- 16.2.1 American Food Company
List of Figures
- Figure 1: Global US Tofu Industry Revenue Breakdown (Million, %) by Region 2024 & 2032
- Figure 2: Global US Tofu Industry Volume Breakdown (K Tons, %) by Region 2024 & 2032
- Figure 3: United states US Tofu Industry Revenue (Million), by Country 2024 & 2032
- Figure 4: United states US Tofu Industry Volume (K Tons), by Country 2024 & 2032
- Figure 5: United states US Tofu Industry Revenue Share (%), by Country 2024 & 2032
- Figure 6: United states US Tofu Industry Volume Share (%), by Country 2024 & 2032
- Figure 7: North America US Tofu Industry Revenue (Million), by Distribution Channel 2024 & 2032
- Figure 8: North America US Tofu Industry Volume (K Tons), by Distribution Channel 2024 & 2032
- Figure 9: North America US Tofu Industry Revenue Share (%), by Distribution Channel 2024 & 2032
- Figure 10: North America US Tofu Industry Volume Share (%), by Distribution Channel 2024 & 2032
- Figure 11: North America US Tofu Industry Revenue (Million), by Country 2024 & 2032
- Figure 12: North America US Tofu Industry Volume (K Tons), by Country 2024 & 2032
- Figure 13: North America US Tofu Industry Revenue Share (%), by Country 2024 & 2032
- Figure 14: North America US Tofu Industry Volume Share (%), by Country 2024 & 2032
- Figure 15: South America US Tofu Industry Revenue (Million), by Distribution Channel 2024 & 2032
- Figure 16: South America US Tofu Industry Volume (K Tons), by Distribution Channel 2024 & 2032
- Figure 17: South America US Tofu Industry Revenue Share (%), by Distribution Channel 2024 & 2032
- Figure 18: South America US Tofu Industry Volume Share (%), by Distribution Channel 2024 & 2032
- Figure 19: South America US Tofu Industry Revenue (Million), by Country 2024 & 2032
- Figure 20: South America US Tofu Industry Volume (K Tons), by Country 2024 & 2032
- Figure 21: South America US Tofu Industry Revenue Share (%), by Country 2024 & 2032
- Figure 22: South America US Tofu Industry Volume Share (%), by Country 2024 & 2032
- Figure 23: Europe US Tofu Industry Revenue (Million), by Distribution Channel 2024 & 2032
- Figure 24: Europe US Tofu Industry Volume (K Tons), by Distribution Channel 2024 & 2032
- Figure 25: Europe US Tofu Industry Revenue Share (%), by Distribution Channel 2024 & 2032
- Figure 26: Europe US Tofu Industry Volume Share (%), by Distribution Channel 2024 & 2032
- Figure 27: Europe US Tofu Industry Revenue (Million), by Country 2024 & 2032
- Figure 28: Europe US Tofu Industry Volume (K Tons), by Country 2024 & 2032
- Figure 29: Europe US Tofu Industry Revenue Share (%), by Country 2024 & 2032
- Figure 30: Europe US Tofu Industry Volume Share (%), by Country 2024 & 2032
- Figure 31: Middle East & Africa US Tofu Industry Revenue (Million), by Distribution Channel 2024 & 2032
- Figure 32: Middle East & Africa US Tofu Industry Volume (K Tons), by Distribution Channel 2024 & 2032
- Figure 33: Middle East & Africa US Tofu Industry Revenue Share (%), by Distribution Channel 2024 & 2032
- Figure 34: Middle East & Africa US Tofu Industry Volume Share (%), by Distribution Channel 2024 & 2032
- Figure 35: Middle East & Africa US Tofu Industry Revenue (Million), by Country 2024 & 2032
- Figure 36: Middle East & Africa US Tofu Industry Volume (K Tons), by Country 2024 & 2032
- Figure 37: Middle East & Africa US Tofu Industry Revenue Share (%), by Country 2024 & 2032
- Figure 38: Middle East & Africa US Tofu Industry Volume Share (%), by Country 2024 & 2032
- Figure 39: Asia Pacific US Tofu Industry Revenue (Million), by Distribution Channel 2024 & 2032
- Figure 40: Asia Pacific US Tofu Industry Volume (K Tons), by Distribution Channel 2024 & 2032
- Figure 41: Asia Pacific US Tofu Industry Revenue Share (%), by Distribution Channel 2024 & 2032
- Figure 42: Asia Pacific US Tofu Industry Volume Share (%), by Distribution Channel 2024 & 2032
- Figure 43: Asia Pacific US Tofu Industry Revenue (Million), by Country 2024 & 2032
- Figure 44: Asia Pacific US Tofu Industry Volume (K Tons), by Country 2024 & 2032
- Figure 45: Asia Pacific US Tofu Industry Revenue Share (%), by Country 2024 & 2032
- Figure 46: Asia Pacific US Tofu Industry Volume Share (%), by Country 2024 & 2032
List of Tables
- Table 1: Global US Tofu Industry Revenue Million Forecast, by Region 2019 & 2032
- Table 2: Global US Tofu Industry Volume K Tons Forecast, by Region 2019 & 2032
- Table 3: Global US Tofu Industry Revenue Million Forecast, by Distribution Channel 2019 & 2032
- Table 4: Global US Tofu Industry Volume K Tons Forecast, by Distribution Channel 2019 & 2032
- Table 5: Global US Tofu Industry Revenue Million Forecast, by Region 2019 & 2032
- Table 6: Global US Tofu Industry Volume K Tons Forecast, by Region 2019 & 2032
- Table 7: Global US Tofu Industry Revenue Million Forecast, by Country 2019 & 2032
- Table 8: Global US Tofu Industry Volume K Tons Forecast, by Country 2019 & 2032
- Table 9: Northeast US Tofu Industry Revenue (Million) Forecast, by Application 2019 & 2032
- Table 10: Northeast US Tofu Industry Volume (K Tons) Forecast, by Application 2019 & 2032
- Table 11: Southeast US Tofu Industry Revenue (Million) Forecast, by Application 2019 & 2032
- Table 12: Southeast US Tofu Industry Volume (K Tons) Forecast, by Application 2019 & 2032
- Table 13: Midwest US Tofu Industry Revenue (Million) Forecast, by Application 2019 & 2032
- Table 14: Midwest US Tofu Industry Volume (K Tons) Forecast, by Application 2019 & 2032
- Table 15: Southwest US Tofu Industry Revenue (Million) Forecast, by Application 2019 & 2032
- Table 16: Southwest US Tofu Industry Volume (K Tons) Forecast, by Application 2019 & 2032
- Table 17: West US Tofu Industry Revenue (Million) Forecast, by Application 2019 & 2032
- Table 18: West US Tofu Industry Volume (K Tons) Forecast, by Application 2019 & 2032
- Table 19: Global US Tofu Industry Revenue Million Forecast, by Distribution Channel 2019 & 2032
- Table 20: Global US Tofu Industry Volume K Tons Forecast, by Distribution Channel 2019 & 2032
- Table 21: Global US Tofu Industry Revenue Million Forecast, by Country 2019 & 2032
- Table 22: Global US Tofu Industry Volume K Tons Forecast, by Country 2019 & 2032
- Table 23: United States US Tofu Industry Revenue (Million) Forecast, by Application 2019 & 2032
- Table 24: United States US Tofu Industry Volume (K Tons) Forecast, by Application 2019 & 2032
- Table 25: Canada US Tofu Industry Revenue (Million) Forecast, by Application 2019 & 2032
- Table 26: Canada US Tofu Industry Volume (K Tons) Forecast, by Application 2019 & 2032
- Table 27: Mexico US Tofu Industry Revenue (Million) Forecast, by Application 2019 & 2032
- Table 28: Mexico US Tofu Industry Volume (K Tons) Forecast, by Application 2019 & 2032
- Table 29: Global US Tofu Industry Revenue Million Forecast, by Distribution Channel 2019 & 2032
- Table 30: Global US Tofu Industry Volume K Tons Forecast, by Distribution Channel 2019 & 2032
- Table 31: Global US Tofu Industry Revenue Million Forecast, by Country 2019 & 2032
- Table 32: Global US Tofu Industry Volume K Tons Forecast, by Country 2019 & 2032
- Table 33: Brazil US Tofu Industry Revenue (Million) Forecast, by Application 2019 & 2032
- Table 34: Brazil US Tofu Industry Volume (K Tons) Forecast, by Application 2019 & 2032
- Table 35: Argentina US Tofu Industry Revenue (Million) Forecast, by Application 2019 & 2032
- Table 36: Argentina US Tofu Industry Volume (K Tons) Forecast, by Application 2019 & 2032
- Table 37: Rest of South America US Tofu Industry Revenue (Million) Forecast, by Application 2019 & 2032
- Table 38: Rest of South America US Tofu Industry Volume (K Tons) Forecast, by Application 2019 & 2032
- Table 39: Global US Tofu Industry Revenue Million Forecast, by Distribution Channel 2019 & 2032
- Table 40: Global US Tofu Industry Volume K Tons Forecast, by Distribution Channel 2019 & 2032
- Table 41: Global US Tofu Industry Revenue Million Forecast, by Country 2019 & 2032
- Table 42: Global US Tofu Industry Volume K Tons Forecast, by Country 2019 & 2032
- Table 43: United Kingdom US Tofu Industry Revenue (Million) Forecast, by Application 2019 & 2032
- Table 44: United Kingdom US Tofu Industry Volume (K Tons) Forecast, by Application 2019 & 2032
- Table 45: Germany US Tofu Industry Revenue (Million) Forecast, by Application 2019 & 2032
- Table 46: Germany US Tofu Industry Volume (K Tons) Forecast, by Application 2019 & 2032
- Table 47: France US Tofu Industry Revenue (Million) Forecast, by Application 2019 & 2032
- Table 48: France US Tofu Industry Volume (K Tons) Forecast, by Application 2019 & 2032
- Table 49: Italy US Tofu Industry Revenue (Million) Forecast, by Application 2019 & 2032
- Table 50: Italy US Tofu Industry Volume (K Tons) Forecast, by Application 2019 & 2032
- Table 51: Spain US Tofu Industry Revenue (Million) Forecast, by Application 2019 & 2032
- Table 52: Spain US Tofu Industry Volume (K Tons) Forecast, by Application 2019 & 2032
- Table 53: Russia US Tofu Industry Revenue (Million) Forecast, by Application 2019 & 2032
- Table 54: Russia US Tofu Industry Volume (K Tons) Forecast, by Application 2019 & 2032
- Table 55: Benelux US Tofu Industry Revenue (Million) Forecast, by Application 2019 & 2032
- Table 56: Benelux US Tofu Industry Volume (K Tons) Forecast, by Application 2019 & 2032
- Table 57: Nordics US Tofu Industry Revenue (Million) Forecast, by Application 2019 & 2032
- Table 58: Nordics US Tofu Industry Volume (K Tons) Forecast, by Application 2019 & 2032
- Table 59: Rest of Europe US Tofu Industry Revenue (Million) Forecast, by Application 2019 & 2032
- Table 60: Rest of Europe US Tofu Industry Volume (K Tons) Forecast, by Application 2019 & 2032
- Table 61: Global US Tofu Industry Revenue Million Forecast, by Distribution Channel 2019 & 2032
- Table 62: Global US Tofu Industry Volume K Tons Forecast, by Distribution Channel 2019 & 2032
- Table 63: Global US Tofu Industry Revenue Million Forecast, by Country 2019 & 2032
- Table 64: Global US Tofu Industry Volume K Tons Forecast, by Country 2019 & 2032
- Table 65: Turkey US Tofu Industry Revenue (Million) Forecast, by Application 2019 & 2032
- Table 66: Turkey US Tofu Industry Volume (K Tons) Forecast, by Application 2019 & 2032
- Table 67: Israel US Tofu Industry Revenue (Million) Forecast, by Application 2019 & 2032
- Table 68: Israel US Tofu Industry Volume (K Tons) Forecast, by Application 2019 & 2032
- Table 69: GCC US Tofu Industry Revenue (Million) Forecast, by Application 2019 & 2032
- Table 70: GCC US Tofu Industry Volume (K Tons) Forecast, by Application 2019 & 2032
- Table 71: North Africa US Tofu Industry Revenue (Million) Forecast, by Application 2019 & 2032
- Table 72: North Africa US Tofu Industry Volume (K Tons) Forecast, by Application 2019 & 2032
- Table 73: South Africa US Tofu Industry Revenue (Million) Forecast, by Application 2019 & 2032
- Table 74: South Africa US Tofu Industry Volume (K Tons) Forecast, by Application 2019 & 2032
- Table 75: Rest of Middle East & Africa US Tofu Industry Revenue (Million) Forecast, by Application 2019 & 2032
- Table 76: Rest of Middle East & Africa US Tofu Industry Volume (K Tons) Forecast, by Application 2019 & 2032
- Table 77: Global US Tofu Industry Revenue Million Forecast, by Distribution Channel 2019 & 2032
- Table 78: Global US Tofu Industry Volume K Tons Forecast, by Distribution Channel 2019 & 2032
- Table 79: Global US Tofu Industry Revenue Million Forecast, by Country 2019 & 2032
- Table 80: Global US Tofu Industry Volume K Tons Forecast, by Country 2019 & 2032
- Table 81: China US Tofu Industry Revenue (Million) Forecast, by Application 2019 & 2032
- Table 82: China US Tofu Industry Volume (K Tons) Forecast, by Application 2019 & 2032
- Table 83: India US Tofu Industry Revenue (Million) Forecast, by Application 2019 & 2032
- Table 84: India US Tofu Industry Volume (K Tons) Forecast, by Application 2019 & 2032
- Table 85: Japan US Tofu Industry Revenue (Million) Forecast, by Application 2019 & 2032
- Table 86: Japan US Tofu Industry Volume (K Tons) Forecast, by Application 2019 & 2032
- Table 87: South Korea US Tofu Industry Revenue (Million) Forecast, by Application 2019 & 2032
- Table 88: South Korea US Tofu Industry Volume (K Tons) Forecast, by Application 2019 & 2032
- Table 89: ASEAN US Tofu Industry Revenue (Million) Forecast, by Application 2019 & 2032
- Table 90: ASEAN US Tofu Industry Volume (K Tons) Forecast, by Application 2019 & 2032
- Table 91: Oceania US Tofu Industry Revenue (Million) Forecast, by Application 2019 & 2032
- Table 92: Oceania US Tofu Industry Volume (K Tons) Forecast, by Application 2019 & 2032
- Table 93: Rest of Asia Pacific US Tofu Industry Revenue (Million) Forecast, by Application 2019 & 2032
- Table 94: Rest of Asia Pacific US Tofu Industry Volume (K Tons) Forecast, by Application 2019 & 2032
Frequently Asked Questions
1. What is the projected Compound Annual Growth Rate (CAGR) of the US Tofu Industry?
The projected CAGR is approximately 4.20%.
2. Which companies are prominent players in the US Tofu Industry?
Key companies in the market include American Food Company, Superior Natural LLC, The Hain Celestial Group Inc, Albertsons Companies, Hodo Inc, Pulmuone Corporate, House Foods Group Inc, Morinaga Milk Industry Co Ltd.
3. What are the main segments of the US Tofu Industry?
The market segments include Distribution Channel.
4. Can you provide details about the market size?
The market size is estimated to be USD 421.19 Million as of 2022.
5. What are some drivers contributing to market growth?
Escalating Demand for Processed Poultry Products; Favorable Government Initiatives to Boost Production.
6. What are the notable trends driving market growth?
Increasing demand for new variants in the tofu market through the expanded e-commerce channels drives the market.
7. Are there any restraints impacting market growth?
Rising Vegan Trend among Young Consumers; Deeper Penetration of Red Meat Across Saudi Arabia.
8. Can you provide examples of recent developments in the market?
March 2023: Hodo launched two new block tofus with vibrant global flavors which include Miso Tofu and Indian Spiced Tofu.February 2023: Morinaga Nutritional Foods acquired US plant-based company, Tofurky and its sister brand Moocho. Morinaga has been a tofu supplier for Tofurky products for 17 years. The acquisition of Tofurky and Moocho will help the company to strengthen the integrated supply chain and category growth for the brands.June 2022: Morinaga Nutritional Foods launched Mori-Nu Yuzu Flavored Silken Tofu, known for its velvety smooth texture. The product has a firm texture, is versatile, and can be added to desserts or blended for preparation.
9. What pricing options are available for accessing the report?
Pricing options include single-user, multi-user, and enterprise licenses priced at USD 3800, USD 4500, and USD 5800 respectively.
10. Is the market size provided in terms of value or volume?
The market size is provided in terms of value, measured in Million and volume, measured in K Tons.
11. Are there any specific market keywords associated with the report?
Yes, the market keyword associated with the report is "US Tofu Industry," which aids in identifying and referencing the specific market segment covered.
12. How do I determine which pricing option suits my needs best?
The pricing options vary based on user requirements and access needs. Individual users may opt for single-user licenses, while businesses requiring broader access may choose multi-user or enterprise licenses for cost-effective access to the report.
13. Are there any additional resources or data provided in the US Tofu Industry report?
While the report offers comprehensive insights, it's advisable to review the specific contents or supplementary materials provided to ascertain if additional resources or data are available.
14. How can I stay updated on further developments or reports in the US Tofu Industry?
To stay informed about further developments, trends, and reports in the US Tofu Industry, consider subscribing to industry newsletters, following relevant companies and organizations, or regularly checking reputable industry news sources and publications.
Methodology
Step 1 - Identification of Relevant Samples Size from Population Database


Step 2 - Approaches for Defining Global Market Size (Value, Volume* & Price*)

Note*: In applicable scenarios
Step 3 - Data Sources
Primary Research
- Web Analytics
- Survey Reports
- Research Institute
- Latest Research Reports
- Opinion Leaders
Secondary Research
- Annual Reports
- White Paper
- Latest Press Release
- Industry Association
- Paid Database
- Investor Presentations

Step 4 - Data Triangulation
Involves using different sources of information in order to increase the validity of a study
These sources are likely to be stakeholders in a program - participants, other researchers, program staff, other community members, and so on.
Then we put all data in single framework & apply various statistical tools to find out the dynamic on the market.
During the analysis stage, feedback from the stakeholder groups would be compared to determine areas of agreement as well as areas of divergence


