
Key Insights
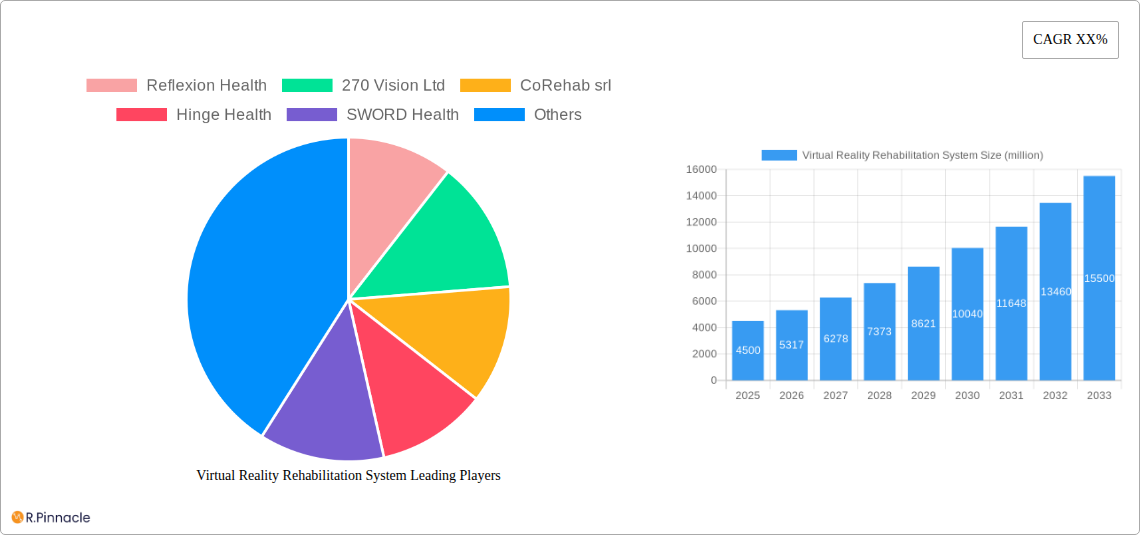
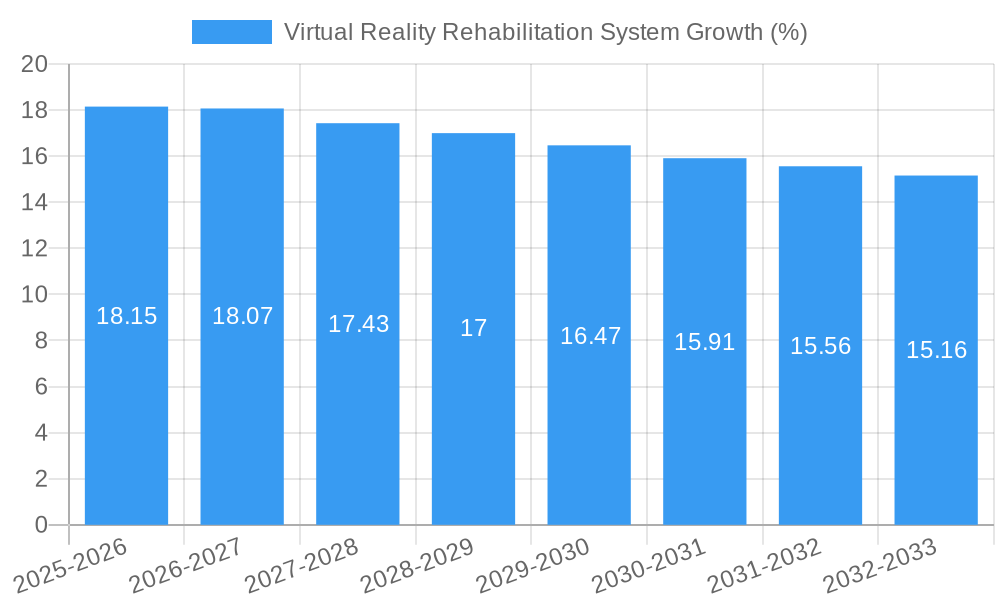
The global Virtual Reality (VR) Rehabilitation System market is poised for robust expansion, projected to reach a substantial market size of $4,500 million by 2025, with a projected Compound Annual Growth Rate (CAGR) of 18.5% through 2033. This significant growth is underpinned by a confluence of driving factors, including the increasing prevalence of chronic diseases and neurological disorders, the growing demand for patient-centric and accessible rehabilitation solutions, and the continuous technological advancements in VR hardware and software. The integration of VR in healthcare is revolutionizing traditional rehabilitation methods by offering immersive, engaging, and highly personalized therapeutic experiences. This shift is driven by the proven efficacy of VR in improving patient adherence, accelerating recovery times, and enhancing functional outcomes across a wide spectrum of conditions.
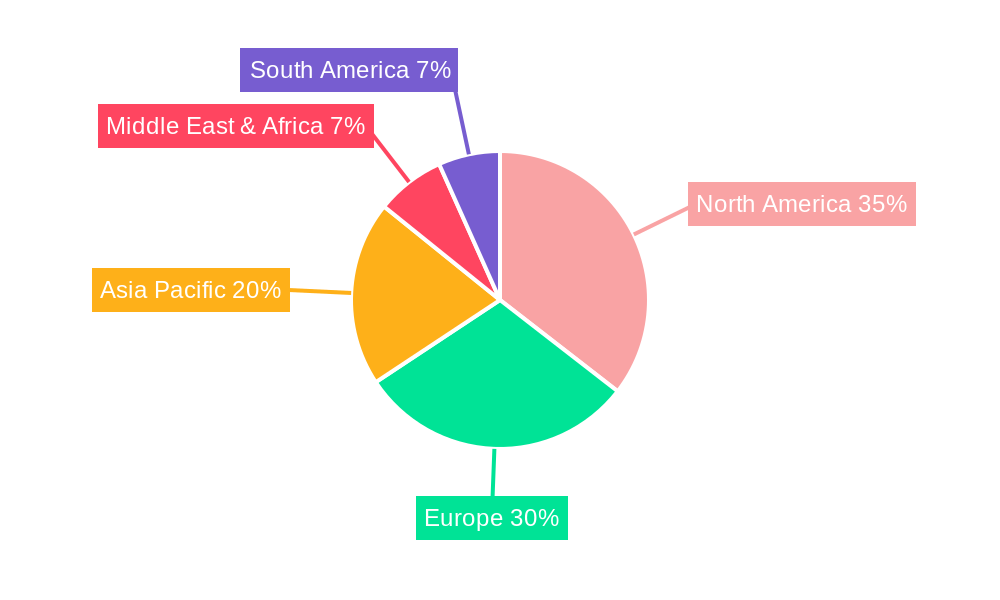
The market is segmented into key applications such as Hospitals, Rehabilitation Centers, and Home Care, with Physical Rehabilitation and Neuro Rehabilitation emerging as dominant types. The rising adoption of VR for stroke recovery, traumatic brain injury (TBI) rehabilitation, and post-surgical recovery is fueling this trend. Furthermore, the burgeoning home care segment, empowered by more affordable and user-friendly VR systems, is expanding access to rehabilitation services beyond clinical settings. Major market players like Hinge Health, SWORD Health, and Reflexion Health are actively investing in research and development, forging strategic partnerships, and expanding their product portfolios to capture market share. Geographically, North America currently leads the market, driven by advanced healthcare infrastructure and early adoption of innovative technologies, followed closely by Europe. The Asia Pacific region is anticipated to witness the fastest growth due to increasing healthcare expenditure and a growing awareness of VR-based therapeutic benefits. However, challenges such as high initial costs and the need for skilled personnel for effective implementation may pose some restraints to market expansion.
Virtual Reality Rehabilitation System Market Structure & Innovation Trends
The Virtual Reality (VR) Rehabilitation System market demonstrates a moderately concentrated structure, with a significant presence of established players and a growing influx of innovative startups. Key innovation drivers include advancements in VR hardware (e.g., higher resolution displays, reduced latency, haptic feedback integration), AI-driven analytics for personalized therapy, and the increasing demand for remote and accessible rehabilitation solutions. Regulatory frameworks, particularly those concerning medical device certification and data privacy (e.g., HIPAA compliance for patient data), are crucial in shaping market entry and product development. While direct product substitutes are limited, traditional physiotherapy methods and less immersive digital health solutions represent indirect competition. End-user demographics are expanding to include younger populations recovering from sports injuries and neurological conditions, alongside the established elderly demographic seeking mobility and cognitive enhancement. Merger and acquisition (M&A) activities are on the rise, with strategic acquisitions by larger healthcare technology firms aimed at integrating VR rehabilitation into broader digital health platforms. For instance, recent M&A deals have seen values ranging from $50 million to over $200 million, indicating significant investment and consolidation.
- Market Concentration: Moderately concentrated with key players and emerging innovators.
- Innovation Drivers: Hardware advancements, AI integration, remote accessibility.
- Regulatory Influence: Crucial for market access and patient data security.
- End-User Expansion: Growing adoption across age groups and conditions.
- M&A Activity: Increasing consolidation with deal values up to $200 million.
Virtual Reality Rehabilitation System Market Dynamics & Trends
The global Virtual Reality Rehabilitation System market is poised for substantial growth, driven by an escalating prevalence of chronic diseases, a rising aging population, and an increased focus on patient-centric and outcome-driven healthcare. The market penetration of VR rehabilitation systems is projected to accelerate, reaching an estimated 12% by 2030. Technological disruptions, particularly in the miniaturization and cost reduction of VR hardware, coupled with the development of more sophisticated therapeutic software, are democratizing access to these advanced treatment modalities. Consumer preferences are shifting towards engaging, gamified, and personalized rehabilitation experiences, which VR excels at providing, leading to improved patient adherence and outcomes. The competitive landscape is characterized by both established medical device manufacturers venturing into VR and specialized VR rehabilitation startups introducing novel solutions. Strategic partnerships between VR technology providers and healthcare institutions are becoming increasingly common, fostering innovation and market expansion. The market is expected to witness a robust Compound Annual Growth Rate (CAGR) of approximately 18% over the forecast period (2025-2033). This growth is fueled by the proven efficacy of VR in accelerating recovery times, reducing pain perception, and enhancing motor and cognitive functions across a spectrum of conditions. The increasing integration of VR into existing healthcare workflows and the growing acceptance by both clinicians and patients are further solidifying its position as a transformative rehabilitation tool. Furthermore, the development of AI-powered analytics within VR platforms allows for continuous patient monitoring, objective progress tracking, and adaptive therapy adjustments, leading to highly personalized treatment plans. This level of data-driven rehabilitation is a significant differentiator and a key trend shaping the market's trajectory. The expansion of reimbursement policies for VR-based therapies by insurance providers will also play a pivotal role in driving widespread adoption and market growth.
Dominant Regions & Segments in Virtual Reality Rehabilitation System
The North America region is currently the dominant force in the Virtual Reality Rehabilitation System market, driven by robust healthcare infrastructure, high adoption rates of advanced medical technologies, and significant investment in research and development. The United States, in particular, leads with a market share estimated at 45% of the global VR rehabilitation market. This dominance is underpinned by strong economic policies supporting healthcare innovation and a well-established network of rehabilitation centers and hospitals that are early adopters of cutting-edge technologies.
Key Drivers for North American Dominance:
- Advanced Healthcare Infrastructure: Extensive network of hospitals and rehabilitation centers equipped for technological integration.
- High Disposable Income: Greater capacity for investment in advanced medical equipment and therapies.
- Favorable Regulatory Environment: Supportive policies for medical technology adoption and innovation.
- Increased R&D Investment: Significant funding for research into VR's therapeutic applications.
Within segments, Physical Rehabilitation currently commands the largest market share, accounting for approximately 55% of the total VR rehabilitation market. This is attributed to the widespread application of VR in treating musculoskeletal disorders, post-surgical recovery, stroke rehabilitation, and sports injuries, all of which have a high incidence globally.
Dominance of Physical Rehabilitation Segment:
- Broad Applicability: Effective in treating a wide range of orthopedic, neurological, and post-operative conditions.
- Proven Efficacy: Extensive clinical evidence demonstrating improved motor control, balance, and pain management.
- Technological Advancements: VR systems are well-suited for simulating complex physical movements and providing real-time feedback.
- Growing Patient Demand: Patients are increasingly seeking engaging and effective rehabilitation solutions.
The Hospitals application segment also holds a substantial share, estimated at 40%, due to the centralized nature of acute care and post-acute rehabilitation services provided within these institutions. Rehabilitation Centers follow closely, representing around 35% of the market. The Home Care segment is experiencing the most rapid growth, projected to expand at a CAGR of 22% over the forecast period, driven by the increasing demand for remote patient monitoring and telehealth solutions.
Key Segment Growth Dynamics:
- Hospitals: Primary setting for initial rehabilitation and complex cases.
- Rehabilitation Centers: Specialized facilities focused on intensive therapy programs.
- Home Care: Rapidly growing due to convenience, cost-effectiveness, and technological advancements enabling remote delivery.
- Neuro Rehabilitation: Significant growth potential driven by increasing stroke and neurological disorder rates.
- Cognitive Rehabilitation: Emerging segment with rising demand for treating age-related cognitive decline and brain injuries.
Virtual Reality Rehabilitation System Product Innovations
Product innovations in the VR Rehabilitation System market are centered on enhancing immersion, personalization, and clinical integration. Companies are developing systems with advanced haptic feedback, higher fidelity graphics, and more intuitive user interfaces to improve patient engagement and therapeutic effectiveness. Innovations include AI-powered adaptive therapy modules that dynamically adjust difficulty based on patient performance, leading to optimized recovery pathways. Furthermore, the development of smaller, more portable VR headsets and integrated sensor technologies is facilitating the expansion of VR rehabilitation into home care settings. Competitive advantages are being built on the ability to provide objective performance metrics, streamline data collection for clinicians, and offer a wider range of therapeutic applications for diverse patient needs, from stroke recovery to balance training and cognitive retraining.
Report Scope & Segmentation Analysis
This report provides a comprehensive analysis of the Virtual Reality Rehabilitation System market from 2019 to 2033. The market is segmented by application and type.
Application Segments:
- Hospitals: This segment includes VR rehabilitation systems deployed within hospital settings for inpatient and outpatient care, focusing on acute and post-acute recovery. The segment is projected to grow at a CAGR of 16% and had an estimated market size of $800 million in 2025.
- Rehabilitation Centers: This segment covers standalone rehabilitation facilities that utilize VR systems to deliver specialized therapy programs. It is expected to grow at a CAGR of 17% with an estimated market size of $700 million in 2025.
- Home Care: This segment encompasses VR rehabilitation solutions designed for use in patients' homes, driven by telehealth and remote patient monitoring trends. It is the fastest-growing segment, projected at a CAGR of 22% and an estimated market size of $500 million in 2025.
- Others: This includes niche applications in research institutions and specialized clinics.
Type Segments:
- Physical Rehabilitation: Focuses on restoring motor function, balance, and mobility. This is the largest segment, projected at a CAGR of 18% with an estimated market size of $1.2 billion in 2025.
- Neuro Rehabilitation: Addresses conditions affecting the brain and nervous system, such as stroke, Parkinson's, and traumatic brain injury. This segment is expected to grow at a CAGR of 19% with an estimated market size of $800 million in 2025.
- Cognitive Rehabilitation: Targets impairments in memory, attention, and executive functions. This emerging segment is poised for significant growth at a CAGR of 20%, with an estimated market size of $300 million in 2025.
- Others: Includes specialized therapeutic applications.
Key Drivers of Virtual Reality Rehabilitation System Growth
The Virtual Reality Rehabilitation System market's growth is propelled by several interconnected factors. Technological advancements in VR hardware, including higher resolution displays, improved tracking accuracy, and the integration of haptic feedback, are creating more immersive and effective therapeutic experiences. The increasing prevalence of chronic diseases and neurological disorders worldwide, coupled with an aging global population, is creating a substantial demand for effective rehabilitation solutions. Furthermore, growing awareness among patients and healthcare providers about the benefits of VR in accelerating recovery, reducing pain, and improving patient engagement is a significant driver. Favorable reimbursement policies for VR-based therapies and the expanding capabilities of telehealth platforms are also facilitating wider adoption, especially in home care settings.
Challenges in the Virtual Reality Rehabilitation System Sector
Despite its promising growth, the Virtual Reality Rehabilitation System sector faces several challenges. High initial costs associated with VR hardware and software can be a barrier to adoption, particularly for smaller clinics and individuals. Regulatory hurdles, including the lengthy process of obtaining medical device certifications and ensuring data privacy compliance, can slow down market entry. The need for specialized training for both therapists and patients to effectively utilize VR systems presents an ongoing challenge. Moreover, ensuring consistent and reliable internet connectivity for remote VR rehabilitation sessions can be problematic in certain regions. Finally, the availability of robust, long-term clinical evidence demonstrating the cost-effectiveness and superiority of VR rehabilitation over traditional methods across all conditions is still evolving, which can impact widespread insurance coverage.
Emerging Opportunities in Virtual Reality Rehabilitation System
Emerging opportunities in the Virtual Reality Rehabilitation System market are abundant. The increasing demand for personalized and gamified rehabilitation experiences presents a significant avenue for innovation. The expansion of VR rehabilitation into new therapeutic areas, such as mental health and pain management, offers substantial growth potential. The development of more affordable and accessible VR hardware, combined with user-friendly software platforms, will drive the growth of the home care segment. Strategic partnerships between VR technology providers, healthcare institutions, and insurance companies are crucial for expanding market reach and establishing favorable reimbursement models. Furthermore, the integration of AI and machine learning into VR rehabilitation systems for predictive analytics and automated therapy adjustments represents a key future opportunity for enhanced patient outcomes and data-driven clinical insights.
Leading Players in the Virtual Reality Rehabilitation System Market
- Reflexion Health
- 270 Vision Ltd
- CoRehab srl
- Hinge Health
- SWORD Health
- MIRA Rehab Limited
- Bridgeway Senior Healthcare
- Motekmedical
- GestureTek Inc
- Motorika Medical Ltd
- Mobility Research (LiteGait)
- Doctor Kinetic
Key Developments in Virtual Reality Rehabilitation System Industry
- 2023: MIRA Rehab Limited launched its latest VR rehabilitation platform with enhanced AI-driven analytics for personalized patient progress tracking.
- 2023: Hinge Health secured a significant funding round of $500 million to further expand its digital musculoskeletal health solutions, including VR-based interventions.
- 2024: Reflexion Health announced a strategic partnership with a major hospital network to integrate its VR rehabilitation system into post-operative care protocols.
- 2024: SWORD Health unveiled new immersive VR environments designed for neurorehabilitation, focusing on upper limb recovery.
- 2024: Motekmedical showcased its latest motion capture and VR integration for advanced gait analysis and rehabilitation at a leading physiotherapy conference.
- 2024: CoRehab srl introduced a cost-effective VR solution tailored for smaller rehabilitation clinics and home use.
- 2024: GestureTek Inc expanded its gesture control technology to VR rehabilitation, enabling more natural and intuitive patient interaction.
Future Outlook for Virtual Reality Rehabilitation System Market
The future outlook for the Virtual Reality Rehabilitation System market is exceptionally positive, projecting continued rapid growth and widespread adoption. As VR technology becomes more sophisticated, affordable, and accessible, its integration into mainstream healthcare will accelerate. The increasing demand for remote and personalized therapies, coupled with growing evidence of VR's efficacy, will further fuel market expansion. Strategic investments in research and development will lead to novel applications and improved patient outcomes across a broader spectrum of medical conditions. The market is expected to evolve into a more integrated ecosystem, with VR rehabilitation seamlessly blending with other digital health solutions to provide comprehensive and continuous patient care, ultimately transforming the landscape of rehabilitation medicine.
Virtual Reality Rehabilitation System Segmentation
-
1. Application
- 1.1. Hospitals
- 1.2. Rehabilitation Centers
- 1.3. Home Care
- 1.4. Others
-
2. Types
- 2.1. Physical Rehabilitation
- 2.2. Neuro Rehabilitation
- 2.3. Cognitive Rehabilitation
- 2.4. Others
Virtual Reality Rehabilitation System Segmentation By Geography
-
1. North America
- 1.1. United States
- 1.2. Canada
- 1.3. Mexico
-
2. South America
- 2.1. Brazil
- 2.2. Argentina
- 2.3. Rest of South America
-
3. Europe
- 3.1. United Kingdom
- 3.2. Germany
- 3.3. France
- 3.4. Italy
- 3.5. Spain
- 3.6. Russia
- 3.7. Benelux
- 3.8. Nordics
- 3.9. Rest of Europe
-
4. Middle East & Africa
- 4.1. Turkey
- 4.2. Israel
- 4.3. GCC
- 4.4. North Africa
- 4.5. South Africa
- 4.6. Rest of Middle East & Africa
-
5. Asia Pacific
- 5.1. China
- 5.2. India
- 5.3. Japan
- 5.4. South Korea
- 5.5. ASEAN
- 5.6. Oceania
- 5.7. Rest of Asia Pacific
Virtual Reality Rehabilitation System REPORT HIGHLIGHTS
| Aspects | Details |
|---|---|
| Study Period | 2019-2033 |
| Base Year | 2024 |
| Estimated Year | 2025 |
| Forecast Period | 2025-2033 |
| Historical Period | 2019-2024 |
| Growth Rate | CAGR of XX% from 2019-2033 |
| Segmentation |
|
Table of Contents
- 1. Introduction
- 1.1. Research Scope
- 1.2. Market Segmentation
- 1.3. Research Methodology
- 1.4. Definitions and Assumptions
- 2. Executive Summary
- 2.1. Introduction
- 3. Market Dynamics
- 3.1. Introduction
- 3.2. Market Drivers
- 3.3. Market Restrains
- 3.4. Market Trends
- 4. Market Factor Analysis
- 4.1. Porters Five Forces
- 4.2. Supply/Value Chain
- 4.3. PESTEL analysis
- 4.4. Market Entropy
- 4.5. Patent/Trademark Analysis
- 5. Global Virtual Reality Rehabilitation System Analysis, Insights and Forecast, 2019-2031
- 5.1. Market Analysis, Insights and Forecast - by Application
- 5.1.1. Hospitals
- 5.1.2. Rehabilitation Centers
- 5.1.3. Home Care
- 5.1.4. Others
- 5.2. Market Analysis, Insights and Forecast - by Types
- 5.2.1. Physical Rehabilitation
- 5.2.2. Neuro Rehabilitation
- 5.2.3. Cognitive Rehabilitation
- 5.2.4. Others
- 5.3. Market Analysis, Insights and Forecast - by Region
- 5.3.1. North America
- 5.3.2. South America
- 5.3.3. Europe
- 5.3.4. Middle East & Africa
- 5.3.5. Asia Pacific
- 5.1. Market Analysis, Insights and Forecast - by Application
- 6. North America Virtual Reality Rehabilitation System Analysis, Insights and Forecast, 2019-2031
- 6.1. Market Analysis, Insights and Forecast - by Application
- 6.1.1. Hospitals
- 6.1.2. Rehabilitation Centers
- 6.1.3. Home Care
- 6.1.4. Others
- 6.2. Market Analysis, Insights and Forecast - by Types
- 6.2.1. Physical Rehabilitation
- 6.2.2. Neuro Rehabilitation
- 6.2.3. Cognitive Rehabilitation
- 6.2.4. Others
- 6.1. Market Analysis, Insights and Forecast - by Application
- 7. South America Virtual Reality Rehabilitation System Analysis, Insights and Forecast, 2019-2031
- 7.1. Market Analysis, Insights and Forecast - by Application
- 7.1.1. Hospitals
- 7.1.2. Rehabilitation Centers
- 7.1.3. Home Care
- 7.1.4. Others
- 7.2. Market Analysis, Insights and Forecast - by Types
- 7.2.1. Physical Rehabilitation
- 7.2.2. Neuro Rehabilitation
- 7.2.3. Cognitive Rehabilitation
- 7.2.4. Others
- 7.1. Market Analysis, Insights and Forecast - by Application
- 8. Europe Virtual Reality Rehabilitation System Analysis, Insights and Forecast, 2019-2031
- 8.1. Market Analysis, Insights and Forecast - by Application
- 8.1.1. Hospitals
- 8.1.2. Rehabilitation Centers
- 8.1.3. Home Care
- 8.1.4. Others
- 8.2. Market Analysis, Insights and Forecast - by Types
- 8.2.1. Physical Rehabilitation
- 8.2.2. Neuro Rehabilitation
- 8.2.3. Cognitive Rehabilitation
- 8.2.4. Others
- 8.1. Market Analysis, Insights and Forecast - by Application
- 9. Middle East & Africa Virtual Reality Rehabilitation System Analysis, Insights and Forecast, 2019-2031
- 9.1. Market Analysis, Insights and Forecast - by Application
- 9.1.1. Hospitals
- 9.1.2. Rehabilitation Centers
- 9.1.3. Home Care
- 9.1.4. Others
- 9.2. Market Analysis, Insights and Forecast - by Types
- 9.2.1. Physical Rehabilitation
- 9.2.2. Neuro Rehabilitation
- 9.2.3. Cognitive Rehabilitation
- 9.2.4. Others
- 9.1. Market Analysis, Insights and Forecast - by Application
- 10. Asia Pacific Virtual Reality Rehabilitation System Analysis, Insights and Forecast, 2019-2031
- 10.1. Market Analysis, Insights and Forecast - by Application
- 10.1.1. Hospitals
- 10.1.2. Rehabilitation Centers
- 10.1.3. Home Care
- 10.1.4. Others
- 10.2. Market Analysis, Insights and Forecast - by Types
- 10.2.1. Physical Rehabilitation
- 10.2.2. Neuro Rehabilitation
- 10.2.3. Cognitive Rehabilitation
- 10.2.4. Others
- 10.1. Market Analysis, Insights and Forecast - by Application
- 11. Competitive Analysis
- 11.1. Global Market Share Analysis 2024
- 11.2. Company Profiles
- 11.2.1 Reflexion Health
- 11.2.1.1. Overview
- 11.2.1.2. Products
- 11.2.1.3. SWOT Analysis
- 11.2.1.4. Recent Developments
- 11.2.1.5. Financials (Based on Availability)
- 11.2.2 270 Vision Ltd
- 11.2.2.1. Overview
- 11.2.2.2. Products
- 11.2.2.3. SWOT Analysis
- 11.2.2.4. Recent Developments
- 11.2.2.5. Financials (Based on Availability)
- 11.2.3 CoRehab srl
- 11.2.3.1. Overview
- 11.2.3.2. Products
- 11.2.3.3. SWOT Analysis
- 11.2.3.4. Recent Developments
- 11.2.3.5. Financials (Based on Availability)
- 11.2.4 Hinge Health
- 11.2.4.1. Overview
- 11.2.4.2. Products
- 11.2.4.3. SWOT Analysis
- 11.2.4.4. Recent Developments
- 11.2.4.5. Financials (Based on Availability)
- 11.2.5 SWORD Health
- 11.2.5.1. Overview
- 11.2.5.2. Products
- 11.2.5.3. SWOT Analysis
- 11.2.5.4. Recent Developments
- 11.2.5.5. Financials (Based on Availability)
- 11.2.6 MIRA Rehab Limited
- 11.2.6.1. Overview
- 11.2.6.2. Products
- 11.2.6.3. SWOT Analysis
- 11.2.6.4. Recent Developments
- 11.2.6.5. Financials (Based on Availability)
- 11.2.7 Bridgeway Senior Healthcare
- 11.2.7.1. Overview
- 11.2.7.2. Products
- 11.2.7.3. SWOT Analysis
- 11.2.7.4. Recent Developments
- 11.2.7.5. Financials (Based on Availability)
- 11.2.8 Motekmedical
- 11.2.8.1. Overview
- 11.2.8.2. Products
- 11.2.8.3. SWOT Analysis
- 11.2.8.4. Recent Developments
- 11.2.8.5. Financials (Based on Availability)
- 11.2.9 GestureTek Inc
- 11.2.9.1. Overview
- 11.2.9.2. Products
- 11.2.9.3. SWOT Analysis
- 11.2.9.4. Recent Developments
- 11.2.9.5. Financials (Based on Availability)
- 11.2.10 Motorika Medical Ltd
- 11.2.10.1. Overview
- 11.2.10.2. Products
- 11.2.10.3. SWOT Analysis
- 11.2.10.4. Recent Developments
- 11.2.10.5. Financials (Based on Availability)
- 11.2.11 Mobility Research (LiteGait)
- 11.2.11.1. Overview
- 11.2.11.2. Products
- 11.2.11.3. SWOT Analysis
- 11.2.11.4. Recent Developments
- 11.2.11.5. Financials (Based on Availability)
- 11.2.12 Doctor Kinetic
- 11.2.12.1. Overview
- 11.2.12.2. Products
- 11.2.12.3. SWOT Analysis
- 11.2.12.4. Recent Developments
- 11.2.12.5. Financials (Based on Availability)
- 11.2.1 Reflexion Health
List of Figures
- Figure 1: Global Virtual Reality Rehabilitation System Revenue Breakdown (million, %) by Region 2024 & 2032
- Figure 2: North America Virtual Reality Rehabilitation System Revenue (million), by Application 2024 & 2032
- Figure 3: North America Virtual Reality Rehabilitation System Revenue Share (%), by Application 2024 & 2032
- Figure 4: North America Virtual Reality Rehabilitation System Revenue (million), by Types 2024 & 2032
- Figure 5: North America Virtual Reality Rehabilitation System Revenue Share (%), by Types 2024 & 2032
- Figure 6: North America Virtual Reality Rehabilitation System Revenue (million), by Country 2024 & 2032
- Figure 7: North America Virtual Reality Rehabilitation System Revenue Share (%), by Country 2024 & 2032
- Figure 8: South America Virtual Reality Rehabilitation System Revenue (million), by Application 2024 & 2032
- Figure 9: South America Virtual Reality Rehabilitation System Revenue Share (%), by Application 2024 & 2032
- Figure 10: South America Virtual Reality Rehabilitation System Revenue (million), by Types 2024 & 2032
- Figure 11: South America Virtual Reality Rehabilitation System Revenue Share (%), by Types 2024 & 2032
- Figure 12: South America Virtual Reality Rehabilitation System Revenue (million), by Country 2024 & 2032
- Figure 13: South America Virtual Reality Rehabilitation System Revenue Share (%), by Country 2024 & 2032
- Figure 14: Europe Virtual Reality Rehabilitation System Revenue (million), by Application 2024 & 2032
- Figure 15: Europe Virtual Reality Rehabilitation System Revenue Share (%), by Application 2024 & 2032
- Figure 16: Europe Virtual Reality Rehabilitation System Revenue (million), by Types 2024 & 2032
- Figure 17: Europe Virtual Reality Rehabilitation System Revenue Share (%), by Types 2024 & 2032
- Figure 18: Europe Virtual Reality Rehabilitation System Revenue (million), by Country 2024 & 2032
- Figure 19: Europe Virtual Reality Rehabilitation System Revenue Share (%), by Country 2024 & 2032
- Figure 20: Middle East & Africa Virtual Reality Rehabilitation System Revenue (million), by Application 2024 & 2032
- Figure 21: Middle East & Africa Virtual Reality Rehabilitation System Revenue Share (%), by Application 2024 & 2032
- Figure 22: Middle East & Africa Virtual Reality Rehabilitation System Revenue (million), by Types 2024 & 2032
- Figure 23: Middle East & Africa Virtual Reality Rehabilitation System Revenue Share (%), by Types 2024 & 2032
- Figure 24: Middle East & Africa Virtual Reality Rehabilitation System Revenue (million), by Country 2024 & 2032
- Figure 25: Middle East & Africa Virtual Reality Rehabilitation System Revenue Share (%), by Country 2024 & 2032
- Figure 26: Asia Pacific Virtual Reality Rehabilitation System Revenue (million), by Application 2024 & 2032
- Figure 27: Asia Pacific Virtual Reality Rehabilitation System Revenue Share (%), by Application 2024 & 2032
- Figure 28: Asia Pacific Virtual Reality Rehabilitation System Revenue (million), by Types 2024 & 2032
- Figure 29: Asia Pacific Virtual Reality Rehabilitation System Revenue Share (%), by Types 2024 & 2032
- Figure 30: Asia Pacific Virtual Reality Rehabilitation System Revenue (million), by Country 2024 & 2032
- Figure 31: Asia Pacific Virtual Reality Rehabilitation System Revenue Share (%), by Country 2024 & 2032
List of Tables
- Table 1: Global Virtual Reality Rehabilitation System Revenue million Forecast, by Region 2019 & 2032
- Table 2: Global Virtual Reality Rehabilitation System Revenue million Forecast, by Application 2019 & 2032
- Table 3: Global Virtual Reality Rehabilitation System Revenue million Forecast, by Types 2019 & 2032
- Table 4: Global Virtual Reality Rehabilitation System Revenue million Forecast, by Region 2019 & 2032
- Table 5: Global Virtual Reality Rehabilitation System Revenue million Forecast, by Application 2019 & 2032
- Table 6: Global Virtual Reality Rehabilitation System Revenue million Forecast, by Types 2019 & 2032
- Table 7: Global Virtual Reality Rehabilitation System Revenue million Forecast, by Country 2019 & 2032
- Table 8: United States Virtual Reality Rehabilitation System Revenue (million) Forecast, by Application 2019 & 2032
- Table 9: Canada Virtual Reality Rehabilitation System Revenue (million) Forecast, by Application 2019 & 2032
- Table 10: Mexico Virtual Reality Rehabilitation System Revenue (million) Forecast, by Application 2019 & 2032
- Table 11: Global Virtual Reality Rehabilitation System Revenue million Forecast, by Application 2019 & 2032
- Table 12: Global Virtual Reality Rehabilitation System Revenue million Forecast, by Types 2019 & 2032
- Table 13: Global Virtual Reality Rehabilitation System Revenue million Forecast, by Country 2019 & 2032
- Table 14: Brazil Virtual Reality Rehabilitation System Revenue (million) Forecast, by Application 2019 & 2032
- Table 15: Argentina Virtual Reality Rehabilitation System Revenue (million) Forecast, by Application 2019 & 2032
- Table 16: Rest of South America Virtual Reality Rehabilitation System Revenue (million) Forecast, by Application 2019 & 2032
- Table 17: Global Virtual Reality Rehabilitation System Revenue million Forecast, by Application 2019 & 2032
- Table 18: Global Virtual Reality Rehabilitation System Revenue million Forecast, by Types 2019 & 2032
- Table 19: Global Virtual Reality Rehabilitation System Revenue million Forecast, by Country 2019 & 2032
- Table 20: United Kingdom Virtual Reality Rehabilitation System Revenue (million) Forecast, by Application 2019 & 2032
- Table 21: Germany Virtual Reality Rehabilitation System Revenue (million) Forecast, by Application 2019 & 2032
- Table 22: France Virtual Reality Rehabilitation System Revenue (million) Forecast, by Application 2019 & 2032
- Table 23: Italy Virtual Reality Rehabilitation System Revenue (million) Forecast, by Application 2019 & 2032
- Table 24: Spain Virtual Reality Rehabilitation System Revenue (million) Forecast, by Application 2019 & 2032
- Table 25: Russia Virtual Reality Rehabilitation System Revenue (million) Forecast, by Application 2019 & 2032
- Table 26: Benelux Virtual Reality Rehabilitation System Revenue (million) Forecast, by Application 2019 & 2032
- Table 27: Nordics Virtual Reality Rehabilitation System Revenue (million) Forecast, by Application 2019 & 2032
- Table 28: Rest of Europe Virtual Reality Rehabilitation System Revenue (million) Forecast, by Application 2019 & 2032
- Table 29: Global Virtual Reality Rehabilitation System Revenue million Forecast, by Application 2019 & 2032
- Table 30: Global Virtual Reality Rehabilitation System Revenue million Forecast, by Types 2019 & 2032
- Table 31: Global Virtual Reality Rehabilitation System Revenue million Forecast, by Country 2019 & 2032
- Table 32: Turkey Virtual Reality Rehabilitation System Revenue (million) Forecast, by Application 2019 & 2032
- Table 33: Israel Virtual Reality Rehabilitation System Revenue (million) Forecast, by Application 2019 & 2032
- Table 34: GCC Virtual Reality Rehabilitation System Revenue (million) Forecast, by Application 2019 & 2032
- Table 35: North Africa Virtual Reality Rehabilitation System Revenue (million) Forecast, by Application 2019 & 2032
- Table 36: South Africa Virtual Reality Rehabilitation System Revenue (million) Forecast, by Application 2019 & 2032
- Table 37: Rest of Middle East & Africa Virtual Reality Rehabilitation System Revenue (million) Forecast, by Application 2019 & 2032
- Table 38: Global Virtual Reality Rehabilitation System Revenue million Forecast, by Application 2019 & 2032
- Table 39: Global Virtual Reality Rehabilitation System Revenue million Forecast, by Types 2019 & 2032
- Table 40: Global Virtual Reality Rehabilitation System Revenue million Forecast, by Country 2019 & 2032
- Table 41: China Virtual Reality Rehabilitation System Revenue (million) Forecast, by Application 2019 & 2032
- Table 42: India Virtual Reality Rehabilitation System Revenue (million) Forecast, by Application 2019 & 2032
- Table 43: Japan Virtual Reality Rehabilitation System Revenue (million) Forecast, by Application 2019 & 2032
- Table 44: South Korea Virtual Reality Rehabilitation System Revenue (million) Forecast, by Application 2019 & 2032
- Table 45: ASEAN Virtual Reality Rehabilitation System Revenue (million) Forecast, by Application 2019 & 2032
- Table 46: Oceania Virtual Reality Rehabilitation System Revenue (million) Forecast, by Application 2019 & 2032
- Table 47: Rest of Asia Pacific Virtual Reality Rehabilitation System Revenue (million) Forecast, by Application 2019 & 2032
Frequently Asked Questions
1. What is the projected Compound Annual Growth Rate (CAGR) of the Virtual Reality Rehabilitation System?
The projected CAGR is approximately XX%.
2. Which companies are prominent players in the Virtual Reality Rehabilitation System?
Key companies in the market include Reflexion Health, 270 Vision Ltd, CoRehab srl, Hinge Health, SWORD Health, MIRA Rehab Limited, Bridgeway Senior Healthcare, Motekmedical, GestureTek Inc, Motorika Medical Ltd, Mobility Research (LiteGait), Doctor Kinetic.
3. What are the main segments of the Virtual Reality Rehabilitation System?
The market segments include Application, Types.
4. Can you provide details about the market size?
The market size is estimated to be USD XXX million as of 2022.
5. What are some drivers contributing to market growth?
N/A
6. What are the notable trends driving market growth?
N/A
7. Are there any restraints impacting market growth?
N/A
8. Can you provide examples of recent developments in the market?
N/A
9. What pricing options are available for accessing the report?
Pricing options include single-user, multi-user, and enterprise licenses priced at USD 4900.00, USD 7350.00, and USD 9800.00 respectively.
10. Is the market size provided in terms of value or volume?
The market size is provided in terms of value, measured in million.
11. Are there any specific market keywords associated with the report?
Yes, the market keyword associated with the report is "Virtual Reality Rehabilitation System," which aids in identifying and referencing the specific market segment covered.
12. How do I determine which pricing option suits my needs best?
The pricing options vary based on user requirements and access needs. Individual users may opt for single-user licenses, while businesses requiring broader access may choose multi-user or enterprise licenses for cost-effective access to the report.
13. Are there any additional resources or data provided in the Virtual Reality Rehabilitation System report?
While the report offers comprehensive insights, it's advisable to review the specific contents or supplementary materials provided to ascertain if additional resources or data are available.
14. How can I stay updated on further developments or reports in the Virtual Reality Rehabilitation System?
To stay informed about further developments, trends, and reports in the Virtual Reality Rehabilitation System, consider subscribing to industry newsletters, following relevant companies and organizations, or regularly checking reputable industry news sources and publications.
Methodology
Step 1 - Identification of Relevant Samples Size from Population Database


Step 2 - Approaches for Defining Global Market Size (Value, Volume* & Price*)

Note*: In applicable scenarios
Step 3 - Data Sources
Primary Research
- Web Analytics
- Survey Reports
- Research Institute
- Latest Research Reports
- Opinion Leaders
Secondary Research
- Annual Reports
- White Paper
- Latest Press Release
- Industry Association
- Paid Database
- Investor Presentations

Step 4 - Data Triangulation
Involves using different sources of information in order to increase the validity of a study
These sources are likely to be stakeholders in a program - participants, other researchers, program staff, other community members, and so on.
Then we put all data in single framework & apply various statistical tools to find out the dynamic on the market.
During the analysis stage, feedback from the stakeholder groups would be compared to determine areas of agreement as well as areas of divergence


